![]()
Palladium One Begins 2,000-Meter Phase II Drilling and Outlines EM Conductors at Smoke Lake High-Grade Sulphide Nickel Zone of the Tyko Project in Ontario
Toronto, Ontario–(Newsfile Corp. – April 6, 2021) – A 2,000-meter Phase II drilling program at the high-grade Smoke Lake nickel discovery, which returned up to 9.9% Ni_Eq over 3.8 meters from surface (see press release January 19, 2021), on the Tyko Sulphide-Nickel-Copper project in Ontario, Canada, has started, said Palladium One Mining Inc. (TSXV: PDM) (FSE: 7N11) (OTCQB: NKORF) (“Palladium One” or the “Company”) today. In advance of drilling, in February 2021, detailed ground based Electromagnetic (“EM”) and Borehole Electromagnetic (“BHEM”) surveys were conducted to better define the conductors hosting the high-grade nickel mineralization.
EM and BHEM surveys conducted at Smoke Lake outlined two conductors, the deeper one was intersected by a single drill hole returning 6.3% Ni_Eq over 0.9 meters (see press release January 19, 2021) during the December 2020 drill program. This lower conductor extends beyond the EM survey grid to the northwest, where it remains open for extension.
“Given the very encouraging results at Smoke Lake, we have commissioned a 3,000-line kilometer, high-resolution airborne, Versatile Time-Domain Electromagnetic (VTEM™ Max) survey covering the entire Tyko Nickel-Copper Project, which includes the Bulldozer mafic-ultramafic Intrusion, the objective of which is the discovery of additional EM anomalies such as the Smoke Lake anomaly. The survey is expected to be flown in May 2021,” said Derrick Weyrauch, President and CEO.
“In addition to the work conducted at Smoke Lake in Q1 2021, the Company also completed a short reconnaissance drill program of 1,233 meters in 5 drill holes and both EM and BHEM surveys on its Disraeli PGE-Ni-Cu project, located in Ontario, Canada and within the prolific mid-continental rift.”
“Significant cobalt bearing magnetite skarn mineralization was intersected. Notably, down hole geophysics outlined an off-hole conductor at the basement contact that may represent a mafic-ultramafic feeder system to the Disraeli Intrusion, which requires follow up,” said Weyrauch.
Highlights
- A 2,000-meter Phase II drilling program on the Smoke Lake high-grade sulphide nickel discovery at the Tyko Sulphide Nickel Project has started.
- Ground based and borehole EM surveys have outlined two significant conductors at Smoke Lake, one of which extends beyond the survey area, where it remains open for extension.
- High-resolution drone based magnetic survey data suggests a larger magnetic body occurs at depth, below and to the northeast of the Smoke Lake discovery.
- 3,000-line kilometer airborne VTEM™ Max survey scheduled to be flown in May 2021 over the entire Tyko Sulphide-Nickel-Copper project.
- Disraeli project drilling intersects cobalt bearing magnetite skarn mineralization.
Tyko Phase II Drilling Program and EM Surveys, Ontario, Canada
A 2,000-meter Phase II drilling program at the high-grade sulphide-nickel discovery of Smoke Lake has started. From surface, the Smoke Lake zone returned 9.9% Ni Eq over 3.8 meters (8.13 % Ni, 2.88% Cu, 0.11% Co, 0.61 g/t Pd, 0.71 g/t Pt and 0.02 g/t Au), (see news release January 19, 2021). This Phase II program is designed to infill and expand the high-grade sulphide-nickel mineralization. The program is expected to continue until the start of spring weather conditions.
In February 2021, high-resolution ground-based and borehole EM surveys were conducted at Smoke Lake. This second ground-based survey was undertaken to supplement the initial reconnaissance survey conducted in October 2020 (see press release December 7, 2020) . The February 2021 survey provided excellent data and allowed the modeling of two conductive plates (Figure 1) which closely match the drilling results to date (Figure 1 and 2). These plates consist of smaller highly conductive near surface plate and a larger less conductive but more expansive plate. The most significant result from this survey is that the lower most conductor continues off the survey grid area, to the northwest where it remains open for expansion.
In addition to the EM surveys, the Company commission an inversion of the high-resolution drone based magnetic survey which was flown in 2020 (see press release December 7, 2020). The inversion model shows a large southwest plunging body at depth, below the Smoke Lake zone. The Smoke Lake zone is associated with a strong magnetic high at surface and an elevated magnetic response at depth (Figure 3). This deep magnetic body may represent mafic-ultramafic rocks associated with the Smoke Lake nickel mineralization, and is a high priority target.
The Company has contracted to fly a 3,000-line kilometer high resolution (100-meter line spacing) airborne EM and magnetic survey using the VTEM™ Max system. The Tyko project encompasses 200 square kilometers, the vast majority of which has seen little to no exploration or even government regional mapping. The western portion of the project has been the subject of several historic airborne EM surveys, using the technology of that time (Figure 4.), however the eastern portion is only partially covered by a 1980’s Noranda survey.
Notably it was the old 1980’s survey that detected the Smoke Lake EM anomaly at the very end of one of the flight lines (Figure 4). There is very limited airborne EM coverage surrounding the high-grade Smoke Lake nickel discovery, and absolutely no survey coverage to the south. This “terra incognita” is highly prospective for additional massive nickel sulphide discoveries, as it also hosts the Company’s Shabotik showing which has returned up to 1.0 % nickel in grab samples (see press release August 19, 2019).
Table 1: Tyko 2020 Drill Results from the Smoke Lake Discovery
| Hole | From (m) | To (m) | Width (m) | Ni_Eq % | Ni_Eq lbs/t | Ni % | Cu % | Co % | PGE g/t (Pd+Pt+Au) | Pd g/t | Pt g/t | Au g/t |
| TK-20-015 | 30.0 | 32.4 | 2.3 | 4.78 | 105 | 3.90 | 1.41 | 0.05 | 0.84 | 0.48 | 0.35 | 0.01 |
| Inc. | 31.4 | 32.4 | 1.0 | 8.04 | 177 | 7.26 | 0.85 | 0.09 | 1.05 | 0.57 | 0.48 | 0.01 |
| TK-20-016 | 29.0 | 32.8 | 3.8 | 8.74 | 193 | 6.65 | 3.70 | 0.09 | 1.51 | 0.67 | 0.81 | 0.03 |
| Inc. | 29.8 | 32.5 | 2.7 | 9.80 | 216 | 7.47 | 4.16 | 0.10 | 1.64 | 0.74 | 0.87 | 0.03 |
| Inc. | 29.8 | 30.3 | 0.5 | 10.05 | 221 | 8.20 | 3.08 | 0.10 | 1.50 | 0.88 | 0.58 | 0.04 |
| TK-20-017 | 28.1 | 32.3 | 4.2 | 1.71 | 38 | 1.17 | 0.99 | 0.02 | 0.32 | 0.18 | 0.14 | 0.01 |
| Inc. | 29.0 | 31.1 | 2.1 | 3.08 | 68 | 2.14 | 1.75 | 0.03 | 0.58 | 0.32 | 0.25 | 0.01 |
| Inc. | 29.9 | 30.5 | 0.6 | 5.20 | 115 | 3.88 | 2.34 | 0.05 | 0.98 | 0.52 | 0.45 | 0.02 |
| TK-20-018 | 36.6 | 37.6 | 1.0 | 1.34 | 30 | 0.95 | 0.54 | 0.02 | 0.52 | 0.30 | 0.21 | 0.01 |
| TK-20-019 | 28.7 | 30.4 | 1.7 | 5.87 | 129 | 3.89 | 3.90 | 0.06 | 0.94 | 0.45 | 0.48 | 0.02 |
| Inc. | 29.5 | 30.4 | 0.8 | 8.71 | 192 | 6.17 | 4.73 | 0.09 | 1.59 | 0.79 | 0.78 | 0.02 |
| TK-20-020 | 32.1 | 38.7 | 6.6 | 0.92 | 20 | 0.65 | 0.45 | 0.01 | 0.20 | 0.09 | 0.11 | 0.00 |
| Inc. | 32.1 | 34.1 | 2.0 | 1.86 | 41 | 1.29 | 1.07 | 0.02 | 0.37 | 0.18 | 0.19 | 0.01 |
| TK-20-021 | 47.8 | 49.6 | 1.8 | 3.91 | 86 | 2.75 | 1.79 | 0.09 | 0.97 | 0.38 | 0.58 | 0.02 |
| Inc. | 47.8 | 49.0 | 1.2 | 5.38 | 119 | 3.76 | 2.49 | 0.13 | 1.31 | 0.50 | 0.79 | 0.03 |
| TK-20-022 | 46.8 | 51.0 | 4.2 | 7.46 | 164 | 5.83 | 2.74 | 0.09 | 1.28 | 0.56 | 0.70 | 0.01 |
| Inc. | 48.5 | 50.6 | 2.1 | 8.78 | 193 | 7.26 | 2.34 | 0.12 | 1.30 | 0.48 | 0.81 | 0.01 |
| TK-20-023 | 5.3 | 12.8 | 7.5 | 6.07 | 134 | 4.49 | 2.86 | 0.06 | 1.01 | 0.44 | 0.55 | 0.02 |
| Inc. | 8.9 | 12.8 | 3.8 | 9.87 | 218 | 8.13 | 2.88 | 0.11 | 1.33 | 0.61 | 0.71 | 0.02 |
| Inc. | 8.9 | 10.5 | 1.6 | 11.05 | 244 | 9.80 | 1.67 | 0.13 | 1.27 | 0.54 | 0.72 | 0.01 |
| Inc. | 9.5 | 10.0 | 0.5 | 11.21 | 247 | 10.30 | 0.80 | 0.15 | 1.25 | 0.50 | 0.74 | 0.02 |
| TK-20-024 | 109.0 | 109.9 | 0.9 | 6.27 | 138 | 5.42 | 0.96 | 0.07 | 1.40 | 0.71 | 0.68 | 0.01 |
| Inc. | 109.0 | 109.6 | 0.6 | 7.85 | 173 | 7.01 | 0.63 | 0.09 | 1.80 | 0.93 | 0.86 | 0.01 |
| TK-20-025 | 36.6 | 39.8 | 3.2 | 6.32 | 139 | 4.43 | 3.63 | 0.07 | 0.87 | 0.43 | 0.41 | 0.02 |
| Inc. | 36.6 | 38.8 | 2.2 | 8.72 | 192 | 6.15 | 4.94 | 0.10 | 1.19 | 0.60 | 0.56 | 0.03 |
| Inc. | 37.2 | 37.8 | 0.6 | 11.82 | 261 | 9.65 | 3.69 | 0.13 | 1.48 | 0.94 | 0.53 | 0.01 |
| TK-20-026 | 49.5 | 56.5 | 7.1 | 0.47 | 10 | 0.26 | 0.39 | 0.01 | 0.12 | 0.04 | 0.06 | 0.03 |
| Inc. | 52.7 | 53.3 | 0.6 | 1.32 | 29 | 0.48 | 1.72 | 0.02 | 0.25 | 0.09 | 0.15 | 0.01 |
| TK-20-027 | 15.8 | 29.5 | 13.7 | 0.25 | 5 | 0.16 | 0.15 | 0.00 | 0.05 | 0.02 | 0.03 | 0.00 |
| Inc. | 18.8 | 21.7 | 2.9 | 0.67 | 15 | 0.48 | 0.29 | 0.01 | 0.19 | 0.08 | 0.11 | 0.00 |
(1) Reported widths are “drilled widths” not true widths.
(2) Shaded results are previously released, see press release January 5, 2020, January 12, 2021, January 19, 2021
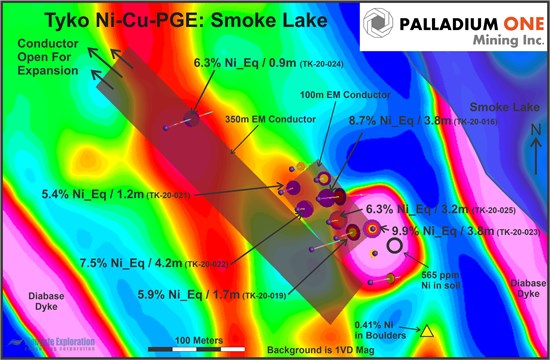
Figure 1. Smoke Lake location map showing new EM plates with 2020 drill holes overlain on first vertical magnetics.
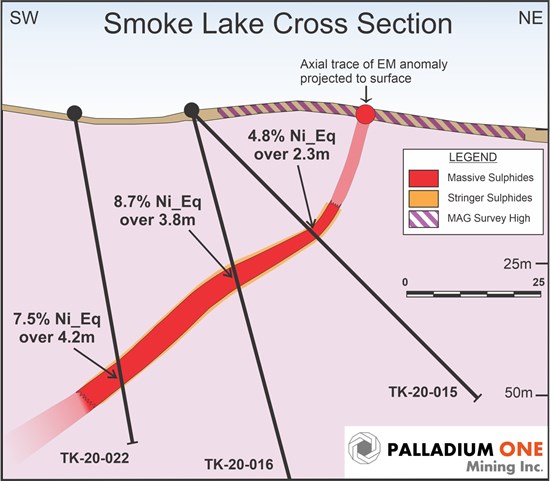
Figure 2. Cross Section of the Smoke Lake zone showing 2020 drill holes. (see news release January 12, 2021)
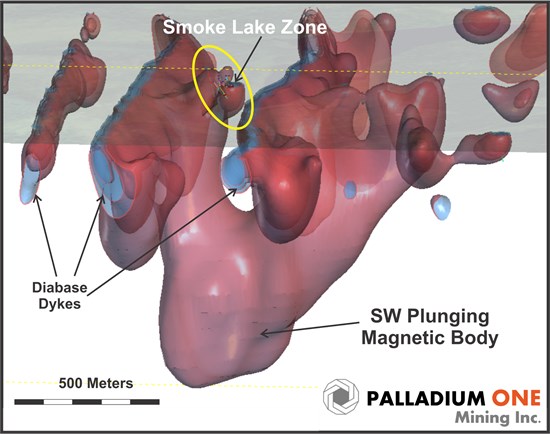
Figure 3. Isometric view of the Smoke Lake zone area looking north-northwest showing 2020 drill holes and inverted drone based high-resolution magnetic isoshells.
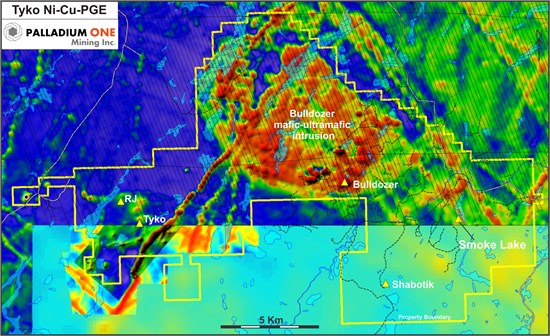
Figure 4. Tyko Project showing total field magnetics and mineralized zones (yellow triangles). Fight lines (in black) for 1980’s Noranda survey are shown to illustrate how it detected the Smoke Lake EM anomaly at the very end of a line.
Disraeli PGE-Ni-Cu Project Drilling and EM Surveys, Ontario, Canada
In January 2021, the Company constructed a 2-kilometre ice road and then drilled 5 ice-based holes totalling 1,233 meters to test several airborne EM conductors and a reversely polarized magnetic body under Hook bay of Disraeli Lake (see news release December 9, 2020). One conductor was found to be caused by massive magnetite copper-cobalt-nickel Skarn, while several of the airborne EM conductors proved to be the result of lake sediments. (Figure 5), (Table 2). The reversely polarized magnetic body requires additional follow up as it was not adequately explained, it may be the result of a reversely polarized granophyric sill located below the Disraeli Intrusion and/or a magnetite skarn.
Borehole EM surveys were conducted on all holes drilled and were hindered by very high background conductivity, which may be the result of saline brines in the Sibley Formation sediments. Of particular note was an off-hole EM conductor identified at the Sibley – Quetico (metasedimentary basement rocks) contact (Figure 6). Unseasonably warm conditions in early March resulted in deterioration of the ice road, cutting the drill program short and thus this target was not able to be tested. This target remains a priority target.
The copper-cobalt-nickel magnetite skarn is of particular interest as it is enriched in cobalt (Table 2). The mineralization intersected in the recent program is very similar to skarn mineralization intersected 1.5 kilometers to the south in holes U17-01 and U17-02 by a previous operator. These holes intersected up to 0.13 % cobalt over 2.0 meters and 0.16 % cobalt over 0.45 meters respectively.
This cobalt bearing skarn-style mineralization has now been intersected by 4 holes on the Disraeli project indicating it is much more widespread that previously thought. The mineralization is hosted in the carbonate-rich (dolomite) Rossport unit of the Sibley Formation, mostly likely representing replacement of stromatolitic beds within the sediments. It consists of massive to stringer magnetite with 10-20% sulphides consisting of pyrite, pyrrhotite, and chalcopyrite (Figure 7).This skarn mineralization is indicative of widespread hydrothermal alteration associated with either the Disraeli intrusion or another unknown mafic-ultramafic intrusion at depth. Additional, copper mineralization is known to occur in the greater Disraeli Lake area as chalcocite and malachite hosted in stromatolites with the Sibley sediments, grab samples collected by the Ministry of Northern development in 2011 returned up to 1.57% Cu (Mineral Deposit Index MDI52H02NW00002) from this style of mineralization. All of this indicates a significant magmatic hydrothermal system was present in the Disraeli Lake area, and suggests thicker and higher-grade areas of cobalt skarn mineralization are yet to be discovered.
Table 2: Disraeli Significant Drill Hole Intersections
| Operator | Hole | From (m) | To (m) | Width (m) | Cu % | Co % | Ni % |
| Ursa Major | U17-01 | 133.50 | 138.95 | 5.45 | 0.12 | 0.07 | 0.05 |
| Inc. | 136.00 | 138.00 | 2.00 | 0.11 | 0.13 | 0.06 | |
| Ursa Major | U17-02 | 114.95 | 119.97 | 5.02 | 0.14 | 0.07 | 0.07 |
| Inc. | 116.93 | 117.38 | 0.45 | 0.13 | 0.16 | 0.12 | |
| Palladium One | DL21-001 | No Significant Intersections | |||||
| Palladium One | DL21-002 | 127.10 | 129.73 | 2.63 | 0.12 | 0.05 | 0.09 |
| Palladium One | DL21-003 | No Significant Intersections | |||||
| Palladium One | DL21-004 | No Significant Intersections | |||||
| Palladium One | DL21-005 | 127.65 | 129.90 | 2.25 | 0.04 | 0.03 | 0.00 |
* Reported widths are “drilled widths” not true widths.
** Orange shaded values are historic previously released results (see Ursa Major Inc. press release June 2, 2011)
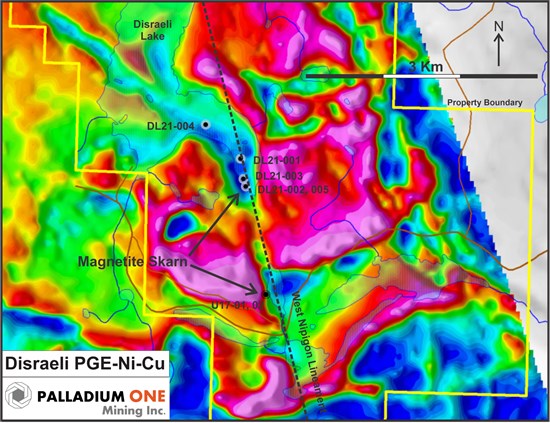
Figure 5. Disraeli drill hole location map, background is total field magnetics.
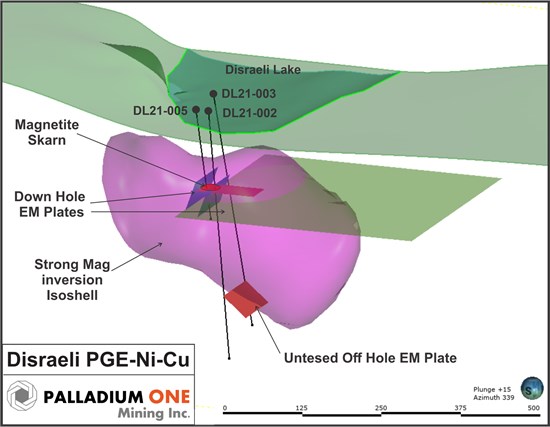
Figure 6. Disraeli Project Isometric view looking north-northwest, showing the location of holes DL21-002, 003 and 005 along with down Hole EM plates and VOXI inverted strongly magnetic body.
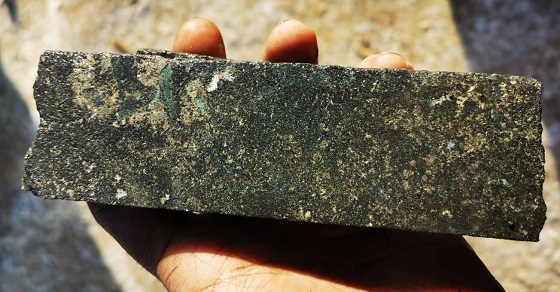
Figure 7. Cu-Co-Ni mineralized massive magnetite skarn mineralization form hole DL21-002.
*Nickel Equivalent (“Ni_Eq”)
Nickel equivalent is calculated using US$1,100 per ounce for palladium, US$950 per ounce for platinum, US$1,300 per ounce for gold, US$6,614 per tonne (US$3.00 per pound) for copper, US$15,432 per tonne (US$7.00 per pound) for nickel and US$30,865 per tonne (US$14 per pound) for Cobalt. This calculation is consistent with the commodity prices used in the Company’s September 2019 NI 43-101 Kaukua resource estimate.
QA/QC
The Phase I drilling program was carried out under the supervision of Neil Pettigrew, M.Sc., P. Geo., Vice President of Exploration and a director of the Company.
Drill core samples were split using a rock saw by Company staff, with half retained in the core box. The drill core samples were transported by company staff the Company’s core handling facility, to Actlabs laboratory in Thunder Bay, Ontario. Actlabs, is an accredited lab and are ISO compliant (ISO 9001:2015, ISO/IEC 17025:2017). PGE analysis was performed using a 30 grams fire assay with an ICP-MS or ICP-OES finish. Multi-element analyses, including copper and nickel were analysed by four acid digestion using 0.5 grams with an ICP-MS or ICP-OES finish.
Certified standards, blanks and crushed duplicates are placed in the sample stream at a rate of one QA/QC sample per 10 core samples. Results are analyzed for acceptance at the time of import. All standards associated with the results in this press release were determined to be acceptable within the defined limits of the standard used
About Tyko Ni-Cu-PGE Project
The Tyko Ni-Cu-PGE Project, is located approximately 65 kilometers northeast of Marathon Ontario, Canada. Tyko is an early stage, high sulphide tenor, nickel focused project with the most recent drill hole intercepts returning up to 9.9% Ni_Eq over 3.8 meters (8.1% Ni, 2.9% Cu, 1.3g/t PGE) in hole TK-20-023.
Qualified Person
The technical information in this release has been reviewed and verified by Neil Pettigrew, M.Sc., P. Geo., Vice President of Exploration and a director of the Company and the Qualified Person as defined by National Instrument 43-101.
About Palladium One
Palladium One Mining Inc. is an exploration company targeting district scale, platinum-group-element (PGE)-copper nickel deposits in Finland and Canada. Its flagship project is the Läntinen Koillismaa or LK Project, a palladium dominant platinum group element-copper-nickel project in north-central Finland, ranked by the Fraser Institute as one of the world’s top countries for mineral exploration and development. Exploration at LK is focused on targeting disseminated sulfides along 38 kilometers of favorable basal contact and building on an established NI 43-101 open pit resource.
ON BEHALF OF THE BOARD
“Derrick Weyrauch”
President & CEO, Director
For further information contact: Derrick Weyrauch, President & CEO
Email: info@palladiumoneinc.com
Neither the TSX Venture Exchange nor its Market Regulator (as that term is defined in the policies of the TSX Venture Exchange) accepts responsibility for the adequacy or accuracy of this release.
This press release includes “forward-looking information” that is subject to a few assumptions, risks and uncertainties, many of which are beyond the control of the Company. Statements regarding listing of the Company’s common shares on the TSXV are subject to all of the risks and uncertainties normally incident to such events. Investors are cautioned that any such statements are not guarantees of future events and that actual events or developments may differ materially from those projected in the forward-looking statements. Such forward-looking statements represent management’s best judgment based on information currently available. Factors that could cause the actual results to differ materially from those in forward-looking statements include regulatory actions and general business conditions. Such forward-looking information reflects the Company’s views with respect to future events and is subject to risks, uncertainties and assumptions, including those set out in the Company’s annual information form dated April 29, 2020 and filed under the Company’s profile on SEDAR at www.sedar.com. The Company does not undertake to update forward?looking statements or forward?looking information, except as required by law. Investors are cautioned that any such statements are not guarantees of future performance and actual results or developments may differ materially from those projected in the forward-looking statements.