CanAlaska Identifies New Targets at Kingston Uranium Project
Historical Uranium Boulder Train Located Near Collins Bay Fault
Electromagnetic and Gravity Anomalies Define Shallow Targets Along Major Faults
West McArthur “42 Zone” Successfully Extended – Drilling Continues
Vancouver, British Columbia–(Newsfile Corp. – September 30, 2021) – CanAlaska Uranium Ltd. (TSXV: CVV) (OTCQB: CVVUF) (FSE: DH7N) (“CanAlaska” or the “Company”) is pleased to announce that compilation work on the Company’s newly acquired Kingston Project has identified several new uranium targets. The targets are outlined by coincident electromagnetic (EM) and gravity anomalies, and a uranium-rich boulder train located just down-ice from the Collins Bay Fault structure (Figure 1).
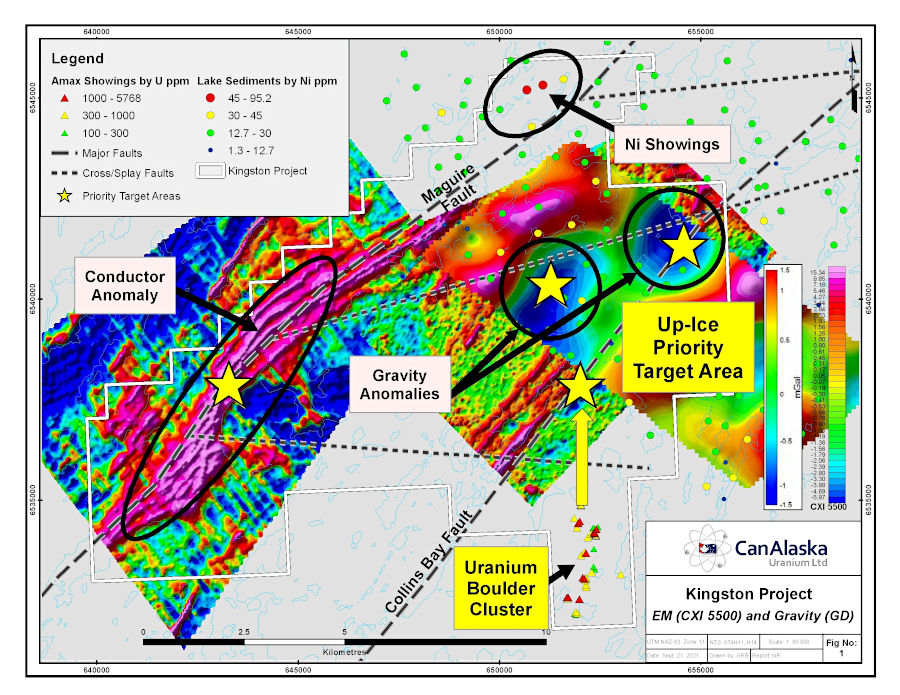
Figure 1
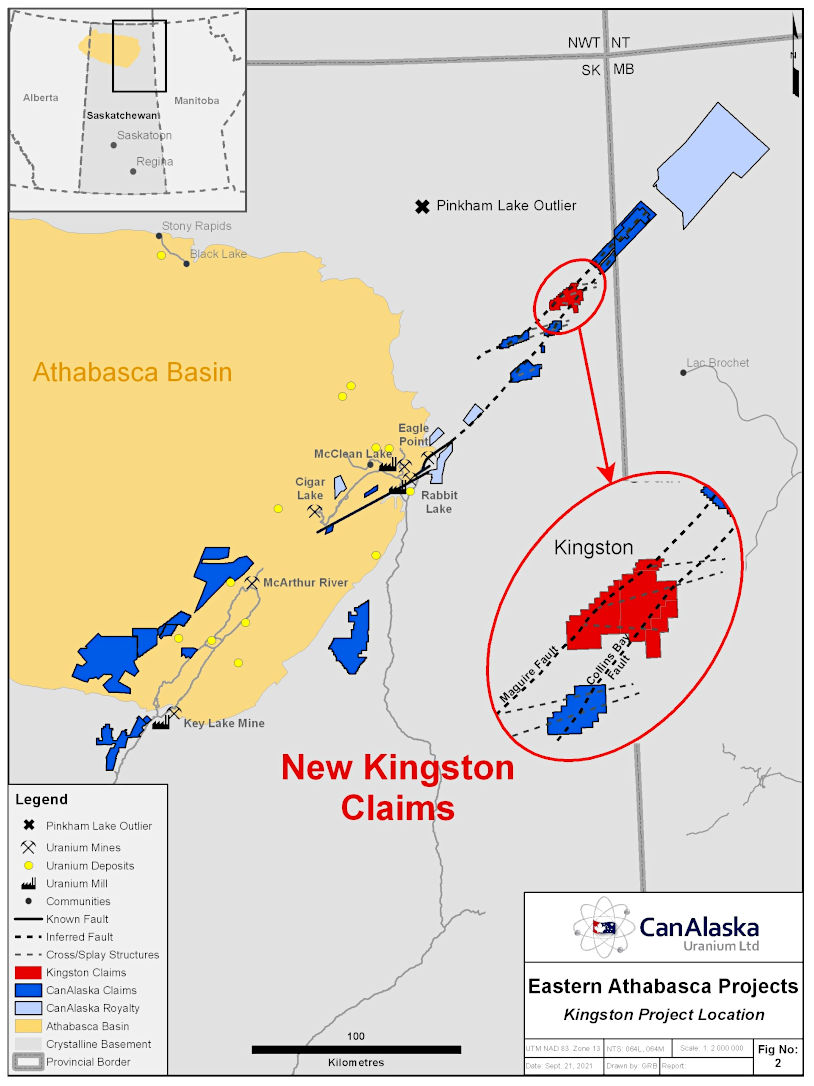
Figure 2
The Collins Bay Fault is host to the Rabbit Lake, Collins Bay A, B and D, and Eagle Point orebodies, which, since 1975, have produced more than 200 million pounds of uranium. The location of these deposits along the length of the Collins Bay Fault system is largely controlled by interaction of the main, regional dextral reverse fault with bends or flexures of the main structure, splay structures coming off the main structure, or interaction with cross-cutting structures. The Maguire Fault hosts the Maguire zone of alteration and uranium mineralization on CanAlaska’s claims in northwest Manitoba.
During the mineralizing event, the host-rock is altered to clay, which can be imaged by geophysical methods such as EM and gravity. The coupling of EM “bright-spots” with gravity lows is a possible indication of the clay alteration associated with these significant mineralizing events. EM “bright-spots” were successfully used to discover an extension of the Eagle Point orebody (02 Next deposit) and drilling of a gravity low anomaly led to discovery of NexGen’s Arrow deposit, host to 337 million pounds of uranium resources.
The Kingston project is strategically located less than 100 kilometres northeast of the northeastern margin of the present-day Athabasca Basin within the Western Wollaston Domain, just east of the Wollaston-Mudjatik contact (Figure 2). Historical exploration in the area has been concentrated in two periods. Prospecting and geological mapping, lake sediment sampling, airborne and ground geophysical surveys, and limited diamond drilling work was completed from 1958 to 1980. Airborne and ground geophysical surveys including DIGHEM, Falcon and ZTEM, soil/rock/lake sediment sampling, prospecting and geological mapping occurred from 2004 to 2016. The various geophysical surveys map conductors and gravity anomalies coincident with two regional structures, the Collins Bay Fault and the Maguire Fault. Previous exploration within the project area has identified a large uranium-rich boulder train in the southeast corner of the project that is immediately down-ice of the Collins Bay Fault. Uranium-rich boulders with up to 0.57% (5,768 ppm) uranium have been reported. Anomalous nickel in lake sediments were identified along the Maguire Fault in the northeast corner of the property. Four high priority target areas have been identified (Figure 1).
West McArthur “42 Zone” Drilling Update
Diamond drilling at the Company’s West McArthur JV project is progressing as planned and has been successful in expanding the “42 Zone” discovery. Three diamond drill holes have reached the unconformity to date for a total of 2,946 m of drilling. The Company plans to complete an additional two to three diamond drill holes within the 42 Zone area for a targeted total meterage of 5,000 m.
Drill hole WMA063-1 intersected 16.1 m of elevated radioactivity immediately above the unconformity 32 m along strike to the west of drill hole WMA055-2 in the Company’s 42 Zone area. WMA055-2 intersected 2.1 m averaging 2.3% U3O8, including 0.7 m at 6.8% U3O8 (see press release dated October 15th, 2019). The new uranium intersection in WMA063-1 is thicker and contained within a strongly bleached lower sandstone column that contains dark black sooty pyrite, red hydrothermal hematite, and structurally-controlled strong clay alteration. Due to the strong clay alteration and faulting, core recovery is approximately 25% through two three-metre wide intervals within the mineralized zone above the unconformity. Geochemical assays of the mineralization, expected after the program is complete, will be used in conjunction with radiometric probing equivalents data to evaluate the grade and thickness of this new mineralization which extends the 42 Zone.
Southwest of the 42 Zone area two drill holes have been completed along the extension of the Grid 5 conductive corridor and controlling structure. Drill hole WMA061, drilled 700 m to the southwest of the 42 Zone, intersected the unconformity 68 m north-northwest of WMA049-1. WMA061 intersected a broad interval of faults in the lower sandstone column associated with bleached sandstone, increased interstitial clay, patches of sooty pyrite, remobilized hematite, and structurally-controlled limonite and clay alteration. The sandstone structure and alteration indicate that WMA061 intersected the unconformity approximately 30 m north of the ideal target, leaving the target open on this fence.
Drill hole WMA062, drilled 1.8 km to the southwest of the 42 Zone, intersected the unconformity 38 m northwest of WMA040. WMA062 intersected a 30 m wide fault in the lower sandstone column with strong limonite alteration, patches of grey sooty pyrite, and structurally-controlled dravitic breccias. In the basement of WMA062, the top of the targeted fault zone was intersected 10 m below the unconformity and is characterized by a 20 m wide interval of quartz-healed hydraulic breccias and localized re-activated clay gouge with strong hematite, chlorite, bleaching, sericite, and specular hematite alteration. This is followed by a second 8 m wide fault zone that contains abundant re-activated cataclastic breccias and clay gouges characterized by strong pervasive bone-white bleaching, dark black structurally-controlled chlorite, and hematite alteration. The strong alteration and large faults in the basement of this drillhole suggest the ideal target starts approximately 10 – 15 m north of WMA062 and extends to the north where these two basement faults remain untested at the unconformity.
Drillholes WMA061 and WMA062 confirm the fault system along the conductive corridor in the Grid 5 area is present, large, and strongly altered southwest of the 42 Zone.
CanAlaska CEO, Cory Belyk, comments, “The Kingston Project has structural and geophysical targets that look like an Eagle Point or Arrow analogue in close association with a historical uranium-rich boulder train. The team is delighted this compilation work has outlined key target areas on this project associated with the large Collins Bay and Maguire faults, none of which have been drill tested in this area. In addition, the ongoing drilling program at West McArthur has successfully extended the “42 Zone” mineralization and drilling will continue on nearby priority targets along the 42 Zone controlling structure.”
Other News
CanAlaska’s joint venture partner, Denison Mines, continues drilling on our new Moon Lake South joint venture located near Denison’s Wheeler River Project.
About CanAlaska Uranium
CanAlaska Uranium Ltd. (TSXV: CVV) (OTCQB: CVVUF) (FSE: DH7N) holds interests in approximately 300,000 hectares (750,000 acres), in Canada’s Athabasca Basin region – the “Saudi Arabia of Uranium.” CanAlaska’s strategic holdings have attracted major international mining companies. CanAlaska is currently working with Cameco and Denison at two of the Company’s properties in the Eastern Athabasca Basin. CanAlaska is a project generator positioned for discovery success in the world’s richest uranium district. The Company also holds properties prospective for nickel, copper, gold and diamonds. For further information visit www.canalaska.com.
The qualified technical person for this news release is Nathan Bridge, MSc., P.Geo., CanAlaska’s Vice President, Exploration.
On behalf of the Board of Directors
“Peter Dasler”
Peter Dasler, M.Sc., P.Geo.
President
CanAlaska Uranium Ltd.
Contacts:
Cory Belyk, Executive VP and CEO
Tel: +1.604.688.3211 x 306
Email: cbelyk@canalaska.com
Peter Dasler, President
Tel: +1.604.688.3211 x 138
Email: info@canalaska.com
Neither TSX Venture Exchange nor its Regulation Services Provider (as that term is defined in the policies of the TSX Venture Exchange) accepts responsibility for the adequacy or accuracy of this release.
Forward-looking information
All statements included in this press release that address activities, events or developments that the Company expects, believes or anticipates will or may occur in the future are forward-looking statements. These forward-looking statements involve numerous assumptions made by the Company based on its experience, perception of historical trends, current conditions, expected future developments and other factors it believes are appropriate in the circumstances. In addition, these statements involve substantial known and unknown risks and uncertainties that contribute to the possibility that the predictions, forecasts, projections and other forward-looking statements will prove inaccurate, certain of which are beyond the Company’s control. Readers should not place undue reliance on forward-looking statements. Except as required by law, the Company does not intend to revise or update these forward-looking statements after the date hereof or revise them to reflect the occurrence of future unanticipated events.
Source:
CanAlaska Uranium Ltd.