
|
|
|
President and CEO Mary Berner delivers a new corporate presenation for Cumulus Media. Afterwards, she is joined by Noble Capital Markets Senior Research Analyst Michael Kupinski for a Q&A session. Research, News, and Advanced Market Data on CMLSView all C-Suite Interviews
About Cumulus Media CUMULUS MEDIA (NASDAQ: CMLS) is a leading media, advertising, and marketing services company delivering premium content to over a quarter billion people every month—wherever and whenever they want it. CUMULUS MEDIA engages listeners with high-quality local programming through 413 owned-and-operated radio stations across 86 markets; delivers nationally-syndicated sports, news, talk, and entertainment programming from iconic brands including the NFL, the NCAA, the Masters, CNN, the AP, the Academy of Country Music Awards, and many other world-class partners across nearly 7,300 affiliated stations through Westwood One, the largest audio network in America; and inspires listeners through the CUMULUS Podcast Network, its rapidly growing network of original podcasts that are smart, entertaining and thought-provoking. CUMULUS MEDIA provides advertisers with personal connections, local impact and national reach through broadcast and on-demand digital, mobile, social, and voice-activated platforms, as well as integrated digital marketing services, powerful influencers, full-service audio solutions, industry-leading research and insights, and live event experiences. CUMULUS MEDIA is the only audio media company to provide marketers with local and national advertising performance guarantees. For more information visit www.cumulusmedia.com. |
Category: Media and Marketing
C-Suite Interview with Engine Media (GAME) Executive Chairman Tom Rogers & CEO Lou Schwartz

|
|
|
Noble Capital Markets Senior Research Analyst Michael Kupinski sits down with Engine Media Executive Chairman Tom Rogers and CEO Lou Schwartz for this exclusive interview. Research, News, and Advanced Market Data on GAMEView all C-Suite Interviews
About Engine Media Holdings, Inc. Engine Media Holdings Inc. is traded publicly under the ticker symbol (NASDAQ: GAME) (TSX-V: GAME). The organization is focused on developing premium consumer experiences and unparalleled technology and content solutions for partners in the esports, news and gaming industry. The company’s subsidiaries include Stream Hatchet; the global leader in gaming video distribution analytics; Eden Games , a premium video game developer and publisher with numerous console and mobile gaming franchises; WinView Games, an industry innovator in audience second screen play-along gaming during live events; UMG, an end-to-end competitive esports platform enabling the professional and amateur esports community with tournaments, matches and award nominating content; and Frankly Media, a digital publishing platform empowering broadcasters to create, distribute and monetize content across all channels. Engine Media generates revenue through a combination of direct-to-consumer and subscription fees; streaming technology and data SaaS-based offerings; programmatic advertising and sponsorships. To date, the combined companies’ clients have included more than 1,200 television, print and radio brands, dozens of gaming and technology companies, and have connectivity into hundreds of millions of homes around the world through their content, distribution and technology services. |
Release – Gray Television Purchases Third Rail Studios
![]()
Gray Television Purchases Third Rail Studios
ATLANTA, Sept. 13, 2021 (GLOBE NEWSWIRE) — Gray Television, Inc. (“Gray”) (NYSE: GTN) announced today that it has purchased Third Rail Studios in Doraville, Georgia, from The Integral Group for $27.5 million.
Third Rail Studios, a movie and television production facility developed by The Integral Group in 2016, is located adjacent to, and now will be integrated into, Gray’s entertainment-centric studio and community development, called Assembly. Assembly is currently under construction at the former site of the General Motors Assembly Plant, which is conveniently located inside the I-285 perimeter. Integral purchased the property in 2014 and master developed the site before selling to Gray in March 2021.
Since it opened its doors in 2016, Third Rail Studios has attracted top-notch clients. Its high-quality stages, mill and support spaces, and production offices will serve as an anchor for the future multi-studio site. For the past few years, Netflix has produced a number of feature-length programs at Third Rail Studios, including the highly acclaimed Ozark series and other blockbuster productions and movies like Rampage, starring Dwayne “the Rock” Johnson; Mile 22, starring Mark Wahlberg; the Dolly Parton series; and the Ballad of Richard Jewell; among others. Recently, Apple leased a significant amount of space within Third Rail Studios to help fulfill its production needs.
“Third Rail Studios is a pioneer in bringing film and television production to the Atlanta community, and we are excited to join forces to create an entire studio city to serve Georgia’s booming media industry. We are thankful for all of the work already completed at Assembly and proud to usher in the next chapter for the historical site.” said Hilton H. Howell, Chairman of the Board & CEO of Gray Television.
Assembly is set to become an Atlanta landmark with easy access to I-285, I-85, two MARTA stations, and DeKalb-Peachtree Airport. Development plans for Assembly include studio space, mixed-use development, as well as entertainment areas that will be a go-to destination for the Atlanta community. The first phase is expected to be finished by fall 2022.
“Our commitment remains to drive regional economic development for decades to come. Today’s transaction ensures the continuation of the original vision,” said Egbert Perry, CEO of The Integral Group. “As we closeout our role at Third Rail Studios, we leave the future of the entire Assembly project, now augmented with Third Rail Studios, in the capable hands of Gray.”
Gray Television, which will soon become the second largest local broadcaster in the United States, purchased the 127 acre Assembly site in March 2021. The company is also a majority investor in Atlanta-based Swirl Films, which will occupy one of the stages on the property. Gray also owns video production companies Raycom Sports, Tupelo-Raycom, and RTM Studios, the producer of PowerNation programs and content, and launched Circle Network with Opry Entertainment in January 2020. Upon its anticipated acquisition of the television stations of Meredith Corporation, Gray will own television stations serving 113 markets that reach approximately 36 percent of US television households, the top-rated television station in 79 of those markets.
Gray Television Purchases Third Rail Studios
![]()
Gray Television Purchases Third Rail Studios
ATLANTA, Sept. 13, 2021 (GLOBE NEWSWIRE) — Gray Television, Inc. (“Gray”) (NYSE: GTN) announced today that it has purchased Third Rail Studios in Doraville, Georgia, from The Integral Group for $27.5 million.
Third Rail Studios, a movie and television production facility developed by The Integral Group in 2016, is located adjacent to, and now will be integrated into, Gray’s entertainment-centric studio and community development, called Assembly. Assembly is currently under construction at the former site of the General Motors Assembly Plant, which is conveniently located inside the I-285 perimeter. Integral purchased the property in 2014 and master developed the site before selling to Gray in March 2021.
Since it opened its doors in 2016, Third Rail Studios has attracted top-notch clients. Its high-quality stages, mill and support spaces, and production offices will serve as an anchor for the future multi-studio site. For the past few years, Netflix has produced a number of feature-length programs at Third Rail Studios, including the highly acclaimed Ozark series and other blockbuster productions and movies like Rampage, starring Dwayne “the Rock” Johnson; Mile 22, starring Mark Wahlberg; the Dolly Parton series; and the Ballad of Richard Jewell; among others. Recently, Apple leased a significant amount of space within Third Rail Studios to help fulfill its production needs.
“Third Rail Studios is a pioneer in bringing film and television production to the Atlanta community, and we are excited to join forces to create an entire studio city to serve Georgia’s booming media industry. We are thankful for all of the work already completed at Assembly and proud to usher in the next chapter for the historical site.” said Hilton H. Howell, Chairman of the Board & CEO of Gray Television.
Assembly is set to become an Atlanta landmark with easy access to I-285, I-85, two MARTA stations, and DeKalb-Peachtree Airport. Development plans for Assembly include studio space, mixed-use development, as well as entertainment areas that will be a go-to destination for the Atlanta community. The first phase is expected to be finished by fall 2022.
“Our commitment remains to drive regional economic development for decades to come. Today’s transaction ensures the continuation of the original vision,” said Egbert Perry, CEO of The Integral Group. “As we closeout our role at Third Rail Studios, we leave the future of the entire Assembly project, now augmented with Third Rail Studios, in the capable hands of Gray.”
Gray Television, which will soon become the second largest local broadcaster in the United States, purchased the 127 acre Assembly site in March 2021. The company is also a majority investor in Atlanta-based Swirl Films, which will occupy one of the stages on the property. Gray also owns video production companies Raycom Sports, Tupelo-Raycom, and RTM Studios, the producer of PowerNation programs and content, and launched Circle Network with Opry Entertainment in January 2020. Upon its anticipated acquisition of the television stations of Meredith Corporation, Gray will own television stations serving 113 markets that reach approximately 36 percent of US television households, the top-rated television station in 79 of those markets.
Advertising Results are Becoming a Guessing Game on Some Social Media


How Social Media Advertisers are Adjusting to Greater Privacy Provided by Cell Phones
Facebook and Google, the world’s most envied data harvesters, along with other tech companies, are beginning to feel the effects of the change in Apple’s iOS system. During the spring, Apple updated their iOS to not automatically share data in apps unless the user opted in. Four months have passed since the rollout and tech companies and their advertisers are beginning to understand the impact of the change.
A major challenge prompted by Apple’s privacy move is whether a specific purchase of a product can be tied to a customer seeing an ad on the media outlet. At issue is determining conversion rates. Advertisers have been using this data to determine the return on ad spending. The ratio of conversions per dollar spent has been basic to advertising on social media. In fact, it is one of the big reasons social media and other tech platforms have pulled some spending away from more traditional print and broadcast. Advertisers could more accurately follow the trail from spending on an ad to how many have seen the ad, then whether a purchase stems from interaction with the ad.
The new iPhones all come with the operating system. According to Flurry, an app analytics company, the opt-in rate allowing tracking is less than 25%. According to Counterpoint, Apple accounted for 14.3% of phone sales in 2021 through June.
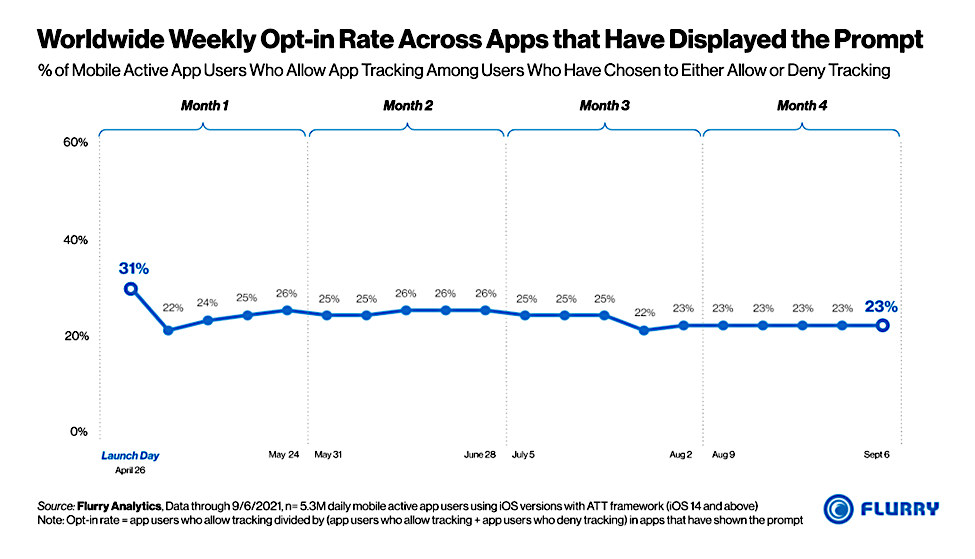
The challenge now for all ad platforms is that they are not as easily able to prove full benefit to advertisement purchasers. For the percentage of users that are continuing to opt-out of tracking, their information is unavailable or becomes a statistical “guess.” Put another way, they are virtually invisible to companies like Snapchat, TikTok, Pinterest, et al. In effect, it is no different from advertising dollars spent on print (magazines, newspapers, billboards, direct mail) and broadcast (television, radio).
As the biggest name in this type of advertising, Facebook/Instagram had an additional glitch with their count. It specifically caused a “Bug” that was recognized in August. Facebook said it was corrected last week. Part of the solution is to use statistical modeling to estimate activity. Facebook noted on their bug page:
| “With this update, statistical modeling will be used to estimate associated values of additional modeled conversions where events cannot be observed directly (for example, where conversion data may be partial or missing due to data transmission limitations). As a result, you may see an increase in reported conversion values and other associated metrics like [Return on Ad Spend.] This update should help our bidding system learn from more representative data, which should then lead to more efficient performance.” |
Estimates and statistical modeling by their very nature provide less information for advertisers to go on. This does not serve the digital media companies’ business well. In some cases, Facebook is working directly with brands to test programs that analyze pools of purchase data from a brand. The pools don’t provide data on individuals, it then reports average return on ad spend.
Take-Away
There is an information gap that is growing between advertisers on social media platforms including other big tech and how successful those ads are performing. Determining results is less apt to be a direct measurement and more a statistical model’s results. Individual data, in particular, is harder to come as data batching is used more.
Suggested Reading:
 Could $Hood Survive if PFOF Goes POOF?
|
 Your Data is Used to Generate Big Returns
|
 How Fast are People Cutting the Cord
|
 Digital Media and Entertainment Industry Outlook
|
Sources:
https://www.flurry.com/blog/ios-14-5-opt-in-rate-idfa-app-tracking-transparency-weekly/
https://www.youtube.com/watch?v=Ihw_Al4RNno
https://www.cnn.com/2021/04/26/tech/apple-tracking-transparency-feature/index.html
https://www.counterpointresearch.com/xiaomi-becomes-1-smartphone-brand-globally-first-time-ever/
Stay up to date. Follow us:

|
Salem Podcast Network Launches Daybreak Insider Daily Podcast

![]()
Salem Podcast Network Launches Daybreak Insider Daily Podcast
IRVING, Texas–(BUSINESS WIRE)– Salem Media Group, Inc. (NASDAQ: SALM) announced today that the Salem Podcast Network (“SPN”) will launch the Daybreak Insider Daily Podcast beginning on Tuesday, September 7th.
The daily podcast will be released each weekday morning by 6 am ET and will feature an overview of the biggest stories of the day. It will be hosted by Salem Radio News (“SRN”) anchor Rich Thomason from SRN’s Washington, D.C., bureau.
“It’s clear that podcast listeners are looking for informed reporting on what’s really happening in their world,” said Salem Senior Vice President of Spoken Word, Phil Boyce. “Within Salem, we have a wealth of resources, both for newsgathering and for analysis. With the Daybreak Insider Podcast, we’ll be pooling all of those resources into a single podcast to provide in-depth coverage from a conservative worldview. You’ll hear trusted voices from SRN News, Townhall.com, as well as the Salem Radio Network every day on this podcast, and it will all be pulled together by the experienced voice of Rich Thomason.”
The Daybreak Insider Podcast will be a companion product to the Daybreak Insider Newsletter, which is currently distributed each weekday morning to more than 100,000 subscribers.
Rich Thomason brings more than forty years of news experience to the Daybreak Insider Podcast, including more than two decades with SRN News as an anchor, correspondent, and news producer. Previously, he’s worked in Atlanta, Baltimore, and Washington, D.C., in the newsrooms of CNN and the Associated Press as a news writer, editor, reporter and anchor.
The Salem Podcast Network launched in January of 2021 with Charlie Kirk and Dinesh D’Souza. SPN has since added Todd Starnes, Trish Regan, and Jenna Ellis, in addition to the Salem Radio Network hosts who have daily podcasts on www.SalemPodcastNetwork.com. SPN was ranked the #13 podcast network in America in July by Triton Digital based on average weekly downloads. SPN averages more than 12 million downloads per month.
ABOUT SALEM MEDIA GROUP:
Salem Media Group is America’s leading multimedia company specializing in Christian and conservative content, with media properties comprising radio, digital media and book and newsletter publishing. Each day Salem serves a loyal and dedicated audience of listeners and readers numbering in the millions nationally. With its unique programming focus, Salem provides compelling content, fresh commentary and relevant information from some of the most respected figures across the Christian and conservative media landscape. Learn more about Salem Media Group, Inc. at www.salemmedia.com, Facebook and Twitter.
Evan D. Masyr
Executive Vice President and Chief Financial Officer
(805) 384-4512
evan@salemmedia.com
Source: Salem Media Group, Inc.
Released September 2, 2021
Entravision Communications (EVC) – Financial Flexibility With Recent Buyout


Thursday, September 02, 2021
Entravision Communications (EVC)
Financial Flexibility With Recent Buyout
Entravision Communications Corporation is a diversified Spanish-language media company utilizing a combination of television and radio operations to reach Hispanic consumers across the United States, as well as the border markets of Mexico. Entravision owns and/or operates 53 primary television stations and is the largest affiliate group of both the top-ranked Univision television network and Univision’s TeleFutura network, with television stations in 20 of the nation’s top 50 Hispanic markets. The Company also operates one of the nation’s largest groups of primarily Spanish-language radio stations, consisting of 48 owned and operated radio stations.
Michael Kupinski, Director of Research, Noble Capital Markets, Inc.
Refer to the full report for the price target, fundamental analysis, and rating.
Accelerates timetable to buy the rest of Cisneros. The Company acquired the remaining 49% interest in Cisneros Interactive that it did not already own, accelerating the timetable to buy the stake by 2 years. Notably, we estimate that the company paid $29 million for its original 51% ownership interest in Oct. 2020. The purchase solidifies the company as a leading digital media company, with over 70% of its consolidated revenue from its Digital Media businesses.
Attractive terms. Entravision will pay the remaining shareholders of Cisneros in 1/3rd increments in each of the next 3 years. The annual payout will be 6 times EBITDA of the prior year end period times 49% divided by 3, an attractive valuation given the strong growth profile of Cisneros. The sellers will receive incremental upside from acquisitions that Cisneros makes. The buyout takes the place …

This Company Sponsored Research is provided by Noble Capital Markets, Inc., a FINRA and S.E.C. registered broker-dealer (B/D).
*Analyst certification and important disclosures included in the full report. NOTE: investment decisions should not be based upon the content of this research summary. Proper due diligence is required before making any investment decision.
Release – Salem Podcast Network Launches Daybreak Insider Daily Podcast
![]()
Salem Podcast Network Launches Daybreak Insider Daily Podcast
IRVING, Texas–(BUSINESS WIRE)– Salem Media Group, Inc. (NASDAQ: SALM) announced today that the Salem Podcast Network (“SPN”) will launch the Daybreak Insider Daily Podcast beginning on Tuesday, September 7th.
The daily podcast will be released each weekday morning by 6 am ET and will feature an overview of the biggest stories of the day. It will be hosted by Salem Radio News (“SRN”) anchor Rich Thomason from SRN’s Washington, D.C., bureau.
“It’s clear that podcast listeners are looking for informed reporting on what’s really happening in their world,” said Salem Senior Vice President of Spoken Word, Phil Boyce. “Within Salem, we have a wealth of resources, both for newsgathering and for analysis. With the Daybreak Insider Podcast, we’ll be pooling all of those resources into a single podcast to provide in-depth coverage from a conservative worldview. You’ll hear trusted voices from SRN News, Townhall.com, as well as the Salem Radio Network every day on this podcast, and it will all be pulled together by the experienced voice of Rich Thomason.”
The Daybreak Insider Podcast will be a companion product to the Daybreak Insider Newsletter, which is currently distributed each weekday morning to more than 100,000 subscribers.
Rich Thomason brings more than forty years of news experience to the Daybreak Insider Podcast, including more than two decades with SRN News as an anchor, correspondent, and news producer. Previously, he’s worked in Atlanta, Baltimore, and Washington, D.C., in the newsrooms of CNN and the Associated Press as a news writer, editor, reporter and anchor.
The Salem Podcast Network launched in January of 2021 with Charlie Kirk and Dinesh D’Souza. SPN has since added Todd Starnes, Trish Regan, and Jenna Ellis, in addition to the Salem Radio Network hosts who have daily podcasts on www.SalemPodcastNetwork.com. SPN was ranked the #13 podcast network in America in July by Triton Digital based on average weekly downloads. SPN averages more than 12 million downloads per month.
ABOUT SALEM MEDIA GROUP:
Salem Media Group is America’s leading multimedia company specializing in Christian and conservative content, with media properties comprising radio, digital media and book and newsletter publishing. Each day Salem serves a loyal and dedicated audience of listeners and readers numbering in the millions nationally. With its unique programming focus, Salem provides compelling content, fresh commentary and relevant information from some of the most respected figures across the Christian and conservative media landscape. Learn more about Salem Media Group, Inc. at www.salemmedia.com, Facebook and Twitter.
Evan D. Masyr
Executive Vice President and Chief Financial Officer
(805) 384-4512
evan@salemmedia.com
Source: Salem Media Group, Inc.
Released September 2, 2021
Entravision Continues Digital and International Expansion with Full Acquisition of the Remaining Interest in Cisneros Interactive

![]()
Entravision Continues Digital and International Expansion with Full Acquisition of the Remaining Interest in Cisneros Interactive
Company Release – 8/31/2021 4:30 PM ET
- Entravision now owns 100% interest in Cisneros Interactive, a leader in the rapidly growing digital advertising sector in Latin America
- Cisneros Interactive will continue managing the operating business and client outreach, with Victor Kong as its CEO
- Entravision and Cisneros will maintain their strong partnership and will continue to collaborate on potential new digital initiatives worldwide
- Entravision’s digital platform continues to strengthen with global reach that spans over 30 countries across the U.S., Latin America, Europe and Asia
SANTA MONICA, Calif.–(BUSINESS WIRE)– Entravision Communications Corporation (NYSE: EVC) (“Entravision” or “the Company”), a leading global media and marketing technology company, today announced that the Company has acquired the remaining 49% interest in Cisneros Interactive. Entravision now owns 100% of Cisneros Interactive, having first acquired a majority stake in the company in October 2020. With this full acquisition, Entravision will further position the combined platforms and service portfolio to be one of the largest premier global digital advertising solutions companies.
Over the past decade, through both organic growth and acquisitions, Entravision’s digital marketing offerings have expanded significantly. Entravision’s Digital business now focuses on several key areas, including: Top Tier global audience and media representations; programmatic technology; digital audio solutions advertising and branding; and mobile performance solutions. Cisneros Interactive maintains unique sales partnerships in 17 Latin American countries, including partnerships with Facebook, Spotify and LinkedIn. The company also offers digital audio solutions and services through representation of a vast audience reached through 350 publishers.
“We are very pleased to continue to invest in the Cisneros Interactive – Entravision business to enhance our digital market leadership,” said Walter Ulloa, Chairman and Chief Executive Officer of Entravision. “This joint venture has been a great addition to Entravision, with impressively strong performance, leadership and culture. Digital revenues have surged over the past three quarters since our majority investment in Cisneros Interactive, and we plan to continue to invest in expanding our global footprint, management and digital service tools.”
With the full ownership of Cisneros Interactive, along with Entravision’s most recent acquisition of MediaDonuts, which added digital capabilities in 7 countries in Asia, digital now comprises 73% of consolidated revenue as of the most recently reported quarter ended June 30, 2021. Digital Segment revenue improved over 1,000% year-over-year to total $130.2 million for the second quarter 2021.
“We are excited about this transaction and our continued partnership with Entravision,” said Adriana Cisneros, CEO of Cisneros. “Working with Entravision over the past nine months has been an incredible opportunity to grow the Cisneros Interactive business with Entravision’s resources and broad network capabilities that have further enhanced the strong client and partnership relationships we have built with some of the world’s leading digital companies. Cisneros plans to maintain this active partnership with Entravision by having the Cisneros Interactive management team continue to manage the business and by exploring new digital ventures at a global scale.”
“Today’s announcement is a major milestone for the Cisneros Interactive and Entravision team, and I would like to thank them and our partners for making this accomplishment possible,” said Victor Kong, Chief Executive Officer of Cisneros Interactive. “With the support of Entravision, Cisneros Interactive’s business has reached new heights. Now, with Entravision acquiring full ownership of our company, we can take our leadership position even further with additional synergies and by further expanding our global reach.”
For more information on the transaction, please review the Company’s most recent filings with the Securities and Exchange Commission on Form 8-K.
About Entravision
Entravision is a diversified global media, marketing and technology company serving clients throughout the United States and in fast growing population centers in more than 30 countries across Latin America, Europe and Asia. Our dynamic portfolio of services includes digital, television and radio offerings. Digital, our largest revenue segment, is comprised of four core businesses: Entravision Digital, Smadex, Cisneros Interactive and MediaDonuts. Entravision Digital provides branding and performance digital solutions to clients and small- and mid-size businesses throughout the world, including the U.S., Latin America and Europe. Smadex provides cutting-edge mobile programmatic solutions and demand-side platforms which enable advertisers to effectively execute performance campaigns using machine-learned bidding algorithms. Cisneros Interactive provides unique digital marketing solutions representing major global publishers and ad-tech platforms in Latin America, while also managing the leading digital audio network and solutions player Audio.Ad. MediaDonuts provides digital marketing performance and branding services in the Southeast Asia region and maintains unique commercial partnerships with some of the world’s leading digital publishers and social media platforms. Beyond the digital space, Entravision has 54 television stations and is the largest affiliate group of the Univision and UniMás television networks. Entravision also manages 47 primarily Spanish-language radio stations that feature nationally recognized, Emmy award-winning talent. Shares of Entravision Class A Common Stock trade on the NYSE under ticker: EVC. Learn more about all of our innovative media, marketing and technology offerings at entravision.com or connect with us on social on LinkedIn and Facebook.
About Cisneros Interactive
Cisneros Interactive is the leading digital advertising company serving the Latin America region. The company has an active presence in 17 countries, leveraging unique commercial partnerships with Facebook, Spotify, LinkedIn and other leading media and technology platforms. In addition, the company has the leading digital audio ad network with more than 350 publishers through a full solution technology stack tech offering under the Audio.Ad brand. Cisneros Interactive is a business unit of Entravision Communications Corporation (NYSE: EVC).
Forward Looking Statements
This press release contains certain forward-looking statements, including without limitation the Company’s current expectations and intentions with respect to the filing of its Form 10-K. These forward-looking statements, which are included in accordance with the safe harbor provisions of the Private Securities Litigation Reform Act of 1995, may involve known and unknown risks, uncertainties and other factors that may cause the Company’s actual results and performance in future periods to be materially different from any future results or performance suggested by the forward-looking statements in this press release. Although the Company believes the expectations reflected in such forward-looking statements are based upon reasonable assumptions, it can give no assurance that actual results will not differ materially from these expectations, and the Company disclaims any duty to update any forward-looking statements made by the Company. From time to time, these risks, uncertainties and other factors are discussed in the Company’s filings with the Securities and Exchange Commission.
Entravision:
Christopher T. Young
Chief Financial Officer
310-447-3870
Kimberly Esterkin
ADDO Investor Relations
310-829-5400
evc@addo.com
Source: Entravision Communications Corporation
Entravision Communications Corporation (EVC) – Not Expected To Be A Swan Song
Wednesday, September 01, 2021
Entravision Communications Corporation (EVC)
Not Expected To Be A Swan Song
Entravision Communications Corporation is a diversified Spanish-language media company utilizing a combination of television and radio operations to reach Hispanic consumers across the United States, as well as the border markets of Mexico. Entravision owns and/or operates 53 primary television stations and is the largest affiliate group of both the top-ranked Univision television network and Univision’s TeleFutura network, with television stations in 20 of the nation’s top 50 Hispanic markets. The Company also operates one of the nation’s largest groups of primarily Spanish-language radio stations, consisting of 48 owned and operated radio stations.
Michael Kupinski, Director of Research, Noble Capital Markets, Inc.
Refer to the full report for the price target, fundamental analysis, and rating.
Accelerates timetable to buy the rest of Cisneros. The Company acquired the remaining 49% interest in Cisneros Interactive that it did not already own, accelerating the timetable to buy the stake by 2 years. Notably, we estimate that the company paid $29 million for its original 51% ownership interest in Oct. 2020. The purchase solidifies the company as a leading digital media company, with over 70% of its consolidated revenue from its Digital Media businesses.
Attractive terms. Entravision will pay the remaining shareholders of Cisneros in 1/3rd increments in each of the next 3 years. The annual payout will be 6 times EBITDA of the prior year end period times 49% divided by 3, an attractive valuation given the strong growth profile of Cisneros. The sellers will receive incremental upside from acquisitions that Cisneros makes …
This Company Sponsored Research is provided by Noble Capital Markets, Inc., a FINRA and S.E.C. registered broker-dealer (B/D).
*Analyst certification and important disclosures included in the full report. NOTE: investment decisions should not be based upon the content of this research summary. Proper due diligence is required before making any investment decision.
Release – Entravision Continues Digital and International Expansion with Full Acquisition of the Remaining Interest in Cisneros Interactive
![]()
Entravision Continues Digital and International Expansion with Full Acquisition of the Remaining Interest in Cisneros Interactive
Company Release – 8/31/2021 4:30 PM ET
- Entravision now owns 100% interest in Cisneros Interactive, a leader in the rapidly growing digital advertising sector in Latin America
- Cisneros Interactive will continue managing the operating business and client outreach, with Victor Kong as its CEO
- Entravision and Cisneros will maintain their strong partnership and will continue to collaborate on potential new digital initiatives worldwide
- Entravision’s digital platform continues to strengthen with global reach that spans over 30 countries across the U.S., Latin America, Europe and Asia
SANTA MONICA, Calif.–(BUSINESS WIRE)– Entravision Communications Corporation (NYSE: EVC) (“Entravision” or “the Company”), a leading global media and marketing technology company, today announced that the Company has acquired the remaining 49% interest in Cisneros Interactive. Entravision now owns 100% of Cisneros Interactive, having first acquired a majority stake in the company in October 2020. With this full acquisition, Entravision will further position the combined platforms and service portfolio to be one of the largest premier global digital advertising solutions companies.
Over the past decade, through both organic growth and acquisitions, Entravision’s digital marketing offerings have expanded significantly. Entravision’s Digital business now focuses on several key areas, including: Top Tier global audience and media representations; programmatic technology; digital audio solutions advertising and branding; and mobile performance solutions. Cisneros Interactive maintains unique sales partnerships in 17 Latin American countries, including partnerships with Facebook, Spotify and LinkedIn. The company also offers digital audio solutions and services through representation of a vast audience reached through 350 publishers.
“We are very pleased to continue to invest in the Cisneros Interactive – Entravision business to enhance our digital market leadership,” said Walter Ulloa, Chairman and Chief Executive Officer of Entravision. “This joint venture has been a great addition to Entravision, with impressively strong performance, leadership and culture. Digital revenues have surged over the past three quarters since our majority investment in Cisneros Interactive, and we plan to continue to invest in expanding our global footprint, management and digital service tools.”
With the full ownership of Cisneros Interactive, along with Entravision’s most recent acquisition of MediaDonuts, which added digital capabilities in 7 countries in Asia, digital now comprises 73% of consolidated revenue as of the most recently reported quarter ended June 30, 2021. Digital Segment revenue improved over 1,000% year-over-year to total $130.2 million for the second quarter 2021.
“We are excited about this transaction and our continued partnership with Entravision,” said Adriana Cisneros, CEO of Cisneros. “Working with Entravision over the past nine months has been an incredible opportunity to grow the Cisneros Interactive business with Entravision’s resources and broad network capabilities that have further enhanced the strong client and partnership relationships we have built with some of the world’s leading digital companies. Cisneros plans to maintain this active partnership with Entravision by having the Cisneros Interactive management team continue to manage the business and by exploring new digital ventures at a global scale.”
“Today’s announcement is a major milestone for the Cisneros Interactive and Entravision team, and I would like to thank them and our partners for making this accomplishment possible,” said Victor Kong, Chief Executive Officer of Cisneros Interactive. “With the support of Entravision, Cisneros Interactive’s business has reached new heights. Now, with Entravision acquiring full ownership of our company, we can take our leadership position even further with additional synergies and by further expanding our global reach.”
For more information on the transaction, please review the Company’s most recent filings with the Securities and Exchange Commission on Form 8-K.
About Entravision
Entravision is a diversified global media, marketing and technology company serving clients throughout the United States and in fast growing population centers in more than 30 countries across Latin America, Europe and Asia. Our dynamic portfolio of services includes digital, television and radio offerings. Digital, our largest revenue segment, is comprised of four core businesses: Entravision Digital, Smadex, Cisneros Interactive and MediaDonuts. Entravision Digital provides branding and performance digital solutions to clients and small- and mid-size businesses throughout the world, including the U.S., Latin America and Europe. Smadex provides cutting-edge mobile programmatic solutions and demand-side platforms which enable advertisers to effectively execute performance campaigns using machine-learned bidding algorithms. Cisneros Interactive provides unique digital marketing solutions representing major global publishers and ad-tech platforms in Latin America, while also managing the leading digital audio network and solutions player Audio.Ad. MediaDonuts provides digital marketing performance and branding services in the Southeast Asia region and maintains unique commercial partnerships with some of the world’s leading digital publishers and social media platforms. Beyond the digital space, Entravision has 54 television stations and is the largest affiliate group of the Univision and UniMás television networks. Entravision also manages 47 primarily Spanish-language radio stations that feature nationally recognized, Emmy award-winning talent. Shares of Entravision Class A Common Stock trade on the NYSE under ticker: EVC. Learn more about all of our innovative media, marketing and technology offerings at entravision.com or connect with us on social on LinkedIn and Facebook.
About Cisneros Interactive
Cisneros Interactive is the leading digital advertising company serving the Latin America region. The company has an active presence in 17 countries, leveraging unique commercial partnerships with Facebook, Spotify, LinkedIn and other leading media and technology platforms. In addition, the company has the leading digital audio ad network with more than 350 publishers through a full solution technology stack tech offering under the Audio.Ad brand. Cisneros Interactive is a business unit of Entravision Communications Corporation (NYSE: EVC).
Forward Looking Statements
This press release contains certain forward-looking statements, including without limitation the Company’s current expectations and intentions with respect to the filing of its Form 10-K. These forward-looking statements, which are included in accordance with the safe harbor provisions of the Private Securities Litigation Reform Act of 1995, may involve known and unknown risks, uncertainties and other factors that may cause the Company’s actual results and performance in future periods to be materially different from any future results or performance suggested by the forward-looking statements in this press release. Although the Company believes the expectations reflected in such forward-looking statements are based upon reasonable assumptions, it can give no assurance that actual results will not differ materially from these expectations, and the Company disclaims any duty to update any forward-looking statements made by the Company. From time to time, these risks, uncertainties and other factors are discussed in the Company’s filings with the Securities and Exchange Commission.
Entravision:
Christopher T. Young
Chief Financial Officer
310-447-3870
Kimberly Esterkin
ADDO Investor Relations
310-829-5400
evc@addo.com
Source: Entravision Communications Corporation
Engine Media Holdings, Inc. (GAME)(GAME:CA) – Revving Up Growth
Monday, August 30, 2021
Engine Media Holdings, Inc. (GAME)(GAME:CA)
Revving Up Growth
Engine Media Holdings Inc. is traded publicly under the ticker symbol (NASDAQ: GAME) (TSX-V: GAME). The organization is focused on developing premium consumer experiences and unparalleled technology and content solutions for partners in the esports, news and gaming industry. The company’s subsidiaries include Stream Hatchet; the global leader in gaming video distribution analytics; Eden Games , a premium video game developer and publisher with numerous console and mobile gaming franchises; WinView Games, an industry innovator in audience second screen play-along gaming during live events; UMG, an end-to-end competitive esports platform enabling the professional and amateur esport community with tournaments, matches and award nominating content; and Frankly Media, a digital publishing platform empowering broadcasters to create, distribute and monetize content across all channels. Engine Media generates revenue through a combination of direct-to-consumer and subscription fees; streaming technology and data SaaS-based offerings; programmatic advertising and sponsorships. To date, the combined companies’ clients have included more than 1,200 television, print and radio brands, dozens of gaming and technology companies, and have connectivity into hundreds of millions of homes around the world through their content, distribution and technology services.
Michael Kupinski, Director of Research, Noble Capital Markets, Inc.
Refer to the full report for the price target, fundamental analysis, and rating.
Initiate coverage. We view Engine Media as among our favorite plays in the fast growing esports and iGaming industries. The esports audience is growing rapidly with 2.8 billion gamers and 50 million e-sport viewers according to NewZoo. We believe that the company’s sports betting business, Winview, has an unique in-play betting platform that should show rapid revenue growth.
Diversified revenue streams. The company has multiple business lines with various revenue streams from advertising, sponsorships, and subscriptions. In fact, a large 28% of its revenues are derived from a SaaS model. Notably, each of these business lines offer attractive growth opportunities …
This Company Sponsored Research is provided by Noble Capital Markets, Inc., a FINRA and S.E.C. registered broker-dealer (B/D).
*Analyst certification and important disclosures included in the full report. NOTE: investment decisions should not be based upon the content of this research summary. Proper due diligence is required before making any investment decision.
Engine Media Holdings Inc. (GAME)(GAME:CA) – Revving Up Growth
Monday, August 30, 2021
Engine Media Holdings, Inc. (GAME)(GAME:CA)
Revving Up Growth
Engine Media Holdings Inc. is traded publicly under the ticker symbol (NASDAQ: GAME) (TSX-V: GAME). The organization is focused on developing premium consumer experiences and unparalleled technology and content solutions for partners in the esports, news and gaming industry. The company’s subsidiaries include Stream Hatchet; the global leader in gaming video distribution analytics; Eden Games , a premium video game developer and publisher with numerous console and mobile gaming franchises; WinView Games, an industry innovator in audience second screen play-along gaming during live events; UMG, an end-to-end competitive esports platform enabling the professional and amateur esport community with tournaments, matches and award nominating content; and Frankly Media, a digital publishing platform empowering broadcasters to create, distribute and monetize content across all channels. Engine Media generates revenue through a combination of direct-to-consumer and subscription fees; streaming technology and data SaaS-based offerings; programmatic advertising and sponsorships. To date, the combined companies’ clients have included more than 1,200 television, print and radio brands, dozens of gaming and technology companies, and have connectivity into hundreds of millions of homes around the world through their content, distribution and technology services.
Michael Kupinski, Director of Research, Noble Capital Markets, Inc.
Refer to the full report for the price target, fundamental analysis, and rating.
Initiate coverage. We view Engine Media as among our favorite plays in the fast growing esports and iGaming industries. The esports audience is growing rapidly with 2.8 billion gamers and 50 million e-sport viewers according to NewZoo. We believe that the company’s sports betting business, Winview, has an unique in-play betting platform that should show rapid revenue growth.
Diversified revenue streams. The company has multiple business lines with various revenue streams from advertising, sponsorships, and subscriptions. In fact, a large 28% of its revenues are derived from a SaaS model. Notably, each of these business lines offer attractive growth opportunities …
This Company Sponsored Research is provided by Noble Capital Markets, Inc., a FINRA and S.E.C. registered broker-dealer (B/D).
*Analyst certification and important disclosures included in the full report. NOTE: investment decisions should not be based upon the content of this research summary. Proper due diligence is required before making any investment decision.