Release – Direct Digital Holdings to Report First Quarter 2022 Financial Results


Direct Digital Holdings to Report First Quarter 2022 Financial Results

Research, News, and Market Data on Direct Digital Holdings

HOUSTON, May 11, 2022 /PRNewswire/ — Direct Digital Holdings (Nasdaq: DRCT) (“Direct Digital”), a leading advertising and marketing technology holding group, will report financial results for the first quarter ended March 31, 2022, on Thursday, May 12, 2022 after the U.S. stock market closes. Management will host a conference call and webcast on the same day at 5:00 p.m. ET to discuss the results.

The live webcast and replay can be accessed at https://ir.directdigitalholdings.com/

About Direct Digital
Holdings
Direct Digital Holdings (Nasdaq: DRCT) brings state-of-the-art supply- and demand-side advertising platforms together under one umbrella company. The holding group’s supply-side platform Colossus SSP offers advertisers of all sizes extensive reach within general market and multicultural media properties. Its operating companies Huddled Masses and Orange142 deliver significant ROI for middle market advertisers by providing data-optimized programmatic solutions at scale for businesses in sectors that range from energy to healthcare and travel to financial services. Direct Digital Holdings’ sell- and buy-side solutions manage 17,500 clients daily, generating over 30 billion impressions per month across display, CTV, in-app, and other media channels.

Cision View original content to download multimedia:https://www.prnewswire.com/news-releases/reminder-direct-digital-holdings-to-report-first-quarter-2022-financial-results-301545448.html

SOURCE Direct Digital Holdings

Released May 11, 2022

Release – Salem Media Group, Inc. Announces First Quarter 2022 Total Revenue of $62.6 Million


Salem Media Group, Inc. Announces First Quarter 2022 Total Revenue of $62.6 Million

Research, News, and Market Data on Salem Media

IRVING, Texas–(BUSINESS WIRE)– Salem Media Group, Inc. (NASDAQ: SALM) released its results for the three months ended March 31, 2022.

First Quarter 2022 Results

For the quarter ended March 31, 2022 compared to the quarter ended March 31, 2021:

Consolidated

  • Total revenue increased 5.5% to $62.6 million from $59.4 million;
  • Total operating expenses increased 4.8% to $57.6 million from $55.0 million;
  • Operating expenses, excluding gains or losses on the disposition of assets, stock-based compensation expense, changes in the estimated fair value of contingent earn-out consideration, impairments, depreciation expense and amortization expense (1) increased 8.4% to $55.8 million from $51.4 million;
  • Operating income increased 14.2% to $5.0 million from $4.4 million;
  • Net income increased 438.4% to $1.7 million, or $0.06 net income per diluted share from $0.3 million, or $0.01 net income diluted per share;
  • EBITDA (1) increased 8.6% to $8.2 million from $7.5 million;
  • Adjusted EBITDA (1) decreased 13.6% to $6.8 million from $7.9 million; and
  • Net cash used by operating activities decreased 53.1% to $4.3 million from $9.2 million.

Broadcast

  • Net broadcast revenue increased 10.0% to $48.4 million from $44.0 million;
  • Station Operating Income (“SOI”) (1) decreased 3.7% to $10.3 million from $10.7 million;
  • Same Station (1) net broadcast revenue increased 9.4% to $48.1 million from $44.0 million; and
  • Same Station SOI (1) decreased 5.0% to $10.3 million from $10.9 million.

Digital Media

  • Digital media revenue increased 7.1% to $10.3 million from $9.6 million; and
  • Digital Media Operating Income (1) increased 93.1% to $1.8 million from $0.9 million.

Publishing

  • Publishing revenue decreased 31.8% to $3.9 million from $5.7 million; and
  • Publishing Operating Loss (1) was $0.6 million compared to Publishing Operating Income (1) of $0.5 million.

Included in the results for the quarter ended March 31, 2022 are:

  • A $1.7 million ($1.3 million, net of tax, or $0.05 per diluted share) net gain on the disposition of assets relates primarily to the gain on sale of land in Phoenix, Arizona offset by various fixed asset disposals; and
  • A $0.2 million ($0.2 million, net of tax, or $0.01 per share) charge for debt modification costs; and
  • A $0.1 million non-cash compensation charge ($0.1 million, net of tax) related to the expensing of stock options.

Included in the results for the quarter ended March 31, 2021 are:

  • A $0.3 million ($0.2 million, net of tax, or $0.01 per share) net loss on the disposition of assets recorded upon the closing of the sale of radio station WKAT-AM and an FM translator in Miami, Florida; and
  • A $0.1 million non-cash compensation charge ($0.1 million, net of tax) related to the expensing of stock options.

Per share numbers are calculated based on 27,610,407 diluted weighted average shares for the quarter ended March 31, 2022, and 27,138,773 diluted weighted average shares for the quarter ended March 31, 2021.

Balance Sheet

As of March 31, 2022, the company had $114.7 million outstanding on the 7.125% senior secured notes due 2028 (“2028 Notes”), $57.7 million outstanding on 6.75% senior secured notes due 2024 (“2024 Notes”), and no outstanding balance on the ABL Facility.

Acquisitions and Divestitures

The following transactions were completed since January 1, 2022:

  • On May 2, 2022, the company acquired websites and related assets of Retirement Media for $0.2 million in cash.
  • The company invested $3.5 million, for a total investment to date of $4.5 million, in a Limited Liability Company “LLC” that will own, distribute, and market a motion picture.
  • On February 15, 2022, the company closed on the acquisition of radio station WLCC-AM and an FM translator in the Tampa, Florida market for $0.6 million of cash.
  • On January 10, 2022, the company closed on the sale of 4.5 acres of land in Phoenix, Arizona for $2.0 million in cash.

Pending transactions:

  • On August 31, 2021, the company entered into an agreement to sell 9.3 acres of land in the Denver area for $8.2 million. The company expects to close this sale in the second quarter of 2022 and plans to continue broadcasting both KRKS-AM and KBJD-AM from this site.
  • On June 2, 2021, the company entered into an agreement to acquire radio station KKOL-AM in Seattle, Washington for $0.5 million. The company paid $0.1 million in cash into an escrow account and began operating the station under a Local Marketing Agreement on June 7, 2021. The company expects the transaction to close in the latter half of 2022.
  • On February 5, 2020, the company entered into an Asset Purchase Agreement with Word Broadcasting to sell radio stations WFIA-AM, WFIA-FM and WGTK-AM in Louisville, Kentucky for $4.0 million with credits applied from amounts previously paid, including a portion of the monthly fees paid under a Time Brokerage Agreement (“TBA”). Due to changes in debt markets, the transaction was not funded, and it is uncertain when, or if, the transaction will close. Word Broadcasting continues to program the stations under a TBA that began in January 2017.

Conference Call Information

Salem will host a teleconference to discuss its results on May 10, 2022 at 3:00 p.m. Central Time. To access the teleconference, please dial (877) 524-8416, and then ask to be joined into the Salem Media Group First Quarter 2022 call or listen via the investor relations portion of the company’s website, located at investor.salemmedia.com. A replay of the teleconference will be available through May 24, 2022 and can be heard by dialing (877) 660-6853, passcode 13727921 or on the investor relations portion of the company’s website, located at investor.salemmedia.com.

Follow us on Twitter @SalemMediaGrp.

Second Quarter 2022 Outlook

For the second quarter of 2022, the company is projecting total revenue to increase between 6% and 8% from second quarter 2021 total revenue of $63.8 million. The company is also projecting operating expenses before gains or losses on the sale or disposal of assets, stock-based compensation expense, changes in the estimated fair value of contingent earn-out consideration, impairments, depreciation expense and amortization expense to increase between 7% and 10% compared to the second quarter of 2021 non-GAAP operating expenses of $55.0 million.

A reconciliation of non-GAAP operating expenses, excluding gains
or losses on the disposition of assets, stock-based compensation expense,
changes in the estimated fair value of contingent earn-out consideration,
impairments, depreciation expense and amortization expense to the most directly
comparable GAAP measure is not available without unreasonable efforts on a
forward-looking basis due to the potential high variability, complexity and low
visibility with respect to the charges excluded from this non-GAAP financial
measure, in particular, the change in the estimated fair value of earn-out
consideration, impairments and gains or losses from the disposition of fixed
assets. The company expects the variability of the above charges may have a
significant, and potentially unpredictable, impact on its future GAAP financial
results.

About Salem Media Group, Inc.

Salem Media Group is America’s leading multimedia company specializing in Christian and conservative content, with media properties comprising radio, digital media and book and newsletter publishing. Each day Salem serves a loyal and dedicated audience of listeners and readers numbering in the millions nationally. With its unique programming focus, Salem provides compelling content, fresh commentary and relevant information from some of the most respected figures across the Christian and conservative media landscape. Learn more about Salem Media Group, Inc. at www.salemmedia.comFacebook and Twitter.

Forward-Looking Statements

Statements used in this press release that relate to future plans, events, financial results, prospects or performance are forward-looking statements as defined under the Private Securities Litigation Reform Act of 1995. Actual results may differ materially from those anticipated as a result of certain risks and uncertainties, including but not limited to the ability of Salem to close and integrate announced transactions, market acceptance of Salem’s radio station formats, competition from new technologies, adverse economic conditions, and other risks and uncertainties detailed from time to time in Salem’s reports on Forms 10-K, 10-Q, 8-K and other filings filed with or furnished to the Securities and Exchange Commission. Readers are cautioned not to place undue reliance on these forward-looking statements, which speak only as of the date hereof. Salem undertakes no obligation to update or revise any forward-looking statements to reflect new information, changed circumstances or unanticipated events.

(1) Regulation G

Management uses certain non-GAAP financial measures defined
below in communications with investors, analysts, rating agencies, banks and
others to assist such parties in understanding the impact of various items on
its financial statements. The company uses these non-GAAP financial measures to
evaluate financial results, develop budgets, manage expenditures and as a
measure of performance under compensation programs.

The company’s presentation of these non-GAAP financial measures
should not be considered as a substitute for or superior to the most directly
comparable financial measures as reported in accordance with GAAP.

Regulation G defines and prescribes the conditions under which
certain non-GAAP financial information may be presented in this earnings
release. The company closely monitors EBITDA, Adjusted EBITDA, Station
Operating Income (“SOI”), Same Station net broadcast revenue, Same Station
broadcast operating expenses, Same Station Operating Income, Digital Media
Operating Income, Publishing Operating Income (Loss), and operating expenses
excluding gains or losses on the disposition of assets, stock-based
compensation, changes in the estimated fair value of contingent earn-out
consideration, impairments, depreciation and amortization, all of which are
non-GAAP financial measures. The company believes that these non-GAAP financial
measures provide useful information about its core operating results, and thus,
are appropriate to enhance the overall understanding of its financial performance.
These non-GAAP financial measures are intended to provide management and
investors a more complete understanding of its underlying operational results,
trends and performance.

The company defines Station Operating Income (“SOI”) as net
broadcast revenue minus broadcast operating expenses. The company defines
Digital Media Operating Income as net Digital Media Revenue minus Digital Media
Operating Expenses. The company defines Publishing Operating Income (Loss) as
net Publishing Revenue minus Publishing Operating Expenses. The company defines
EBITDA as net income before interest, taxes, depreciation, and amortization.
The company defines Adjusted EBITDA as EBITDA before gains or losses on the
disposition of assets, before changes in the estimated fair value of contingent
earn-out consideration, before impairments, before net miscellaneous income and
expenses, before gain on bargain purchase, before (gain) loss on early
retirement of long-term debt and before non-cash compensation expense. SOI,
Digital Media Operating Income, Publishing Operating Income (Loss), EBITDA and
Adjusted EBITDA are commonly used by the broadcast and media industry as
important measures of performance and are used by investors and analysts who
report on the industry to provide meaningful comparisons between broadcasters.
SOI, Digital Media Operating Income, Publishing Operating Income (Loss), EBITDA
and Adjusted EBITDA are not measures of liquidity or of performance in
accordance with GAAP and should be viewed as a supplement to and not a
substitute for or superior to its results of operations and financial condition
presented in accordance with GAAP. The company’s definitions of SOI, Digital
Media Operating Income, Publishing Operating Income (Loss), EBITDA and Adjusted
EBITDA are not necessarily comparable to similarly titled measures reported by
other companies.

The company defines Adjusted Free Cash Flow as Adjusted EBITDA
less cash paid for capital expenditures, less cash paid for income taxes, and
less cash paid for interest. The company considers Adjusted Free Cash Flow to
be a liquidity measure that provides useful information to management and
investors about the amount of cash generated by its operations after cash paid
for capital expenditures, cash paid for income taxes and cash paid for
interest. A limitation of Adjusted Free Cash Flow as a measure of liquidity is
that it does not represent the total increase or decrease in its cash balance
for the period. The company uses Adjusted Free Cash Flow, a non-GAAP liquidity
measure, both in presenting its results to stockholders and the investment
community, and in its internal evaluation and management of the business. The
company’s presentation of Adjusted Free Cash Flow is not intended to be
considered in isolation or as a substitute for the financial information
prepared and presented in accordance with GAAP. The company’s definition of
Adjusted Free Cash Flow is not necessarily comparable to similarly titled
measures reported by other companies.

The company defines Same Station net broadcast revenue as
broadcast revenue from its radio stations and networks that the company owns or
operates in the same format on the first and last day of each quarter, as well
as the corresponding quarter of the prior year. The company defines Same
Station broadcast operating expenses as broadcast operating expenses from its
radio stations and networks that the company owns or operates in the same
format on the first and last day of each quarter, as well as the corresponding
quarter of the prior year. The company defines Same Station SOI as Same Station
net broadcast revenue less Same Station broadcast operating expenses. Same
Station operating results include those stations that the company owns or
operates in the same format on the first and last day of each quarter, as well
as the corresponding quarter of the prior year. Same Station operating results
for a full calendar year are calculated as the sum of the Same Station-results
for each of the four quarters of that year. The company uses Same Station
operating results, a non-GAAP financial measure, both in presenting its results
to stockholders and the investment community, and in its internal evaluations
and management of the business. The company believes that Same Station
operating results provide a meaningful comparison of period over period
performance of its core broadcast operations as this measure excludes the
impact of new stations, the impact of stations the company no longer owns or
operates, and the impact of stations operating under a new programming format.
The company’s presentation of Same Station operating results are not intended
to be considered in isolation or as a substitute for the financial information
prepared and presented in accordance with GAAP. The company’s definition of
Same Station operating results is not necessarily comparable to similarly
titled measures reported by other companies.

For all non-GAAP financial measures, investors should consider
the limitations associated with these metrics, including the potential lack of
comparability of these measures from one company to another.

The Supplemental Information tables that follow the condensed
consolidated financial statements provide reconciliations of the non-GAAP
financial measures that the company uses in this earnings release to the most
directly comparable measures calculated in accordance with GAAP. The company
uses non-GAAP financial measures to evaluate financial performance, develop
budgets, manage expenditures, and determine employee compensation. The company’s
presentation of this additional information is not to be considered as a
substitute for or superior to the directly comparable measures as reported in
accordance with GAAP.

Salem Media Group, Inc.

Condensed Consolidated Statements of
Operations

(in thousands, except share and per share
data)


Three Months Ended


March 31,


2021


2022


(Unaudited)

Net broadcast revenue


$

44,048


$

48,432


Net digital media revenue


9,619


10,300


Net publishing revenue


5,686


3,877


Total revenue


59,353


62,609


Operating expenses:


Broadcast operating expenses


33,343


38,121


Digital media operating expenses


8,673


8,473


Publishing operating expenses


5,205


4,467


Unallocated corporate expenses


4,288


4,810


Change in the estimated fair value of contingent earn-out consideration


(5

)

Debt modification costs


228


Depreciation and amortization


3,170


3,276


Net (gain) loss on the disposition of assets


318


(1,735

)

Total operating expenses


54,997


57,635


Operating income


4,356


4,974


Other income (expense):


Interest income


1


Interest expense


(3,926

)


(3,394

)

Loss on early retirement of long-term debt


(53

)

Net miscellaneous income and (expenses)


22


1


Net income before income taxes


453


1,528


Provision for (benefit from) income taxes


130


(211

)

Net income


$

323


$

1,739


Basic earnings per share Class A and Class B common stock


$

0.01


$

0.06


Diluted earnings per share Class A and Class B common stock


$

0.01


$

0.06


Basic weighted average Class A and Class B common stock shares outstanding


26,736,639


27,177,375


Diluted weighted average Class A and Class B common stock shares outstanding


27,138,773


27,610,407


Salem Media Group, Inc.

Condensed Consolidated Balance Sheets

(in thousands)


December 31, 2021


March 31, 2022


(Unaudited)

Assets


Cash


$

1,785


$

Accounts receivable, net


25,663


28,000

Other current assets


14,066


15,330

Property and equipment, net


79,339


80,262

Operating and financing lease right-of-use assets


43,665


45,985

Intangible assets, net


346,438


346,294

Deferred financing costs


843


793

Other assets


4,313


6,994

Total assets


$

516,112


$

523,658


Liabilities and
Stockholders’ Equity


Current liabilities


$

51,455


$

57,031

Long-term debt


170,581


168,300

Operating and financing lease liabilities, less current portion


42,273


44,777

Deferred income taxes


67,012


67,007

Other liabilities


6,580


6,393

Stockholders’ Equity


178,211


180,150

Total liabilities
and stockholders’ equity


$

516,112


$

523,658


SALEM MEDIA GROUP, INC.

CONDENSED CONSOLIDATED STATEMENTS OF
STOCKHOLDERS’ EQUITY

(Dollars in thousands, except share and per
share data
)


Class A


Class B


Common Stock


Common Stock


Additional


Paid-In


Accumulated


Treasury


Shares


Amount


Shares


Amount


Capital


Deficit


Stock


Total

Stockholders’
equity, December 31, 2020

23,447,317


$

227


5,553,696


$

56


$

247,025


$

(78,023

)


$

(34,006

)


$

135,279

Stock-based compensation


78


78

Options exercised

185,782


2


390


392

Net income


323


323

Stockholders’
equity,

March 31, 2021

23,633,099


$

229


5,553,696


$

56


$

247,493


$

(77,700

)


$

(34,006

)


$

136,072


Class A


Class B


Common Stock


Common Stock


Additional


Paid-In


Accumulated


Treasury


Shares


Amount


Shares


Amount


Capital


Deficit


Stock


Total

Stockholders’
equity, December 31, 2021

23,922,974


$

232


5,553,696


$

56


$

248,438


$

(36,509

)


$

(34,006

)


$

178,211

Stock-based compensation


106


106

Options exercised

40,913


94


94

Lapse in restricted shares

14,854


Net income


1,739


1,739

Stockholders’
equity, March 31, 2022

23,978,741


$

232


5,553,696


$

56


$

248,638


$

(34,770

)


$

(34,006

)


$

180,150


SALEM MEDIA GROUP, INC.

CONDENSED CONSOLIDATED STATEMENTS OF CASH
FLOWS

(Dollars in thousands)

(Unaudited)


Three Months Ended

March 31,


2021


2022

OPERATING ACTIVITIES


Net income

$

323


$

1,739


Adjustments to reconcile net income to net cash provided by operating activities:


Non-cash stock-based compensation


78


106


Depreciation and amortization


3,170


3,276


Amortization of deferred financing costs


213


247


Non-cash lease expense


2,161


2,202


Provision for bad debts


(295

)


(209

)

Deferred income taxes


188


(5

)

Change in the estimated fair value of contingent earn-out consideration


(5

)

Loss on early retirement of long-term debt


53


Net (gain) loss on the disposition of assets


318


(1,735

)

Changes in operating assets and liabilities:


Accounts receivable and unbilled revenue


2,549


(2,229

)

Inventories


(93

)


(411

)

Prepaid expenses and other current assets


(750

)


(748

)

Accounts payable and accrued expenses


2,490


4,024


Operating lease liabilities


(2,497

)


(1,852

)

Contract liabilities


1,122


136


Deferred rent income


170


(58

)

Other liabilities


29


Income taxes payable


21


(218

)

Net cash provided by operating activities


9,197


4,313


INVESTING ACTIVITIES


Cash paid for capital expenditures net of tenant improvement allowances


(1,859

)


(3,439

)

Capital expenditures reimbursable under tenant improvement allowances and trade agreements


(40

)

Deposit on broadcast assets and radio station acquisitions


(100

)


Purchases of broadcast assets and radio stations


(540

)

Investment in LLC


(2,000

)

Proceeds from sale of long-lived assets


3,501


2,001


Other


(238

)


(858

)

Net cash provided by (used in) investing activities


1,304


(4,876

)

FINANCING ACTIVITIES


Payments to repurchase 2024 Notes


(2,531

)

Proceeds from borrowings under ABL Facility


16


6,257


Payments on ABL Facility


(5,016

)


(6,257

)

Proceeds from borrowings under PPP Loans


11,195


Payments of debt issuance costs


(3

)


Proceeds from the exercise of stock options


392


94


Payments on financing lease liabilities


(16

)


(16

)

Book overdraft


1,231


Net cash provided by (used in) financing activities


6,568


(1,222

)

Net increase (decrease) in cash and cash equivalents


17,069


(1,785

)

Cash and cash equivalents at beginning of year


6,325


1,785


Cash and cash equivalents at end of period

$

23,394


$


The company defines EBITDA (1) as net income before interest, taxes, depreciation, and amortization. The table below presents a reconciliation of EBITDA (1) to Net Income (Loss), the most directly comparable GAAP measure. EBITDA (1) is a non-GAAP financial performance measure that is not to be considered a substitute for or superior to the directly comparable measures reported in accordance with GAAP. The company defines Adjusted EBITDA (1) as EBITDA (1) before gains or losses on the disposition of assets, before changes in the estimated fair value of contingent earn-out consideration, before impairments, before net miscellaneous income and expenses, before (gain) loss on early retirement of long-term debt and before non-cash compensation expense. The table below presents a reconciliation of Adjusted EBITDA (1) to Net Income, the most directly comparable GAAP measure. Adjusted EBITDA (1) is a non-GAAP financial performance measure that is not to be considered a substitute for or superior to the directly comparable measures reported in accordance with GAAP.

Salem Media Group, Inc.

Supplemental Information

(in thousands)

Three Months Ended

March 31,

2021


2022

(Unaudited)

Net income

$

323

$

1,739

Plus interest expense, net of capitalized interest

3,926

3,394

Plus provision for (benefit from) income taxes

130

(211)

Plus depreciation and amortization

3,170

3,276

Less interest income


(1)


EBITDA

$

7,548

$

8,198

Less net (gain) loss on the disposition of assets

318

(1,735)

Less change in the estimated fair value of contingent

earn-out consideration


(5)

Plus debt modification costs


228

Plus loss on early retirement of long-term debt

53

Plus net miscellaneous income and expenses


(22)


(1)

Plus non-cash stock-based compensation


78


106

Adjusted EBITDA

$

7,922

$

6,844

The company defines Adjusted Free Cash Flow (1) as Adjusted EBITDA (1) less cash paid for capital expenditures, less cash paid for income taxes, and less cash paid for interest. The company considers Adjusted Free Cash Flow to be a liquidity measure that provides useful information to management and investors about the amount of cash generated by its operations after cash paid for capital expenditures, cash paid for income taxes and cash paid for interest. A limitation of Adjusted Free Cash Flow as a measure of liquidity is that it does not represent the total increase or decrease in its cash balance for the period. The company uses Adjusted Free Cash Flow, a non-GAAP liquidity measure, both in presenting its results to stockholders and the investment community, and in its internal evaluation and management of the business. The company’s presentation of Adjusted Free Cash Flow is not intended to be considered in isolation or as a substitute for the financial information prepared and presented in accordance with GAAP. The company’s definition of Adjusted Free Cash Flow is not necessarily comparable to similarly titled measures reported by other companies.

The table below presents a reconciliation of Adjusted Free Cash Flow to net cash provided by operating activities, the most directly comparable GAAP measure. Adjusted Free Cash Flow is a non-GAAP liquidity measure that is not to be considered a substitute for or superior to the directly comparable measures reported in accordance with GAAP.

Salem Media Group, Inc.

Supplemental Information

(in thousands)


Three Months Ended

March 31,

2021

2022

(Unaudited)

Net cash provided by operating activities

$

9,197


$

4,313


Non-cash stock-based compensation

(78

)

(106

)

Depreciation and amortization

(3,170

)

(3,276

)

Amortization of deferred financing costs

(213

)

(247

)

Non-cash lease expense


(2,161

)


(2,202

)

Provision for bad debts

295


209


Deferred income taxes

(188

)

5


Change in the estimated fair value of contingent earn- out consideration


5


Net (gain) loss on the disposition of assets

(318

)

1,735


Loss on early retirement of long-term debt


(53

)

Changes in operating assets and liabilities:


Accounts receivable and unbilled revenue

(2,549

)

2,229


Inventories

93


411


Prepaid expenses and other current assets

750


748


Accounts payable and accrued expenses

(2,490

)

(4,024

)

Contract liabilities

(1,122

)

(136

)

Operating lease liabilities (deferred rent)

2,497


1,852


Deferred rent income


(170

)


58


Other liabilities


(29

)


Income taxes payable


(21

)


218


Net income

$

323


$

1,739


Plus interest expense, net of capitalized interest

3,926


3,394


Plus provision for (benefit from) income taxes

130


(211

)

Plus depreciation and amortization

3,170


3,276


Less interest income


(1

)


EBITDA

$

7,548


$

8,198


Plus net (gain) loss on the disposition of assets

318


(1,735

)

Plus change in the estimated fair value of contingent earn-out consideration


(5

)

Plus debt modification costs


228


Plus loss on early retirement of long-term debt


53


Plus net miscellaneous income and expenses


(22

)


(1

)

Plus non-cash stock-based compensation


78


106


Adjusted EBITDA

$

7,922


$

6,844


Less net cash paid for capital expenditures (1)

(1,859

)

(3,439

)

Plus cash received (paid for) taxes

79


(12

)

Less cash paid for interest, net of capitalized interest


(53

)


(65

)

Adjusted Free Cash Flow

$

6,089


$

3,328

(1) Net cash paid for capital expenditures reflects actual cash payments net of cash reimbursements under tenant improvement allowances and net of property and equipment acquired in trade transactions.


Selected Debt Data

Outstanding at

Applicable Interest Rate

March 31, 2022

Senior Secured Notes due 2028 (1)

$

114,731,000

7.125%

Senior Secured Notes due 2024 (2)

$

57,674,000

6.750%

(1) $114.7 million notes with semi-annual interest payments at an annual rate of 7.125%.

(2) $57.7 million notes with semi-annual interest payments at an annual rate of 6.750%.


View source version on businesswire.com: https://www.businesswire.com/news/home/20220506005535/en/

Evan D. Masyr
Executive Vice President and Chief
Financial Officer
(805) 384-4512
evan@salemmedia.com

Source: Salem Media Group, Inc.


E.W. Scripps (SSP) – Why We Are Raising Full Year 2022 Estimates

Monday, May 09, 2022

E.W. Scripps (SSP)
Why We Are Raising Full Year 2022 Estimates

The E.W. Scripps Company (NASDAQ: SSP) is a diversified media company focused on creating a better-informed world. As one of the nation’s largest local TV broadcasters, Scripps serves communities with quality, objective local journalism and operates a portfolio of 61 stations in 41 markets. The Scripps Networks reach nearly every American through the national news outlets Court TV and Newsy and popular entertainment brands ION, Bounce, Defy TV, Grit, ION Mystery, Laff and TrueReal. Scripps is the nation’s largest holder of broadcast spectrum. Scripps runs an award-winning investigative reporting newsroom in Washington, D.C., and is the longtime steward of the Scripps National Spelling Bee. Founded in 1878, Scripps has held for decades to the motto, “Give light and the people will find their own way.”

Michael Kupinski, Director of Research, Noble Capital Markets, Inc.

Refer to the full report for the price target, fundamental analysis, and rating.

Q1 exceeds expectations. First quarter results were better than expected on both the top line and cash flow. Total company revenues increased 4.6% to $565.7 million, 1.3% better than our $558.5 million estimate. Adj. EBITDA was $124.5 million, 16% better than our $107.5 million estimate. The variance on the revenue was due to stronger than expected core advertising, beating our estimate by 1.5% and better revenues in its Networks business, beating our estimate by 1.9%. 

Q2 guidance lower than expected. We are raising our total company revenue estimate from $596.0 million to $603.0 million. Due to the higher than expected costs in its Network segment, we are lowering our adj. EBITDA estimate from $167.4 million to $139.3 million. The Q2 adjustment took away the Q1 upside variance in Adj. EBITDA. …

This Research is provided by Noble Capital Markets, Inc., a FINRA and S.E.C. registered broker-dealer (B/D).

*Analyst certification and important disclosures included in the full report. NOTE: investment decisions should not be based upon the content of this research summary. Proper due diligence is required before making any investment decision. 

Gray Television (GTN) – Plowing Through The Noise

Monday, May 09, 2022

Gray Television (GTN)
Plowing Through The Noise

Gray Television is a multimedia company headquartered in Atlanta, Georgia. We are the nation’s largest owner of top-rated local television stations and digital assets in the United States. Our television stations serve 113 television markets that collectively reach approximately 36 percent of US television households. This portfolio includes 80 markets with the top-rated television station and 100 markets with the first and/or second highest rated television station. We also own video program companies Raycom Sports, Tupelo Honey, PowerNation Studios and Third Rail Studios.

Michael Kupinski, Director of Research, Noble Capital Markets, Inc.

Refer to the full report for the price target, fundamental analysis, and rating.

Exceeds expectations. The company blew through our revenue and adj. EBITDA estimates in its first quarter. Revenues increased a strong 9.8% to $827.0 million, nicely above our $793.0 million estimate, and above its previous guidance. Adj. EBITDA was a solid $251.0 million, up 8.2%, and above our $212.0 million estimate. 

Core and Retransmission revenue trends favorable. The Q1 upside revenue variance was driven by better than expected Core advertising (up 4% versus guidance of 3% to 5%) and better Retransmission revenue, in part related to a true-up. The company expects solid Retrans revenue of $385 million to $390 million in Q2, better than our original estimate. Management indicated that subscriber counts appear stable. …

This Research is provided by Noble Capital Markets, Inc., a FINRA and S.E.C. registered broker-dealer (B/D).

*Analyst certification and important disclosures included in the full report. NOTE: investment decisions should not be based upon the content of this research summary. Proper due diligence is required before making any investment decision. 

Cumulus Media (CMLS) – A Timely, Smart Move To Buyback Stock

Friday, May 06, 2022

Cumulus Media (CMLS)
A Timely, Smart Move To Buyback Stock

Cumulus Media (NASDAQ: CMLS) is an audio-first media company delivering premium content to over a quarter billion people every month — wherever and whenever they want it. Cumulus Media engages listeners with high-quality local programming through 406 owned-and-operated radio stations across 86 markets; delivers nationally-syndicated sports, news, talk, and entertainment programming from iconic brands including the NFL, the NCAA, the Masters, CNN, the AP, the Academy of Country Music Awards, and many other world-class partners across more than 9,500 affiliated stations through Westwood One, the largest audio network in America; and inspires listeners through the Cumulus Podcast Network, its rapidly growing network of original podcasts that are smart, entertaining and thought-provoking. Cumulus Media provides advertisers with personal connections, local impact and national reach through broadcast and on-demand digital, mobile, social, and voice-activated platforms, as well as integrated digital marketing services, powerful influencers, full-service audio solutions, industry-leading research and insights, and live event experiences. Cumulus Media is the only audio media company to provide marketers with local and national advertising performance guarantees. For more information visit www.cumulusmedia.com.

Michael Kupinski, Director of Research, Noble Capital Markets, Inc.

Patrick McCann, Research Associate, Noble Capital Markets, Inc.

Refer to the full report for the price target, fundamental analysis, and rating.

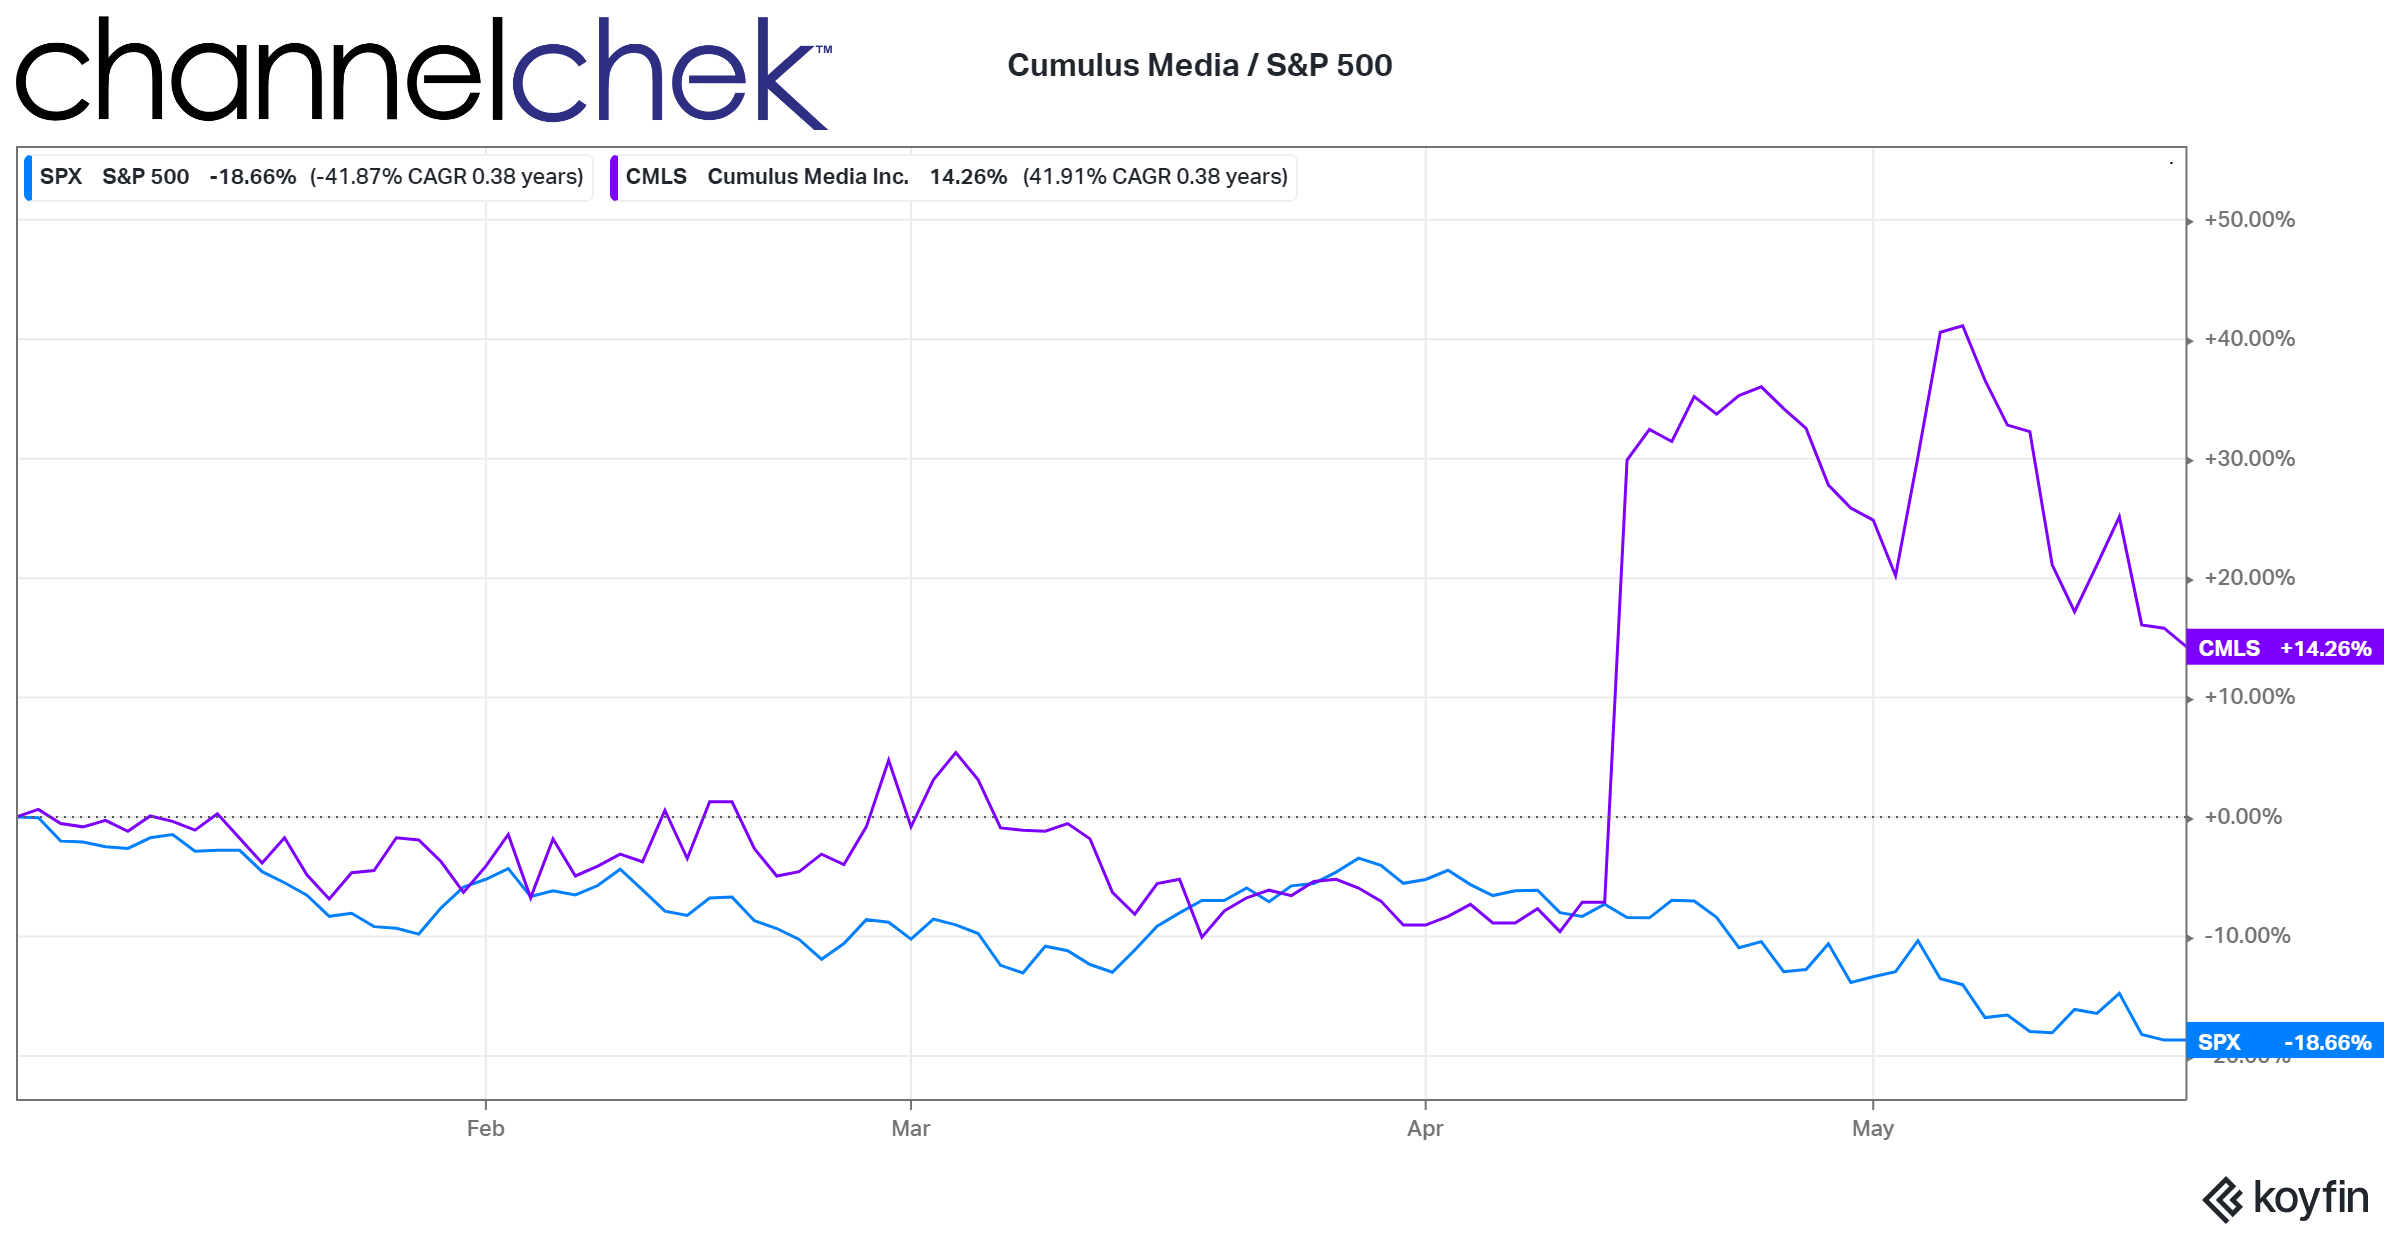
Launches Dutch Auction. The company announced that it will be commencing a Dutch Auction tender offer for up to $25 million of class A common stock, at a share price of no greater than $16.50 and no less than $14.50. The offer is set to run from May 6th to June 3rd of 2022, unless extended or terminated earlier by the company. 

Attractive valuation. We view the move favorably given the compelling valuation of the CMLS shares. Moreover, the announcement signals that management is taking an aggressive approach to return capital to shareholders.    …

This Research is provided by Noble Capital Markets, Inc., a FINRA and S.E.C. registered broker-dealer (B/D).

*Analyst certification and important disclosures included in the full report. NOTE: investment decisions should not be based upon the content of this research summary. Proper due diligence is required before making any investment decision. 

Entravision Communications (EVC) – In A Strong Growth Mode

Friday, May 06, 2022

Entravision Communications (EVC)
In A Strong Growth Mode

Entravision Communications Corporation is a diversified Spanish-language media company utilizing a combination of television and radio operations to reach Hispanic consumers across the United States, as well as the border markets of Mexico. Entravision owns and/or operates 53 primary television stations and is the largest affiliate group of both the top-ranked Univision television network and Univision’s TeleFutura network, with television stations in 20 of the nation’s top 50 Hispanic markets. The Company also operates one of the nation’s largest groups of primarily Spanish-language radio stations, consisting of 48 owned and operated radio stations.

Michael Kupinski, Director of Research, Noble Capital Markets, Inc.

Patrick McCann, Research Associate, Noble Capital Markets, Inc.

Refer to the full report for the price target, fundamental analysis, and rating.

Exceeds expectations. While revenues were largely in line with expectations, the company overachieved our adj. EBITDA estimate. Total company revenues increased a very strong 32% to $197.2 million (vs our $198.3 million estimate) and adj. EBITDA increased an impressive 28% to $18.1 million (vs our $16.1 million estimate). 

Digital on fire. The company’s digital businesses, which contributed 78% of total company revenue, increased a strong 51%. The company is executing on an attractive Digital growth strategy of expanding reach into new countries and territories and expanding commercial partnerships. In addition, the company is expanding its programmatic ad tech platform into new territories as well.  …

This Company Sponsored Research is provided by Noble Capital Markets, Inc., a FINRA and S.E.C. registered broker-dealer (B/D).

*Analyst certification and important disclosures included in the full report. NOTE: investment decisions should not be based upon the content of this research summary. Proper due diligence is required before making any investment decision. 

Lee Enterprises (LEE) – Results Validate Its Digital Growth Strategy

Friday, May 06, 2022

Lee Enterprises (LEE)
Results Validate Its Digital Growth Strategy

Lee Enterprises, Incorporated provides local news, information, and advertising primarily in midsize markets in the United States. It publishes 49 daily newspapers, as well as offers 300 weekly newspapers and specialty publications in 23 states. The company also provides online advertising and services; and online infrastructure and online publishing services for approximately 1,500 daily and weekly newspapers and shoppers. In addition, it offers commercial printing services. The company has a strategic alliance with Yahoo!, Inc. to provide its classified employment advertising customer base the opportunity to post job listings and other employment products on Yahoo!s HotJobs national platform. Lee Enterprises, Incorporated was founded in 1890 and is based in Davenport, Iowa.

Michael Kupinski, Director of Research, Noble Capital Markets, Inc.

Patrick McCann, Research Associate, Noble Capital Markets, Inc.

Refer to the full report for the price target, fundamental analysis, and rating.

A little light, but not worrisome. Fiscal Q2 revenues of $190.0 million was slightly less than our $191.2 million estimate. The results reflected better-than-expected growth in its Digital businesses and weaker results in its print advertising business. Adj. EBITDA was $16.9 million versus our $17.8 million estimate. 

Digital excels. Total Digital revenues were $58.1 million, 7% better than our expectation, and represented 31% of total company revenues, up from 27% in fiscal Q1. The strong results were driven by Digital Only Subscription revenue, up 44.7% to $32.9 million, an impressive 26% above expectations. Amplified, its digital agency business, increased revenues 108%. We believe that the strong Digital growth validates the company’s Digital investments and its growth strategy. …

This Company Sponsored Research is provided by Noble Capital Markets, Inc., a FINRA and S.E.C. registered broker-dealer (B/D).

*Analyst certification and important disclosures included in the full report. NOTE: investment decisions should not be based upon the content of this research summary. Proper due diligence is required before making any investment decision. 

Cumulus Media (CMLS) – A Sanguine Outlook

Thursday, May 05, 2022

Cumulus Media (CMLS)
A Sanguine Outlook

Cumulus Media (NASDAQ: CMLS) is an audio-first media company delivering premium content to over a quarter billion people every month — wherever and whenever they want it. Cumulus Media engages listeners with high-quality local programming through 406 owned-and-operated radio stations across 86 markets; delivers nationally-syndicated sports, news, talk, and entertainment programming from iconic brands including the NFL, the NCAA, the Masters, CNN, the AP, the Academy of Country Music Awards, and many other world-class partners across more than 9,500 affiliated stations through Westwood One, the largest audio network in America; and inspires listeners through the Cumulus Podcast Network, its rapidly growing network of original podcasts that are smart, entertaining and thought-provoking. Cumulus Media provides advertisers with personal connections, local impact and national reach through broadcast and on-demand digital, mobile, social, and voice-activated platforms, as well as integrated digital marketing services, powerful influencers, full-service audio solutions, industry-leading research and insights, and live event experiences. Cumulus Media is the only audio media company to provide marketers with local and national advertising performance guarantees. For more information visit www.cumulusmedia.com.

Michael Kupinski, Director of Research, Noble Capital Markets, Inc.

Patrick McCann, Research Associate, Noble Capital Markets, Inc.

Refer to the full report for the price target, fundamental analysis, and rating.

A solid quarter. Q1 revenues increased a strong 15% to $232.0 million, above our $227.2 million estimate. Adj. EBITDA was $31.2 million, above our $22.2 million estimate.  The Revenues and Adj. EBITDA results benefited from a $5 million in pull forward revenues and adj. EBITDA as a results of the cancelled Wynbet contract. Notably, the company would have beat our Adj. EBITDA estimate, without the adjustment.

Tweaking 2022 estimates upward. We are flowing through a portion of the Q1 upside to our full year 2022 estimates. We are raising our full year 2022 adj. EBIDA estimate from $173.7 million to $175.1 million. At this time, we are maintaining our full year 2023 estimates. …

This Research is provided by Noble Capital Markets, Inc., a FINRA and S.E.C. registered broker-dealer (B/D).

*Analyst certification and important disclosures included in the full report. NOTE: investment decisions should not be based upon the content of this research summary. Proper due diligence is required before making any investment decision. 

Release – Motorsport Games to Report First Quarter 2022 Financial Results


Motorsport Games to Report First Quarter 2022 Financial Results

Research, News, and Market Data on Motorsport Games

MIAMI, May 05, 2022 (GLOBE NEWSWIRE) — Motorsport Games, Inc. (NASDAQ: MSGM) (“Motorsport Games”), a leading racing game developer, publisher and esports ecosystem provider of official motorsport racing series throughout the world, will report financial results for the first quarter ended March 31, 2022 on Monday, May 16, 2022 after market close. Management will host a conference call and webcast on the same day at 5:00 p.m. ET to discuss the results.

Participants may access the live webcast on the Company’s investor relations website at https://ir.motorsportgames.com under “Events.” The call may also be accessed by dialing 1 (800) 786-6104 from the U.S., or by dialing 1 (416) 981-9029 internationally.

About Motorsport
Games:

Motorsport Games, a Motorsport Network company, combines innovative and engaging video games with exciting esports competitions and content for racing fans and gamers around the globe. The Company is the officially licensed video game developer and publisher for iconic motorsport racing series across PC, PlayStation, Xbox, Nintendo Switch and mobile, including NASCAR, INDYCAR, 24 Hours of Le Mans and the British Touring Car Championship (“BTCC”). Motorsport Games is an award-winning esports partner of choice for 24 Hours of Le Mans, Formula E, BTCC, the FIA World Rallycross Championship and the eNASCAR Heat Pro League, among others.

For more information about Motorsport Games visit: www.motorsportgames.com.

Contacts:
Investors:

Ashley DeSimone
Ashley.DeSimone@icrinc.com

Release – Entravision Communications Corporation Reports First Quarter 2022 Results


Entravision Communications Corporation Reports First Quarter 2022 Results

Research, News, and Market Data on Entravision

SANTA MONICA, Calif.–(BUSINESS WIRE)– Entravision Communications Corporation (NYSE: EVC), a leading global advertising solutions, media and technology company, today announced financial results for the three-month period ended March 31, 2022.

First Quarter 2022 Highlights

  • All-time first quarter record revenue, EBITDA and free cash flow
  • Net revenue up 32% over the prior-year quarter
  • Net income attributable to common stockholders down 65% over the prior-year quarter
  • Consolidated adjusted EBITDA up 28% over the prior-year quarter
  • Operating cash flow up 127% over the prior-year quarter
  • Free cash flow up 10% over the prior-year quarter
  • Quarterly cash dividend of $0.025 per share
  • Repurchased $7.1 million in shares under the Company’s $20 million share repurchase program
  • Post quarter entered into a definitive agreement to make an investment in Jack of Digital

“Entravision begins 2022 on very solid footing, with net revenue for the first quarter totaling $197.2 million, up 32% year-over year. Adjusted EBITDA also improved to total $18.1 million, an increase of 28% over the prior-year period,” said Walter Ulloa, Chairman and Chief Executive Officer. “Importantly, even as our top line continues to grow, we have maintained a lean, efficient cost structure, helping to drive our cash flow as well as our ability to provide consistent returns to our shareholders.”

Mr. Ulloa continued, “Our strength during the first quarter was largely driven by revenue growth of 51% in our digital segment, which comprised 78% of consolidated revenue. Our broadcast businesses, and, in particular, audio, helped drive our strong margins and cash flow. Simultaneously, our strategic expansion of our commercial partnerships with some of the world’s leading technology platforms has positioned us at the forefront of digital innovation across emerging economies, including Latin America, Southeast Asia, Africa, and Pakistan when we complete our investment in Jack of Digital. We are excited about the enormous opportunities that lie in front of us and look forward to sharing our progress throughout the year.”

Quarterly Cash Dividend

The Company announced today that its Board of Directors approved a quarterly cash dividend to shareholders of $0.025 per share on the Company’s Class A, Class B and Class U common stock, in an aggregate amount of approximately $2.1 million. The quarterly dividend will be payable on June 30, 2022 to shareholders of record as of the close of business on June 16, 2022, and the common stock will trade ex-dividend on June 15, 2022. The Company currently anticipates that future cash dividends will be paid on a quarterly basis; however, any decision to pay future cash dividends will be subject to approval by the Board.

Share Repurchase Program

On March 1, 2022, the Board of Directors approved the repurchase of up to $20 million of the Company’s common stock. Under this share repurchase program, the Company is authorized to purchase shares from time to time through open market purchases or negotiated purchases, subject to market conditions and other factors. On the same date, the Board terminated the Company’s previous share repurchase program of the Company’s common stock. During the first quarter the Company repurchased $7.1 million of its Class A common stock.

Investment in Jack of Digital

As previously announced, the Company has entered into a definitive agreement to acquire a strategic stake in Jack of Digital, a digital marketing services company that serves as the exclusive advertising sales partner of TikTok in Pakistan. Subject to regulatory approvals and other pre-closing conditions, the Company anticipates that the investment will be completed during the second quarter of 2022. With this investment, the Company enhances its presence in South Asia.

Non-GAAP Financial Measures

This press release contains certain non-GAAP financial measures as defined by SEC Regulation G. The GAAP financial measure most directly comparable to each of these non-GAAP financial measures, and a table reconciling each of these non-GAAP financial measures to its most directly comparable GAAP financial measure is included beginning on page 9.

Unaudited Financial Highlights (In thousands, except share and per
share data)


Three-Month Period


Ended March 31,


2022


2021


% Change


Net revenue

$

197,172


$

148,880


32

%

Cost of revenue – digital (1)


129,891


84,756


53

%

Operating expenses (2)


43,862


40,414


9

%

Corporate expenses (3)


8,724


7,158


22

%

Foreign currency (gain) loss


(847

)


586


*


Consolidated adjusted EBITDA (4)


18,113


14,195


28

%


Free cash flow (5)

$

14,327


$

13,029


10

%


Net income (loss)

$

1,887


$

7,002


(73

)%

Net (income) loss attributable to redeemable noncontrolling interest

$


$

(1,573

)


*


Net income (loss) attributable to common stockholders

$

1,887


$

5,429


(65

)%


Net income (loss) per share attributable to common stockholders, basic and diluted

$

0.02


$

0.06


(67

)%

Weighted average common shares outstanding, basic


86,522,378


85,041,628


Weighted average common shares outstanding, diluted


88,630,216


86,986,581


(1)

Consists primarily of the costs of online media acquired from third-party publishers. Media cost is classified as cost of revenue in the period in which the corresponding revenue is recognized.

(2)

Operating expenses include direct operating and selling, general and administrative expenses. Included in operating expenses are $1.0 million and $0.3 million of non-cash stock-based compensation for the three-month periods ended March 31, 2022 and 2021, respectively.

(3)

Corporate expenses include $1.6 million and $0.8 million of non-cash stock-based compensation for the three-month periods ended March 31, 2022 and 2021, respectively.

(4)

Consolidated adjusted EBITDA means net income (loss) plus gain (loss) on sale of assets, depreciation and amortization, non-cash impairment charge, non-cash stock-based compensation included in operating and corporate expenses, net interest expense, other operating gain (loss), gain (loss) on debt extinguishment, income tax (expense) benefit, equity in net income (loss) of nonconsolidated affiliate, non-cash losses, syndication programming amortization less syndication programming payments, revenue from the Federal Communications Commission, or FCC, spectrum incentive auction less related expenses, expenses associated with investments, EBITDA attributable to redeemable noncontrolling interest, acquisitions and dispositions and certain pro-forma cost savings. We use the term consolidated adjusted EBITDA because that measure is defined in the agreement governing our current credit facility (“the 2017 Credit Facility”) and does not include gain (loss) on sale of assets, depreciation and amortization, non-cash impairment charge, non-cash stock-based compensation, net interest expense, other income (loss), gain (loss) on debt extinguishment, income tax (expense) benefit, equity in net income (loss) of nonconsolidated affiliate, non-cash losses, syndication programming amortization less syndication programming payments, revenue from FCC spectrum incentive auction less related expenses, expenses associated with investments, EBITDA attributable to redeemable noncontrolling interest, acquisitions and dispositions and certain pro-forma cost savings.

(5)

Free cash flow is defined as consolidated adjusted EBITDA less cash paid for income taxes, net interest expense, capital expenditures and non-recurring cash expenses plus dividend income, and other operating gain (loss). Net interest expense is defined as interest expense, less non-cash interest expense relating to amortization of debt finance costs, and less interest income.

Unaudited Financial Results (In thousands)


Three-Month Period


Ended March 31,


2022


2021


% Change


Net revenue

$

197,172


$

148,880


32

%

Cost of revenue – digital (1)


129,891


84,756


53

%

Operating expenses (1)


43,862


40,414


9

%

Corporate expenses (1)


8,724


7,158


22

%

Depreciation and amortization


6,395


5,184


23

%

Change in fair value of contingent consideration


5,100


*


Impairment charge


1,326


(100

)%

Foreign currency (gain) loss


(847

)


586


*


Other operating (gain) loss


(119

)


(1,913

)


(94

)%


Operating income (loss)


4,166


11,369


(63

)%

Interest expense, net


(1,430

)


(1,577

)


(9

)%

Dividend income


3


2


50

%


Income (loss) before income taxes


2,739


9,794


(72

)%

Income tax benefit (expense)


(852

)


(2,792

)


(69

)%


Net income (loss)


1,887


7,002


(73

)%

Net (income) loss attributable to redeemable noncontrolling interest


(1,573

)


*


Net income (loss) attributable to common stockholders

$

1,887


$

5,429


(65

)%

(1)

Cost of revenue, operating expenses and corporate expenses are defined on page 2.

Net revenue in the first quarter of 2022 totaled $197.2 million, up 32% from $148.9 million in the prior-year period. Of the overall increase, approximately $52.2 million was attributable to our digital segment and was primarily due to advertising revenue growth from our digital commercial partnerships business and our acquisitions of MediaDonuts and 365 Digital during the third and fourth quarters of 2021, respectively, both of which did not contribute to net revenue in the comparable period ended March 31, 2021. In addition, of the overall increase, approximately $1.3 million was attributable to our audio segment primarily due to increases in local advertising revenue and political advertising revenue. The overall increase was partially offset by a decrease of approximately $5.2 million attributable to our television segment, primarily due to decreases in local and national advertising revenue, which was mainly attributed to the expiration of our Univision and UniMás network affiliation agreements in Orlando, Tampa and Washington, D.C. on December 31, 2021. Additionally, the decrease in our television segment was attributed to a decrease in revenue from spectrum usage rights, and a decrease in retransmission consent revenue, partially offset by an increase in political advertising revenue.

Cost of revenue in the first quarter of 2022 totaled $129.9 million, up 53% from $84.8 million in the prior-year period. The increase was primarily due to increased costs of revenue related to advertising revenue growth from our digital commercial partnerships business, and our acquisitions of MediaDonuts and 365 Digital during the third and fourth quarters of 2021, respectively, both of which did not incur cost of revenue for us in the comparable period ended March 31, 2021.

Operating expenses in the first quarter of 2022 totaled $43.9 million, up 9% from $40.4 million in the prior-year period. Of the overall increase, approximately $4.4 million was attributable to our digital segment and was primarily due to an increase in expenses associated with the increase in digital advertising revenue, an increase in salary expense and our acquisitions of MediaDonuts and 365 Digital during the third and fourth quarters of 2021, respectively, both of which did not incur operating expenses for us in the comparable period ended March 31, 2021. The overall increase was partially offset by a decrease of approximately $0.7 million that was attributable to our television segment primarily due to a decrease in expenses associated with the decrease in local and national advertising revenue, and a decrease of approximately $0.3 million that was attributable to our audio segment primarily due to a decrease in rating services expense.

Corporate expenses in the first quarter of 2022 totaled $8.7 million, up 22% from $7.2 million in the prior-year period. The increase was primarily due to increases in non-cash stock-based compensation, salaries, and audit fees.

Balance Sheet and Related Metrics

Cash and marketable securities as of March 31, 2022 totaled approximately $211.6 million. Total debt was $211.8 million. Net of $75 million of cash and marketable securities, total leverage as defined in the Company’s credit agreement was 1.5 times as of March 31, 2022. Net of total cash and marketable securities, total leverage was 0.0 times.

Unaudited Segment Results (In thousands)


Three-Month Period


Ended March 31,


2022


2021


% Change


Net
Revenue


Digital

$

153,711


$

101,482


51

%

Television


30,867


36,091


(14

)%

Audio


12,594


11,307


11

%

Total

$

197,172


$

148,880


32

%


Cost
of Revenue – digital (1)


Digital

$

129,891


$

84,756


53

%


Operating Expenses (1)


Digital


15,235


10,850


40

%

Television


19,240


19,884


(3

)%

Audio


9,387


9,680


(3

)%

Total

$

43,862


$

40,414


9

%


Corporate Expenses (1)

$

8,724


$

7,158


22

%


Consolidated adjusted EBITDA
(1)

$

18,113


$

14,195


28

%

(1)

Cost of revenue, operating expenses, corporate expenses, and consolidated adjusted EBITDA are defined on page 2.

Notice of Conference Call

Entravision Communications Corporation will hold a conference call to discuss its first quarter 2022 results on Thursday, May 5, 2022 at 5 p.m. Eastern Time. To access the conference call, please dial (877) 407-9716 (U.S.) or (201) 493-6779 (Int’l) ten minutes prior to the start time and reference Conference ID number 13728063. The call will also be available via live webcast on the investor relations portion of the Company’s website located at 
www.entravision.com.

About Entravision Communications Corporation

Entravision is a leading global advertising, media and ad-tech solutions company connecting brands to consumers by representing top platforms and publishers. Our dynamic portfolio includes digital, television and audio offerings. Digital, our largest revenue segment, is comprised of four business units: our digital sales representation business; Smadex, our programmatic ad purchasing platform; our branding and mobile performance solutions business; and our digital audio business. Through our digital sales representation business, we connect global media companies such as Meta, Twitter, TikTok and Spotify with advertisers in primarily emerging growth markets worldwide. Smadex is our mobile-first demand side platform, enabling advertisers to execute performance campaigns using machine learning. We also offer a branding and mobile performance solutions business, which provides managed services to advertisers looking to connect with global consumers, primarily on mobile devices, and our digital audio business provides digital audio advertising solutions for advertisers in the Americas. In addition to digital, Entravision has 49 television stations and is the largest affiliate group of the Univision and UniMás television networks. Entravision also manages 46 primarily Spanish-language radio stations that feature nationally recognized, Emmy award-winning talent. Shares of Entravision Class A Common Stock trade on the NYSE under ticker: EVC. Learn more about our offerings at entravision.com or connect with us on LinkedIn and Facebook.

Forward-Looking Statements

This press release contains certain forward-looking statements. These forward-looking statements, which are included in accordance with the safe harbor provisions of the Private Securities Litigation Reform Act of 1995, may involve known and unknown risks, uncertainties and other factors that may cause the Company’s actual results and performance in future periods to be materially different from any future results or performance suggested by the forward-looking statements in this press release. Although the Company believes the expectations reflected in such forward-looking statements are based upon reasonable assumptions, it can give no assurance that actual results will not differ materially from these expectations, and the Company disclaims any duty to update any forward-looking statements made by the Company. From time to time, these risks, uncertainties and other factors are discussed in the Company’s filings with the Securities and Exchange Commission.

(Financial Table Follows)

Entravision Communications Corporation

Consolidated Statements of Operations

(In thousands, except share and per share data)

(Unaudited)


Three-Month Period


Ended March 31,


2022


2021


Net revenue


$

197,172


$

148,880


Expenses:


Cost of revenue – digital


129,891


84,756


Direct operating expenses


27,823


26,561


Selling, general and administrative expenses


16,039


13,853


Corporate expenses


8,724


7,158


Depreciation and amortization


6,395


5,184


Change in fair value of contingent consideration


5,100


Impairment charge


1,326


Foreign currency (gain) loss


(847

)


586


Other operating (gain) loss


(119

)


(1,913

)


193,006


137,511


Operating income (loss)


4,166


11,369


Interest expense


(1,836

)


(1,717

)

Interest income


406


140


Dividend income


3


2


Income (loss) before income taxes


2,739


9,794


Income tax benefit (expense)


(852

)


(2,792

)


Net income (loss)


1,887


7,002


Net (income) loss attributable to redeemable noncontrolling interest


(1,573

)

Net income (loss) attributable to common stockholders


$

1,887


$

5,429


Basic and diluted earnings per share:


Net income (loss) per share attributable to common stockholders, basic and diluted


$

0.02


$

0.06


Cash dividends declared per common share, basic and diluted


$

0.03


$

0.03


Weighted average common shares outstanding, basic


86,522,378


85,041,628


Weighted average common shares outstanding, diluted


88,630,216


86,986,581


Entravision Communications Corporation

Consolidated Balance Sheets

(In thousands; unaudited)


March 31,


December 31,


2022


2021


ASSETS


Current assets


Cash and cash equivalents


$

126,574


$

185,094


Marketable securities


85,010


Restricted cash


749


749


Trade receivables, net of allowance for doubtful accounts


173,419


201,747


Assets held for sale


1,963


1,963


Prepaid expenses and other current assets


36,341


18,925


Total current assets


424,056


408,478


Property and equipment, net


60,174


62,498


Intangible assets subject to amortization, net


61,476


64,034


Intangible assets not subject to amortization


209,053


209,053


Goodwill


71,708


71,708


Deferred income taxes


1,462


1,462


Operating leases right of use asset


25,596


25,582


Other assets


8,084


8,527


Total assets


$

861,609


$

851,342


LIABILITIES AND STOCKHOLDERS’ EQUITY


Current liabilities


Current maturities of long-term debt


$

4,947


$

4,903


Accounts payable and accrued expenses


222,610


212,655


Operating lease liabilities


6,808


7,304


Total current liabilities


234,365


224,862


Long-term debt, less current maturities, net of unamortized debt issuance costs


206,816


207,416


Long-term operating lease liabilities


21,505


20,988


Other long-term liabilities


79,076


72,930


Deferred income taxes


68,092


68,220


Total liabilities


609,854


594,416


Stockholders’ equity


Class A common stock


6


6


Class B common stock


2


2


Class U common stock


1


1


Additional paid-in capital


773,613


780,388


Accumulated deficit


(520,607

)


(522,494

)

Accumulated other comprehensive income (loss)


(1,260

)


(977

)

Total stockholders’ equity


251,755


256,926


Total liabilities and stockholders’ equity


$

861,609


$

851,342


Entravision Communications Corporation

Consolidated Statements of Cash Flows

(In thousands; unaudited)


Three-Month Period


Ended March 31,


2022


2021


Cash
flows from operating activities:


Net income (loss)


$

1,887


$

7,002


Adjustments to reconcile net income (loss) to net cash provided by operating activities:


Depreciation and amortization


6,395


5,184


Impairment charge


1,326


Deferred income taxes


(359

)


2,987


Non-cash interest


280


139


Amortization of syndication contracts


116


119


Payments on syndication contracts


(118

)


(124

)

Non-cash stock-based compensation


2,573


1,071


(Gain) loss on disposal of property and equipment


(151

)


Change in fair value of contingent consideration

5,100

Changes in assets and liabilities:


(Increase) decrease in accounts receivable


29,380


9,927


(Increase) decrease in prepaid expenses and other assets


(2,405

)


1,177


Increase (decrease) in accounts payable, accrued expenses and other liabilities


10,521


(5,356

)

Net
cash provided by operating activities


53,219


23,452


Cash flows from investing
activities:


Proceeds from sale of property and equipment and intangibles


164


Purchases of property and equipment


(1,547

)


(1,838

)

Purchases of marketable securities


(85,517

)


Proceeds from marketable securities


12,120


Net
cash provided by investing activities


(86,900

)


10,282


Cash flows from financing
activities:


Proceeds from stock option exercises


218


Tax payments related to shares withheld for share-based compensation plans


(257

)


(9

)

Payments on long-term debt


(750

)


(750

)

Dividends paid


(2,167

)


(2,126

)

Repurchase of Class A common stock


(7,142

)


Payment of contingent consideration


(14,730

)


Principal payments under finance lease obligation


(10

)


Net cash used in financing
activities


(24,838

)


(2,885

)

Effect
of exchange rates on cash, cash equivalents and restricted cash


(1

)


(24

)

Net increase (decrease) in
cash, cash equivalents and restricted cash


(58,520

)


30,825


Cash,
cash equivalents and restricted cash:


Beginning


185,843


119,911


Ending


$

127,323


$

150,736


Entravision Communications Corporation

Reconciliation of Consolidated Adjusted EBITDA to Cash Flows
From Operating Activities

(In thousands; unaudited)


The most directly comparable GAAP financial measure is operating cash flow. A reconciliation of this non-GAAP measure to cash flows from operating activities for each of the periods presented is as follows:


Three-Month Period


Ended March 31,


2022


2021


Consolidated adjusted EBITDA (1)


$

18,113


$

14,195


EBITDA attributable to redeemable noncontrolling interest


2,837


Interest expense


(1,836

)


(1,717

)

Interest income


406


140


Dividend income


3


2


Income tax expense


(852

)


(2,792

)

Amortization of syndication contracts


(116

)


(119

)

Payments on syndication contracts


118


124


Non-cash stock-based compensation included in direct operating expenses


(958

)


(316

)

Non-cash stock-based compensation included in corporate expenses


(1,615

)


(755

)

Depreciation and amortization


(6,395

)


(5,184

)

Change in fair value of contingent consideration


(5,100

)


Impairment charge


(1,326

)

Other operating gain (loss)


119


1,913


Net (income) loss attributable to redeemable noncontrolling interest


(1,573

)

Net income (loss) attributable to common stockholders


1,887


5,429


Depreciation and amortization


6,395


5,184


Impairment charge


1,326


Deferred income taxes


(359

)


2,987


Non-cash interest


280


139


Amortization of syndication contracts


116


119


Payments on syndication contracts


(118

)


(124

)

Non-cash stock-based compensation


2,573


1,071


(Gain) loss on disposal of property and equipment


(151

)


Change in fair value of contingent consideration

5,100

Net income (loss) attributable to redeemable noncontrolling interest


1,573


Changes in assets and liabilities:


(Increase) decrease in accounts receivable


29,380


9,927


(Increase) decrease in prepaid expenses and other assets


(2,405

)


1,177


Increase (decrease) in accounts payable, accrued expenses and other liabilities


10,521


(5,356

)

Cash flows from operating activities


53,219


23,452


(1)

Consolidated adjusted EBITDA is defined on page 2.

Entravision Communications Corporation

Reconciliation of Free Cash Flow to Cash Flows From Operating
Activities

(In thousands; unaudited)


The most directly comparable GAAP financial measure is operating cash flow. A reconciliation of this non-GAAP measure to cash flows from operating activities for each of the periods presented is as follows:


Three-Month Period


Ended March 31,


2022


2021


Consolidated adjusted EBITDA (1)


$

18,113


$

14,195


Net interest expense (1)


(1,150

)


(1,438

)

Dividend income


3


2


Cash paid for income taxes


(1,211

)


195


Capital expenditures (2)


(1,547

)


(1,838

)

Other operating gain (loss)


119


1,913


Free cash flow (1)


14,327


13,029


Capital expenditures (2)


1,547


1,838


EBITDA attributable to redeemable noncontrolling interest


2,837


(Gain) loss on disposal of property and equipment


(151

)


Changes in assets and liabilities:


(Increase) decrease in accounts receivable


29,380


9,927


(Increase) decrease in prepaid expenses and other assets


(2,405

)


1,177


Increase (decrease) in accounts payable, accrued expenses and other liabilities


10,521


(5,356

)

Cash Flows From Operating Activities


$

53,219


$

23,452


(1)

Consolidated adjusted EBITDA, net interest expense, and free cash flow are defined on page 2.

(2)

Capital expenditures are not part of the consolidated statement of operations.


View source version on businesswire.comhttps://www.businesswire.com/news/home/20220503006391/en/

Christopher T. Young
Chief Financial Officer
Entravision Communications Corporation
310-447-3870

Kimberly Esterkin
ADDO Investor Relations
310-829-5400

evc@addo.com

Source: Entravision Communications Corporation


Release – Entravision Expands into Kenya and Names New Director of Local Operations


Entravision Expands into Kenya and Names New Director of Local Operations

Research, News, and Market Data on Entravision

Expansion provides access to a
high-growth, emerging digital advertising industry with significant expansion
opportunities across East Africa

SANTA MONICA, Calif.–(BUSINESS WIRE)– Entravision (NYSE: EVC or “the Company”), a leading global advertising, media and ad-tech solutions company, announced today its expansion into Kenya. This expansion provides Entravision, through its Africa-based digital business unit, Entravision 365 Digital, a presence in East Africa, as it looks to expand its breadth of digital solutions, media representations and creative services to new emerging markets.

This press release features multimedia. View the full release here: 
https://www.businesswire.com/news/home/20220504005241/en/

With the expansion into Kenya, the Company also welcomes Maggie Ndirangu as its newly appointed Managing Director of Kenya Operations. Ms. Ndirangu has regional expertise and extensive knowledge of the digital landscape across Africa. This expansion aligns with Entravision’s goal to position Entravision 365 Digital as a local digital marketing solutions powerhouse, serving African companies and local leaders with advanced branding, performance, and creative needs.

“We’re thrilled to launch Entravision’s operations in Kenya, an exciting market for our African expansion,” said Julian Jordaan, CEO of Entravision 365 Digital. “With the third highest connected consumer base in Sub-Saharan Africa, and growing at a rapid rate, we believe that these numbers will only continue to climb and ultimately represent 17% of the digital advertising industry within the Sub-Saharan market by 2023. Kenya also has incredible talent and an advertising ecosystem primed with opportunity.”

Jordaan continued, “We are also pleased to welcome Maggie Ndirangu as Managing Director of our Kenyan operations. Maggie is an exceptional leader who brings with her years of knowledge in the marketing and advertising industries. She will be taking our partnerships, media representations and services to brands across the Kenya market.”

“Kenya has become a technology powerhouse in Africa over the last few years, with many global companies setting up Sub-Saharan African headquarters here. I’m honored to be joining Entravision to lead the Company’s expansion into East Africa and deliver marketing solutions that help businesses reach consumers, drive engagements and promote positive business impact across this region,” said Maggie Ndirangu.

Sub-Saharan Africa is an attractive digital marketplace with nearly 500 million digitally connected consumers. Importantly, the Sub-Saharan African customer is young, tech-savvy and digitally connected. By combining the Company’s platform and publisher partnerships with technology-driven design service, or “365 Studio,” Entravision’s evolution continues into a leading marketing technology service provider in the world’s highest growth economies.

About Entravision

Entravision is a leading global advertising, media and ad-tech solutions company connecting brands to consumers by representing top platforms and publishers. Its dynamic portfolio includes digital, television and audio offerings. Digital, the company’s largest revenue segment, is comprised of four business units: a digital sales representation business; Smadex, a programmatic ad purchasing platform; a branding and mobile performance solutions business; and a digital audio business. Through the digital sales representation business, the company connects global media companies such as Meta, Twitter, TikTok and Spotify with advertisers in primarily emerging growth markets worldwide. Smadex is the company’s mobile-first demand side platform, enabling advertisers to execute performance campaigns using machine learning. Entravision also offers a branding and mobile performance solutions business, which provides managed services to advertisers looking to connect with global consumers, primarily on mobile devices, and its digital audio business provides digital audio advertising solutions for advertisers in the Americas. In addition to digital, Entravision has 49 television stations and is the largest affiliate group of the Univision and UniMás television networks. Entravision also manages 46 primarily Spanish-language radio stations that feature nationally recognized, Emmy award-winning talent. Shares of Entravision Class A Common Stock trade on the NYSE under ticker: EVC. Learn more about the company’s offerings at entravision.com or connect with the company on LinkedIn.

About Entravision 365 Digital

Entravision 365 Digital is an African online media and ad-technology business with a rich heritage in the African advertising industry. For 21 years the business has represented the largest publishers and platforms in Africa and have helped global brands reach connected consumers and drive business impact. With a mission to connect publishers to brands, and brands to consumers, Entravision 365 Digital helps brands reach audiences at scale through its exclusive partnership with leading platforms like TikTok, Anzu, Boomplay, Triton Digital and many more. Entravision 365 Digital is a business unit of Entravision, a leading global advertising, media and ad-tech solutions company connecting brands to consumers by representing top platforms and publishers. Learn more about all of our innovative media, marketing and technology offerings at entravision365digital.com or connect with us on 
LinkedIn.

Forward-Looking Statements

This press release contains certain forward-looking statements. These forward-looking statements, which are included in accordance with the safe harbor provisions of the Private Securities Litigation Reform Act of 1995, may involve known and unknown risks, uncertainties and other factors that may cause the Company’s actual results and performance in future periods to be materially different from any future results or performance suggested by the forward-looking statements in this press release. Although the Company believes the expectations reflected in such forward-looking statements are based upon reasonable assumptions, it can give no assurance that actual results will not differ materially from these expectations, and the Company disclaims any duty to update any forward-looking statements made by the Company. From time to time, these risks, uncertainties and other factors are discussed in the Company’s filings with the Securities and Exchange Commission.

View source version on businesswire.comhttps://www.businesswire.com/news/home/20220504005241/en/

For more information please contact:

Entravision

Investors:
Christopher T. Young
Chief Financial Officer
310-447-3870

Kimberly Esterkin
Addo Investor Relations
evc@addo.com
310-829-5400

Entravision 365 Digital South Africa

Julian Jordaan
Chief Executive Officer, Entravision 365 Digital
+27 21 555 1975
Julian@365Digital.co.za
www.entravision365digital.com

Entravision 365 Digital Kenya

Maggie Ndirangu
Managing Director
maggie.ndirangu@entravision.com

Source: Entravision

Release – Gray and Telemundo Significantly Expand Affiliation Partnership


Gray and Telemundo Significantly Expand Affiliation Partnership

Research, News, and Market Data on Gray Television

ATLANTA, May 03, 2022
(GLOBE NEWSWIRE) — Gray Television, Inc. (“Gray,” “we,” or “our”) (NYSE:
GTN) 
has reached an agreement with Telemundo Network Group, LLC that extends the term of Gray’s affiliation agreements with Telemundo Network for its existing 12 markets, including Atlanta and 7 markets in Texas. The new agreement also awards Gray the right to launch the first-ever local Telemundo affiliations on Gray’s television stations in 22 additional markets.

Once the new Telemundo affiliated stations launch this year, Gray will own and operate television stations providing Telemundo’s top-tier programming to a total of 34 television markets with an estimated Hispanic population exceeding 3.75 million people. The newest Telemundo TV markets are located primarily in the South, which aligns with the Hispanic population growth within the US. According to Pew Research, the South saw the fastest growth among Hispanics, increasing by 26% from 2010 to 2019.

The expansion includes the upcoming launch of “Telemundo Georgia,” a new network of local television stations throughout the Peach State, including Macon, Columbus and Savannah. Initially, Telemundo Georgia will distribute the signal of Telemundo Atlanta (WKTB) in all markets.  Over time, the individual markets will create and launch local content supported by the flagship Atlanta affiliate station.

Susan Sim Oh, Gray’s Vice President of Strategy and Operations, Telemundo Station Group, explained, “Gray’s expansion of Telemundo into new markets exemplifies its commitment to serve all the audiences and businesses within the local communities it serves. Importantly, this investment goes beyond just providing the most exciting Spanish language programming to 34 television markets. It also includes concrete plans to increase essential local news and digital offerings to currently underserved Hispanic households powered by Gray’s strong local television stations in these markets.”

Telemundo is a top producer of original Spanish-language content in the US, producing over 3,000 hours of content per year ranging from scripted, reality, specials, sports, and more. Telemundo is a leader when it comes to connecting with audiences across all platforms through exclusive live events such as the FIFA World Cup, Olympics, Miss Universe, Latin Music Billboards, Chivas de Guadalajara, Premier League and Boxeo. Telemundo is home to the world’s most popular sporting events, the FIFA World Cup until 2026 and Summer Olympic Games through 2032.

Gray and Telemundo extended existing affiliation agreements between the companies for the following markets (Hispanic DMA in parenthesis):

Atlanta, GA (23)
Odessa-Midland, TX (37)
Waco-Temple-Bryan, TX (38)
Laredo, TX (40)
Lubbock, TX (51)
Amarillo, TX (53)
Cleveland, OH (55)
Reno, NV (60)
Honolulu, HI (67)
Tyler-Longview, TX (70)
Wichita Falls, TX & Lawton, OK (96)
Grand Junction, CO (135)

In addition, Gray will launch new Telemundo Network-affiliated channels on a mix of full-power and low power television stations serving the following 22 markets (Hispanic DMA in parenthesis):

Nashville, TN (54)
Mobile-Pensacola, AL (84)
Memphis, TN (85)
Savannah, GA (88)
Birmingham, AL (91)
Greenville-New Bern, NC (94)
Huntsville-Decatur, AL (97)
Shreveport, LA (98)
Knoxville, TN (105)
Tallahassee-Thomasville, FL (109)
Charleston, SC (112)
Gainesville, FL (125)
Augusta-Aiken, GA (126)
Myrtle Beach-Florence, SC (127)
Columbus, GA (Opelika, AL) (130)
Wilmington, NC (136)
Macon, GA (138)
Albany, GA (141)
Biloxi-Gulfport, MS (147)
Panama City, FL (152)
Montgomery-Selma, AL (158)
Bowling Green, KY (181)

Gray Television, Inc. is a multimedia company headquartered in Atlanta, Georgia. Gray is the nation’s largest owner of top-rated local television stations and digital assets in the United States.  Our television stations serve 113 television markets that collectively reach approximately 36 percent of US television households. This portfolio includes 80 markets with the top-rated television station and 100 markets with the first and/or second highest rated television station.  We also own video program companies Raycom Sports, Tupelo Honey, and PowerNation Studios, as well as the studio production facility Third Rail Studios.  For additional information, please visit www.gray.tv.

Release – Salem Media Group Schedules First Quarter 2022 Earnings Release and Teleconference


Salem Media Group Schedules First Quarter 2022 Earnings Release and Teleconference

Research, News, and Market Data on Salem Media

IRVING, Texas–(BUSINESS WIRE)– Salem Media
Group, Inc.
 (NASDAQ: SALM) announced today that it plans to report its first quarter 2022 financial results at 2:00 PM Central Time on May 10, 2022.

The company also plans to host a teleconference to discuss its results on May 10, 2022 at 3:00 PM Central Time. To access the teleconference, please dial (877) 524-8416, and then ask to be joined to the Salem Media Group First Quarter 2022 call or listen to the webcast.

A replay of the teleconference will be available through May 24, 2022 and can be heard by dialing (877) 660-6853 – replay pin number 13727921, or on the investor relations portion of the company’s website, located at investor.salemmedia.com.

ABOUT SALEM MEDIA GROUP:

Salem Media Group is America’s leading multimedia company specializing in Christian and conservative content, with media properties comprising radio, digital media and book and newsletter publishing. Each day Salem serves a loyal and dedicated audience of listeners and readers numbering in the millions nationally. With its unique programming focus, Salem provides compelling content, fresh commentary and relevant information from some of the most respected figures across the Christian and conservative media landscape. Learn more about Salem Media Group, Inc. at www.salemmedia.comFacebook and Twitter.

View source version on businesswire.com: https://www.businesswire.com/news/home/20220502005607/en/

Evan D. Masyr
Executive Vice President and Chief
Financial Officer
(805) 384-4512
evan@salemmedia.com

Source: Salem Media Group, Inc.