IRVING, Texas–(BUSINESS WIRE)– Salem Media Group, Inc. (NASDAQ: SALM) today announced revisions to its third quarter 2022 revenue. Taking into account the postponement of the forthcoming book, 2000 Mules by Dinesh D’Souza, until the fourth quarter, lower than expected revenue on SalemNOW and the impact on advertising revenue due to the weakening economic environment, the company now expects third quarter 2022 total revenue to be between flat and an increase of 2% over third quarter 2021 total revenue of $66.0 million.
ABOUT SALEM MEDIA GROUP:
Salem Media Group is America’s leading multimedia company specializing in Christian and conservative content, with media properties comprising radio, digital media and book and newsletter publishing. Each day Salem serves a loyal and dedicated audience of listeners and readers numbering in the millions nationally. With its unique programming focus, Salem provides compelling content, fresh commentary and relevant information from some of the most respected figures across the Christian and conservative media landscape. Learn more about Salem Media Group, Inc. at www.salemmedia.com, Facebook and Twitter.
What We Can Learn About SPAC Investments from Trump Media/DWAC
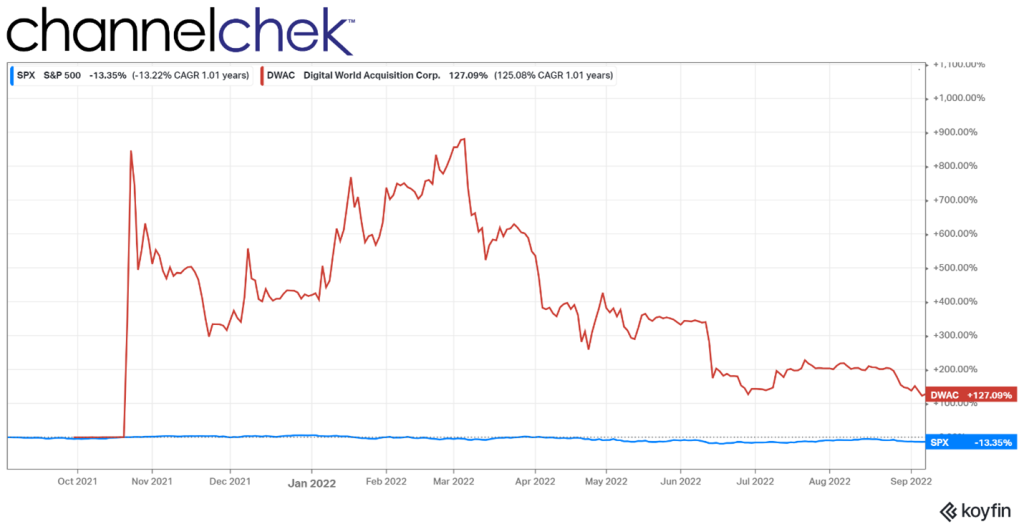
Digital World Acquisition Corp. (DWAC), the special purpose acquisition corporation (SPAC) that agreed to merge with Trump Media (TMTG), and take it public a year ago, needs 65% shareholder approval to extend its acquisition deadline by a year. The uncertainty over whether the SPAC would get the necessary votes to merge with the social media startup caused profit taking in the SPAC which still trades at more than double its IPO price.
Reuters reported late Monday (September 5), there has not been enough votes to reach a 65% threshold of “in favor” shareholder support to extend the merger completion date by one-year. A shareholder meeting Tuesday was adjourned and will resume on Thursday (September 8) where they will take up voting again.
In a federal filing Tuesday, DWAC said that if shareholders do not approve the extension, its sponsor, ARC Global Investments, would contribute about $2.9 million to extend the deadline until Dec. 8, 2022. The purpose of the deadline is to make time for all parties to address government investigations into the deal and make other necessary disclosures. If the three-month extension doesn’t prove to be enough time, another three-month extension is possible. This won’t be necessary if the shareholder vote garners a 65% approval of the extension.
After any SPAC exhausts extension options, it is faced with a final deadline. Should it not make the deadline, it must liquidate and return cash to shareholders. Such deadlines and extensions are commonplace in the world of SPACs. Scrambling for the parties to meet deadlines is not uncommon in SPAC merger deals. What is interesting in the DWAC TMTG acquisition is there are original IPO investors that at the time did not know who Digital World would unearth as a target candidate. They paid the $10 IPO price and, within a month, saw their share price jump up more than 800%. Even today these investors are up 124%, and if the SPAC liquidated tomorrow (near $10 per share) they will have outperformed the S&P 500 by double digits.
No matter the results, the SPAC IPO investors could consider themselves as having done better investing in the SPAC than most alternatives. But there are presumably also shareholders that bought shortly after the merger announcement that if liquidated and all the money held in escrow is returned, could lose several times their investment depending on what price they chased it to.
Shareholder voting is seldom in person and instead takes place by phone, online or via mail. Shareholders are urged to vote as reaching a 65% base of shareholders is difficult enough, reaching a 65% threshold of shareholders voting one way or another is even more difficult. Digital World Chief Executive Patrick Orlando said last week the SPAC was having trouble getting enough individuals to vote through their brokers.
The SPAC is held by a high percentage of retail accounts, this may explain the lack of voting. Failure to approve the extension will almost certainly cost current holders of DWAC money. If the deal falls through, shareholders will get roughly $10 a share, about half of the current share price.
Should the merger succeed, Digital World Acquisition would provide about $290 to the former president’s company. This could go a long way in building the brand and user base. Additionally, it is said that the two sides have investor commitments for roughly $1 billion private investment in public equity (PIPE), that would close alongside the merger.
TMTG raised about $20 million in convertible bonds last year and an additional $15 million in the first quarter of 2022. If the SPAC deal falls through there are options to keep the fledgling media company alive as a private company. On TMTG’s Truth Social on Friday, the former president responded to worries about the SPAC merger by saying, “In any event, I don’t need financing. ‘I’m really rich!’ Private company anyone?”
ROSTER INCLUDES SOME OF THE MOST ELITE ESPORTS AND MOTORSPORT TEAMS
MIAMI, Sept. 06, 2022 (GLOBE NEWSWIRE) — The entry list for the 2022-23 Le Mans Virtual Series – the global, elite endurance esports series and a joint venture between Motorsport Games Inc. (NASDAQ: MSGM) (“Motorsport Games”) and the Automobile Club de l’Ouest (“ACO”) – has today been revealed. The list features teams representing some of the most prestigious automotive manufacturers in the world, as well as elite esports squads from around the globe. The biggest full season Le Mans Virtual Series entry list to date, the complete roster can be found HERE.
Individual driver names, including championship-winning superstars from multiple disciplines around the world who will be making an appearance during the season, are due to be released on Monday, September 12, 2022 during a special TV Preview Show. Social media channels will have more news on how to view the show in the coming days. An additional 10 cars are expected to join the entry list for the increasingly popular, high profile 24 Hours of Le Mans Virtual on January 14 and 15, 2023 – the final round of the five-race series – attracting even more star names to add to the excitement. No fewer than 15 different nations are represented on the team entry list from Europe, the USA, Africa and the Far East, a 25% increase from last season.
The 40 full season entries are split between two categories of car (LMP2 – 24 cars; LMGTE – 16 cars), which will compete in races that range between four and 24 hours in duration. Top worldwide brands such as Alpine,Aston Martin, BMW, Ferrari, Mercedes-AMG and Porsche return for more top esports action and success, many with multiple entries.
The prestige manufacturer names are joined by the elite of sim racing competition, including LMP and GTE 2021 champions Team Redline and GTE Vice Champions Porsche Coanda Esports, who are stepping up to the prototype class. Among others, Romain Grosjean’s R8G Esports team will be competing alongside, Floyd Vanwall-Burst, Williams Esports, Alpine Esports, YAS Heat Veloce, AMG Team Petronas Esports and Jenson Button’s Rocket Simsport team in the prototype category, and all entries will compete with an ORECA 07 LMP2. Joining them for 2022 are Mexico Racing Team, Pescarolo Esport Monaco, Team Fordzilla and Brabham Esports, the latter of which is new to the Le Mans Virtual Series but bringing with it a name steeped in motorsport history.
Some of endurance racing’s most steadfast teams such as the European Le Mans Series’ Panis Racing, GR Vector eSport (a combination of two WEC teams), Proton Competition, D’Station Racing and ARC Bratislava are also featured on the list across the two categories.
The GTE class offers competitors a choice of Aston Martin Vantage GTE, BMW M8 GTE, Ferrari 488 GTE and Porsche 911 RSR GTE cars. Names familiar to both the real and sim racing worlds, such as MAHLE Racing Team, SIMMSA Esports, Oracle Red Bull Racing and Prodrive FYRA Esport, will be among the competitors vying for championship success.
The Le Mans Virtual Series will take place over five rounds, with the 24 Hours of Le Mans Virtual as its grand finale, as follows:
Round 1
8 Hours of Bahrain, Bahrain
September 17, 2022
Round 2
4 Hours of Monza, Italy
October 8, 2022
Round 3
6 Hours of Spa, Belgium
November 5, 2022
Round 4
500 Miles of Sebring, USA
December 3, 2022
Round 5
24 Hours of Le Mans Virtual
January 14/15, 2023
The calendar of events features some of the world’s most famous and recognizable racetracks – Monza, Spa, Bahrain, Sebring and Le Mans – which will challenge all the drivers, international FIA-licensed and sim racers alike, and thrill the millions of esports enthusiasts worldwide.
About Motorsport Games: Motorsport Games, a Motorsport Network company, is a leading racing game developer, publisher and esports ecosystem provider of official motorsport racing series throughout the world. Combining innovative and engaging video games with exciting esports competitions and content for racing fans and gamers, Motorsport Games strives to make the joy of racing accessible to everyone. The Company is the officially licensed video game developer and publisher for iconic motorsport racing series across PC, PlayStation, Xbox, Nintendo Switch and mobile, including NASCAR, INDYCAR, 24 Hours of Le Mans and the British Touring Car Championship (“BTCC”), as well as the industry leading rFactor 2 and KartKraft simulations. RFactor 2 also serves as the official sim racing platform of Formula E, while also powering Formula 1™ centers through a partnership with Kindred Concepts. Motorsport Games is an award-winning esports partner of choice for 24 Hours of Le Mans, Formula E, BTCC, the FIA World Rallycross Championship and the eNASCAR Heat Pro League, among others. Motorsport Games is building a virtual racing ecosystem where each product drives excitement, every esports event is an adventure and every story inspires.
About Le Mans Virtual Series Le Mans Virtual Series is a global, elite esports series made up of five rounds which bring together endurance racing and sim racing’ top teams to compete on some of the world’s most famous racetracks. International FIA-licensed real-world drivers are teamed up with elite esports squads to take on endurance classics for a total prize fund of US$250,000, culminating in the prestigious 24 Hours of Le Mans Virtual. Le Mans Virtual Series is a joint venture between leading racing game developer, publisher and esports ecosystem provider of official motorsport racing series throughout the world, Motorsport Games, and the Automobile Club de l’Ouest (ACO) – the creator and organizer of the world-famous 24 Hours of Le Mans and promoter of the FIA World Endurance Championship (FIA WEC).
Forward-Looking Statements: Certain statements in this press release which are not historical facts are forward-looking statements within the meaning of Section 27A of the Securities Act of 1933, as amended, and Section 21E of the Securities Exchange Act of 1934, as amended, and are provided pursuant to the safe harbor provisions of the Private Securities Litigation Reform Act of 1995. Any statements in this press release that are not statements of historical fact may be deemed forward-looking statements. Words such as “continue,” “will,” “may,” “could,” “should,” “expect,” “expected,” “plans,” “intend,” “anticipate,” “believe,” “estimate,” “predict,” “potential,” and similar expressions are intended to identify such forward-looking statements. These forward-looking statements include, but are not limited to, statements concerning the timing, participants and expected benefits of the 2022-23 Le Mans Virtual Series. All forward-looking statements involve significant risks and uncertainties that could cause actual results to differ materially from those expressed or implied in the forward-looking statements, many of which are generally outside the control of Motorsport Games and are difficult to predict. Examples of such risks and uncertainties include, but are not limited to: difficulties, delays in or unanticipated events that may impact the timing and expected benefits of the le mans Virtual Series, such as due to unexpected changes in the event participants, as well as challenges that may arise from difficulties, delays or less than expected results in achieving the Company’s growth plans, strategies, objectives and expectations, such as due to a slower than anticipated economic recovery and/or the Company’s inability, in whole or in part, to continue to execute its business strategies and plans, such as due to less than anticipated participation in or viewership of the Le Mans Virtual Series events. Factors other than those referred to above could also cause Motorsport Games’ results to differ materially from expected results. Additional examples of such risks and uncertainties include, but are not limited to: (i) Motorsport Games’ ability (or inability) to maintain existing, and to secure additional, licenses and other agreements with various racing series; (ii) Motorsport Games’ ability to successfully manage and integrate any joint ventures, acquisitions of businesses, solutions or technologies; (iii) unanticipated operating costs, transaction costs and actual or contingent liabilities; (iv) the ability to attract and retain qualified employees and key personnel; (v) adverse effects of increased competition; (vi) changes in consumer behavior, including as a result of general economic factors, such as increased inflation, higher energy prices and higher taxes and interest rates; (vii) Motorsport Games’ ability to protect its intellectual property; and/or (viii) local, industry and general business and economic conditions. Additional factors that could cause actual results to differ materially from those expressed or implied in the forward-looking statements can be found in Motorsport Games’ filings with the Securities and Exchange Commission (the “SEC”), including its Annual Report on Form 10-K for the fiscal year ended December 31, 2021, its Quarterly Reports on Form 10-Q filed with the SEC during 2022, as well as in its subsequent filings with the SEC. Motorsport Games anticipates that subsequent events and developments may cause its plans, intentions and expectations to change. Motorsport Games assumes no obligation, and it specifically disclaims any intention or obligation, to update any forward-looking statements, whether as a result of new information, future events or otherwise, except as expressly required by law. Forward-looking statements speak only as of the date they are made and should not be relied upon as representing Motorsport Games’ plans and expectations as of any subsequent date. Additionally, the business and financial materials and any other statement or disclosure on, or made available through, Motorsport Games’ website or other websites referenced or linked to this press release shall not be incorporated by reference into this press release.
Website and Social Media Disclosure: Investors and others should note that we announce material financial information to our investors using our investor relations website (ir.motorsportgames.com), SEC filings, press releases, public conference calls and webcasts. We use these channels, as well as social media and blogs, to communicate with our investors and the public about our company and our products. It is possible that the information we post on our websites, social media and blogs could be deemed to be material information. Therefore, we encourage investors, the media and others interested in our company to review the information we post on the websites, social media channels and blogs, including the following (which list we will update from time to time on our investor relations website):
Codere Online refers, collectively, to Codere Online Luxembourg, S.A. and its subsidiaries. Codere Online launched in 2014 as part of the renowned casino operator Codere Group. Codere Online offers online sports betting and online casino through its state-of-the art website and mobile application. Codere currently operates in its core markets of Spain, Italy, Mexico, Colombia, Panama and the City of Buenos Aires (Argentina). Codere Online’s online business is complemented by Codere Group’s physical presence throughout Latin America, forming the foundation of the leading omnichannel gaming and casino presence in the region.
Michael Kupinski, Director of Research, Noble Capital Markets, Inc.
Patrick McCann, Research Associate, Noble Capital Markets, Inc.
Refer to the full report for the price target, fundamental analysis, and rating.
Q2 results. The company reported Q2 net gaming revenue of €29.2 million, representing 41% year-over-year growth, which was an acceleration from the 24% year-over-year growth in Q1. Growth in Mexico continued to be strong, at 85%, while revenue in Spain also grew over the prior year period by 12%.
Planning expansion in Argentina. In August, the company completed its application for an online gaming license in the Argentine province of Cordoba. Management noted that a decision on the application is expected in the next month. Licenses are expected to be issued before year-end for approved operators…
This Company Sponsored Research is provided by Noble Capital Markets, Inc., a FINRA and S.E.C. registered broker-dealer (B/D).
*Analyst certification and important disclosures included in the full report. NOTE: investment decisions should not be based upon the content of this research summary. Proper due diligence is required before making any investment decision.
Entravision Communications (EVC) A Positive Message
Entravision Communications Corporation is a diversified Spanish-language media company utilizing a combination of television and radio operations to reach Hispanic consumers across the United States, as well as the border markets of Mexico. Entravision owns and/or operates 53 primary television stations and is the largest affiliate group of both the top-ranked Univision television network and Univision’s TeleFutura network, with television stations in 20 of the nation’s top 50 Hispanic markets. The Company also operates one of the nation’s largest groups of primarily Spanish-language radio stations, consisting of 48 owned and operated radio stations.
Michael Kupinski, Director of Research, Noble Capital Markets, Inc.
Patrick McCann, Research Associate, Noble Capital Markets, Inc.
Refer to the full report for the price target, fundamental analysis, and rating.
Non-deal road show highlights: Last week, EVC hosted meetings for investors in Kansas City. Chris Young, CFO, highlighted the company’s strong growth prospects, which have resulted from the company’s transition to a digitally based business.
Expanding key Facebook relationship in LatinAm: Through its subsidiary, Cisneros, the company is the exclusive ad rep for Facebook in certain countries in Latin America. Notably, the company has expanded its Facebook relationship to include Honduras AND El Salvador, and will continue to seek opportunities to expand its valuable Facebook relationship.
…
This Company Sponsored Research is provided by Noble Capital Markets, Inc., a FINRA and S.E.C. registered broker-dealer (B/D).
*Analyst certification and important disclosures included in the full report. NOTE: investment decisions should not be based upon the content of this research summary. Proper due diligence is required before making any investment decision.
Collaboration will
expand sales and marketing opportunities that target the Latino community
SANTA MONICA, Calif.–(BUSINESS WIRE)– Entravision (NYSE: EVC), a leading global advertising solutions, media and technology company, today announced a strategic partnership with LATV Networks, a minority-owned and operated media company serving the Latino community as a content hub, talent incubator and cultural advocate.
“Entravision is very excited to partner with LATV Networks,” said Juan Saldivar, Chief Digital and Strategy Officer of Entravision. “Our Company has extensive digital marketing expertise when it comes to reaching growing Latino audiences. This new partnership will provide LATV Networks with avenues to expand the distribution of their younger-skewing bilingual content at scale by leveraging our advanced technology infrastructure. At the same time, it further strengthens Entravision’s marketing portfolio of digital and content platforms.”
Through shared resources, content collaborations, and customized executions, Entravision and LATV Networks will deliver creative and engagement-driven solutions that will allow access to the growing influential power of Latinos. LATV Networks will be able to further advance their unique value proposition to bring to market a more comprehensive offering supercharged by Entravision. Entravision will help accelerate LATV Networks’ digital growth by providing advanced data technology and multi-channel distribution for LATV Networks’ original content. The partnership will bring to market a unique connected television (CTV) offering with over 5,000 hours of content and innovative premium digital video content designed to expand the video marketplace across LATV Networks’ core content pillars: Latino Culture, Latinas, LGBTQ+ and Afro-Latinos.
“By accelerating the growth of our CTV and digital platforms uniquely emphasizing Latino culture beyond language, this partnership addresses many of the challenges of marketing to our diverse and nuanced culture. Together, Entravision and LATV Networks will deliver unprecedented value to advertisers looking for innovative and flexible ways to reach Hispanic consumers of all ages, language choices, and media consumption preferences,” said Andres Palencia, CEO of LATV Networks.
Adding to Mr. Palencia’s statement, Bruno Seros-Ulloa, President of LATV Networks stated, “This collaboration addresses the increasing demand for our groundbreaking, authentic Latino content that can now be even further amplified with Entravision’s support. From arts and entertainment to food, fashion, music and lifestyle, LATV Networks truly immerses itself in all things Latino.”
“The union of Entravision, a proven leader in the Hispanic media market, and LATV Networks, a unique content hub for the Latino community, offers brands even more opportunities to share robust and creative campaigns with their target audiences,” said Chris Munoz, EVP of National Sales for Entravision. “Marketers are more aggressive now than ever before when it comes to engaging with consumers. As a result, they recognize the importance of delivering their message in precisely the right environment. Our vast portfolio of combined assets will provide our new mutual clients with a variety of innovative solutions that meet their evolving marketing needs.”
Through LATV Networks’ high volume production capabilities, this partnership addresses the increasing demand for authentic Latino content. Entravision will assist and support LATV Networks with the expansion of their content on streaming platforms such as Pluto TV, STIR, VIX and Peacock, among others. Further, Entravision and LATV Networks will approach new sales initiatives with customized incentives to provide first-to-market omni-channel offerings as well as open cross-promotion sales and distribution opportunities to advertisers. For more information on programming and how to watch LATV Networks, please visit latv.com/schedule.
About Entravision
Entravision is a leading global advertising solutions, media and technology company connecting brands to consumers. Our dynamic portfolio includes digital, television and audio offerings. Digital, our largest revenue segment, is comprised of four business units: our digital sales representation business; Smadex, our programmatic ad purchasing platform; our branding and mobile performance solutions business; and our digital audio business. Through our digital sales representation business, we connect global media companies such as Meta, Twitter, TikTok and Spotify with advertisers in primarily emerging growth markets worldwide. Smadex is our mobile-first demand side platform, enabling advertisers to execute performance campaigns using machine learning. We also offer a branding and mobile performance solutions business, which provides managed services to advertisers looking to connect with global consumers, primarily on mobile devices, and our digital audio business provides digital audio advertising solutions for advertisers in the Americas. In addition to digital, Entravision has 49 television stations and is the largest affiliate group of the Univision and UniMás television networks. Entravision also manages 46 primarily Spanish-language radio stations that feature nationally recognized, Emmy award-winning talent. Shares of Entravision Class A Common Stock trade on The New York Stock Exchange under the ticker symbol: EVC. Learn more about all of our media, marketing and technology offerings at entravision.com or connect with us on LinkedIn and Facebook.
About LATV Networks
Latino Alternative TV (LATV) is a pioneering bilingual media company elevating the Latino voices redefining culture. LATV is a certified minority-owned company amplifying authentic bilingual content through cable TV, digital publishing, social media, and streaming. LATV content emphasizes Latino culture and Latina empowerment, as well as LGBTQ+ and Afro-Latino pride. For more information visit latv.com.
Forward Looking
Statements
This press release contains certain forward-looking statements. These forward-looking statements, which are included in accordance with the safe harbor provisions of the Private Securities Litigation Reform Act of 1995, may involve known and unknown risks, uncertainties and other factors that may cause the Company’s actual results and performance in future periods to be materially different from any future results or performance suggested by the forward-looking statements in this press release. Although the Company believes the expectations reflected in such forward-looking statements are based upon reasonable assumptions, it can give no assurance that actual results will not differ materially from these expectations, and the Company disclaims any duty to update any forward-looking statements made by the Company. From time to time, these risks, uncertainties and other factors are discussed in the Company’s filings with the Securities and Exchange Commission.
QuoteMedia is a leading software developer and cloud-based syndicator of financial market information and streaming financial data solutions to media, corporations, online brokerages, and financial services companies. The Company licenses interactive stock research tools such as streaming real-time quotes, market research, news, charting, option chains, filings, corporate financials, insider reports, market indices, portfolio management systems, and data feeds. QuoteMedia provides industry leading market data solutions and financial services for companies such as the Nasdaq Stock Exchange, TMX Group (TSX Stock Exchange), Canadian Securities Exchange (CSE), London Stock Exchange Group, FIS, U.S. Bank, Broadridge Financial Systems, JPMorgan Chase, CI Financial, Canaccord Genuity Corp., Hilltop Securities, HD Vest, Stockhouse, Zacks Investment Research, General Electric, Boeing, Bombardier, Telus International, Business Wire, PR Newswire, FolioFN, Regal Securities, ChoiceTrade, Cetera Financial Group, Dynamic Trend, Inc., Qtrade Financial, CNW Group, IA Private Wealth, Ally Invest, Inc., Suncor, Virtual Brokers, Leede Jones Gable, Firstrade Securities, Charles Schwab, First Financial, Cirano, Equisolve, Stock-Trak, Mergent, Cision, Day Trade Dash and others. Quotestream®, QModTM and Quotestream ConnectTM are trademarks of QuoteMedia. For more information, please visit www.quotemedia.com.
Michael Kupinski, Director of Research, Noble Capital Markets, Inc.
Patrick McCann, Research Associate, Noble Capital Markets, Inc.
Refer to the full report for the price target, fundamental analysis, and rating.
Q2 misses expectations. Revenues increased 12% to $4.30 million but were 7.5% lower than our $4.65 million estimate. Management identified a shift in revenue from a large client, deferred into the third quarter contributed to the Q2 revenue shortfall. Lower than expected gross margins and higher than expected G&A and Software Development expenses, all contributed to lower than expected adj. EBITDA of $564,000 versus our $765,000 estimate.
Outlook appears on track. Management reiterated its full year 2022 revenue growth guidance of 20%. The deferred revenue is now expected to be recognized in the second half of the year. We are tweaking our full year revenue estimate slightly, from 22% growth to 20% growth, in line with current guidance. Given higher than anticipated G&A and Development costs, we are revising our full year adj. EBITDA estimate down from our original $3.17 million to $2.64 million. We are maintaining our 2023 revenue and adj. EBITDA forecast.
…
This Company Sponsored Research is provided by Noble Capital Markets, Inc., a FINRA and S.E.C. registered broker-dealer (B/D).
*Analyst certification and important disclosures included in the full report. NOTE: investment decisions should not be based upon the content of this research summary. Proper due diligence is required before making any investment decision.
QuoteMedia is a leading software developer and cloud-based syndicator of financial market information and streaming financial data solutions to media, corporations, online brokerages, and financial services companies. The Company licenses interactive stock research tools such as streaming real-time quotes, market research, news, charting, option chains, filings, corporate financials, insider reports, market indices, portfolio management systems, and data feeds. QuoteMedia provides industry leading market data solutions and financial services for companies such as the Nasdaq Stock Exchange, TMX Group (TSX Stock Exchange), Canadian Securities Exchange (CSE), London Stock Exchange Group, FIS, U.S. Bank, Broadridge Financial Systems, JPMorgan Chase, CI Financial, Canaccord Genuity Corp., Hilltop Securities, HD Vest, Stockhouse, Zacks Investment Research, General Electric, Boeing, Bombardier, Telus International, Business Wire, PR Newswire, FolioFN, Regal Securities, ChoiceTrade, Cetera Financial Group, Dynamic Trend, Inc., Qtrade Financial, CNW Group, IA Private Wealth, Ally Invest, Inc., Suncor, Virtual Brokers, Leede Jones Gable, Firstrade Securities, Charles Schwab, First Financial, Cirano, Equisolve, Stock-Trak, Mergent, Cision, Day Trade Dash and others. Quotestream®, QModTM and Quotestream ConnectTM are trademarks of QuoteMedia. For more information, please visit www.quotemedia.com.
Michael Kupinski, Director of Research, Noble Capital Markets, Inc.
Refer to the full report for the price target, fundamental analysis, and rating.
Q2 disappoints. Revenues increased 12% to $4.30 million, but were 7.5% lower than our $4.65 million estimate. Notably, revenues moderated from the 18% revenue growth in the first quarter. We believe that adverse general market conditions and economic concerns impacted the company’s individual Quotestream business, which declined 9% yoy, and slowed revenue growth in its Corporate Quotestream segment, an increase in revenues of a modest 5.3% versus 20.4% in Q1.
Misses Adj. EBITDA estimate. Gross profit margins were slightly lower than expected. But, more importantly, G&A expenses and Software Development expenses were higher. As such, combined with the revenue miss, adj. EBITDA of $564,000 was lower than our $765,000 estimate. …
This Company Sponsored Research is provided by Noble Capital Markets, Inc., a FINRA and S.E.C. registered broker-dealer (B/D).
*Analyst certification and important disclosures included in the full report. NOTE: investment decisions should not be based upon the content of this research summary. Proper due diligence is required before making any investment decision.
PHOENIX, Aug. 22, 2022 (GLOBE NEWSWIRE) — QuoteMedia, Inc. (OTCQB: QMCI), a leading provider of market data and financial applications, announced financial results for the quarter ended June 30, 2022.
QuoteMedia provides banks, brokerage firms, private equity firms, financial planners and sophisticated investors with a more economical, higher quality alternative source of stock market data and related research information. We compete with several larger legacy organizations and a modest community of other smaller companies. QuoteMedia provides comprehensive market data services, including streaming data feeds, on-demand request-based data (XML/JSON), web content solutions (financial content for website integration) and applications such as Quotestream Professional desktop and mobile.
Highlights for Q2 2022 include the following:
Quarterly revenue increased to $4,298,957 in Q2 2022 from $3,833,018 in 2021, an increase of $465,939 (12%).
Net loss for Q2 2022 was $163,080 compared to a loss of $79,625 in Q2 2021, an increase of $83,455.
Adjusted EBITDA for Q2 2022 was $508,376 compared to $311,780 in Q2 2021, an improvement of $196,596.
“This was another great quarter for QuoteMedia,” said Robert J. Thompson, Chairman of the Board. “We have entered into several large-scale enterprise agreements with high profile banks and brokerage firms and have made significant progress on the development and implementation of these projects. We expect to recognize substantial associated revenue as these extensive deployments launch in the coming months. We have also begun several exciting partnerships with other market data and content vendors which will see them integrating our products and proprietary data sets and providing them to their clientele. We continued to experience healthy revenue growth, and we anticipate the pace of this growth to increase in the second half of this year. We made some non-recurring accounting adjustments that negatively impacted our bottom line this quarter. We expect to report profitability in the upcoming quarters and beyond. Consistent with previous forecasts, we remain on track to achieve full year revenue growth in the 20% range. We are very pleased with our results to date, and we are excited for what the future holds.”
QuoteMedia will host a conference call Tuesday, August 23, 2022 at 2:00 PM Eastern Time to discuss the Q2 2022 financial results and provide a business update.
Conference Call Details:
Date: August 23, 2022
Time: 2:00 PM Eastern
Dial-in number: 800-267-6316
Conference ID: QUOTEMEDIA
An audio rebroadcast of the call will be available later at: www.quotemedia.com
About
QuoteMedia
QuoteMedia is a leading software developer and cloud-based syndicator of financial market information and streaming financial data solutions to media, corporations, online brokerages, and financial services companies. The Company licenses interactive stock research tools such as streaming real-time quotes, market research, news, charting, option chains, filings, corporate financials, insider reports, market indices, portfolio management systems, and data feeds. QuoteMedia provides industry leading market data solutions and financial services for companies such as the Nasdaq Stock Exchange, TMX Group (TSX Stock Exchange), Canadian Securities Exchange (CSE), London Stock Exchange Group, FIS, U.S. Bank, Broadridge Financial Systems, JPMorgan Chase, CI Financial, Canaccord Genuity Corp., Hilltop Securities, HD Vest, Stockhouse, TheStreet.com, Zacks Investment Research, The Motley Fool, General Electric, Boeing, Bombardier, Telus International, Business Wire, PR Newswire, FolioFN, Regal Securities, ChoiceTrade, Cetera Financial Group, Dynamic Trend, Inc., Qtrade Financial, CNW Group, IA Private Wealth, Ally Invest, Inc., Suncor, Virtual Brokers, Leede Jones Gable, Firstrade Securities, Charles Schwab, First Financial, Cirano, Equisolve, Stock-Trak, Mergent, Cision, Day Trade Dash and others. Quotestream®, QMod™ and Quotestream Connect™ are trademarks of QuoteMedia. For more information, please visit www.quotemedia.com.
Statements about QuoteMedia’s future expectations, including future revenue, earnings, and transactions, as well as all other statements in this press release other than historical facts are “forward-looking statements” within the meaning of the Private Securities Litigation Reform Act of 1995. QuoteMedia intends that such forward-looking statements be subject to the safe harbors created thereby. These statements involve risks and uncertainties that are identified from time to time in the Company’s SEC reports and filings and are subject to change at any time. QuoteMedia’s actual results and other corporate developments could differ materially from that which has been anticipated in such statements.
Below are the specific forward-looking statements included in this press release:
We continued to experience healthy revenue growth, and we anticipate even greater revenue growth in the second half of this year. Consistent with previous forecasts, we remain on track to achieve full year revenue growth in the 20% range.
We believe that Adjusted EBITDA, as a non-GAAP pro forma financial measure, provides meaningful information to investors in terms of enhancing their understanding of our operating performance and results, as it allows investors to more easily compare our financial performance on a consistent basis compared to the prior year periods. This non-GAAP financial measure also corresponds with the way we expect investment analysts to evaluate and compare our results. Any non-GAAP pro forma financial measures should be considered only as supplements to, and not as substitutes for or in isolation from, or superior to, our other measures of financial information prepared in accordance with GAAP, such as net income attributable to QuoteMedia, Inc.
We define and calculate Adjusted EBITDA as net income attributable to QuoteMedia, Inc., plus: 1) depreciation and amortization, 2) stock compensation expense, 3) interest expense, 4) foreign exchange loss (or minus a foreign exchange gain), and 5) income tax expense. We disclose Adjusted EBITDA because we believe it is a useful metric by which to compare the performance of our business from period to period. We understand that measures similar to Adjusted EBITDA are broadly used by analysts, rating agencies, investors and financial institutions in assessing our performance. Accordingly, we believe that the presentation of Adjusted EBITDA provides useful information to investors. The table below provides a reconciliation of Adjusted EBITDA to net income attributable to QuoteMedia, Inc., the most directly comparable GAAP financial measure.
QuoteMedia,
Inc. Adjusted EBITDA Reconciliation to Net Income
Proven Track-Record in Delivering Revenue
& Channel Development Results in the Energy Sector to Power Direct Digital
Holdings’ Business Development
HOUSTON, Aug. 22, 2022 /PRNewswire/ — Direct Digital Holdings (Nasdaq: DRCT), a leading advertising and marketing technology platform and owner of operating companies Colossus SSP, Huddled Masses, and Orange 142, announced today that Maria Vilchez Lowrey has joined as Chief Growth Officer. In this newly created role, reporting to Chairman and CEO Mark Walker as a member of Direct Digital Holdings’ leadership team, Vilchez Lowrey is responsible for leading business development, channel development, and integrating the management of brand related activities across Direct Digital Holdings’ portfolio of brands.
Additionally, her appointment marks the professional reunion of Vilchez Lowrey with CEO Walker: they worked together earlier in their careers at NRG Energy, a leading Fortune 300 integrated power company. Vilchez Lowrey is an experienced sales leader with a proven 20-year record in creating business-to-consumer and business-to-business sales capabilities at scale within the Fortune 500.
“Few executives have the depth of experience and track-record to accelerate our business to the next level of growth – all while sharing our values and vision for the company,” said Walker. “Having worked together before, I can confidently say that Maria is a transformational executive leader, and I am certain that she will be instrumental in continuing Direct Digital Holdings’ fast-paced growth, setting us up for continued success.”
Vilchez Lowrey comes to Direct Digital Holdings from Just Energy, where she served as Senior Vice President of Direct Sales and Partnerships for Just Energy, Amigo Energy, Tara Energy, and Terrapass, its affiliate brands. There, she was responsible for diversifying the company’s direct sales channels by launching its first national retail partnership with one of the largest retailers in the world. Prior to that, she served in various key management positions across sales leadership, business development, operations, and project management at NRG Energy, Inc., primarily responsible for building new go-to-market sales channels and developing strategic partnerships with the most well-known brands in the country. Prior to NRG, Maria started her career in the steel industry as global supply chain transportation and procurement manager serving large multi-national consumer companies.
“Mark and his leadership team have built an impressive company, delivering on both the sell-and buy-sides of the advertising technology equation,” said Vilchez Lowrey. “The programmatic advertising and martech solutions that they bring to the marketplace are attracting top-tier and mid-market brands due to their high-levels of performance. I look forward to helping the group, its clients, and partners exceed market expectations.”
Vilchez Lowrey holds a B.S. in Management Information Systems from Texas A&M University.
An active member of the non-profit community, Lowrey serves as a board member for Homemade Hope and is an advisory council member for Houston Arts Alliance and Dress for Success Houston. Maria has been honored as Top 100 Diversity Leaders in Energy by the National Diversity Council in Feb 2021.
About Direct Digital
Holdings:
Direct Digital Holdings (Nasdaq: DRCT), owner of operating companies Colossus SSP, Huddled Masses, and Orange 142, brings state-of-the-art sell- and buy-side advertising platforms together under one umbrella company. Direct Digital Holdings’ sell-side platform, Colossus SSP, offers advertisers of all sizes extensive reach within general market and multicultural media properties. The company’s subsidiaries Huddled Masses and Orange142 deliver significant ROI for middle market advertisers by providing data-optimized programmatic solutions at scale for businesses in sectors that range from energy to healthcare to travel to financial services. Direct Digital Holdings’ sell- and buy-side solutions manage approximately 90,000 clients monthly, generating over 100 billion impressions per month across display, CTV, in-app and other media channels. The company has been named a top minority-owned business by The Houston Business Journal.
SANTA MONICA, Calif.–(BUSINESS WIRE)– Entravision (NYSE: EVC), a leading global advertising solutions, media and technology company, today announced Chris Young, Chief Financial Officer and Treasurer, will present at the 13th Annual Midwest IDEAS Investor Conference to be held August 24-25, 2022 in Chicago, Illinois. Management is scheduled to present on Wednesday, August 24, 2022 at 4:30 p.m. CT and will participate in meetings with investors throughout the day.
The presentation will be webcast live over the Internet, and a link to the live webcast and replay will be available on Entravision’s Investor Relations website at investor.entravision.com.
About Entravision Communications Corporation
Entravision is a leading global advertising, media and ad-tech solutions company connecting brands to consumers by representing top platforms and publishers. Our dynamic portfolio includes digital, television and audio offerings. Digital, our largest revenue segment, is comprised of four business units: our digital sales representation business; Smadex, our programmatic ad purchasing platform; our branding and mobile performance solutions business; and our digital audio business. Through our digital sales representation business, we connect global media companies such as Meta, Twitter, TikTok and Spotify with advertisers in primarily emerging growth markets worldwide. Smadex is our mobile-first demand side platform, enabling advertisers to execute performance campaigns using machine learning. We also offer a branding and mobile performance solutions business, which provides managed services to advertisers looking to connect with global consumers, primarily on mobile devices, and our digital audio business provides digital audio advertising solutions for advertisers in the Americas. In addition to digital, Entravision has 49 television stations and is the largest affiliate group of the Univision and UniMás television networks. Entravision also manages 45 primarily Spanish-language radio stations that feature nationally recognized, Emmy award-winning talent. Shares of Entravision Class A Common Stock trade on the NYSE under ticker: EVC. Learn more about our offerings at entravision.com or connect with us on LinkedIn and Facebook.
CHELMSFORD, MA / ACCESSWIRE /August 17, 2022/Harte Hanks Inc. (Nasdaq:HHS), a leading global customer experience company focused on bringing companies closer to customers for nearly 100 years, announced today that it has been selected by Quiet Platforms, a wholly owned subsidiary of American Eagle Outfitters, Inc. (NYSE:AEO), as their preferred “Middle Mile” logistics manager.
Quiet Platforms is an open logistics and transportation platform that serves retailers and brands looking to improve their delivery service while controlling network costs. The platform combines the fulfillment, logistics and transportation assets of over sixty partner brands for use by any retailer or brand in the network.
The platform currently serves a range of brands and clients including Steve Madden, Saks Off Fifth, Peloton, American Eagle and Aerie, among others. The company recently announced a collaboration with global shipper DHL to bring value-added carrier services to its growing network.
Under the partnership announced today, Harte Hanks will be Quiet Platforms’ preferred “Middle Mile” logistics manager, meaning Harte Hanks will be responsible for shipping parcels being transported in a range between 600 and 2,000 miles.
“As we continue to build and expand our Quiet Platforms business, we are excited to be working with Harte Hanks, a company that has been at the forefront of innovation in the logistics industry,” says Brent Beabout, president of Quiet Platforms. “Their leading-edge capabilities enable us to scale our operations quickly and efficiently, ensuring that we continue to enhance our customer experience.”
According to Pat O’Brien, Managing Director, Harte Hanks Fulfillment & Logistics Services, “We worked diligently to develop the right partnership model for Quiet Platforms that would leverage our shipping, logistics and data expertise while fully delivering on their e-commerce customer goals and expectations.”
About Harte Hanks:
Harte Hanks(Nasdaq:HHS) is a leading global customer experience company whose mission is to partner with clients to provide them with CX strategy, data-driven analytics and actionable insights combined with seamless program execution to better understand, attract and engage their customers.
Using its unparalleled resources and award-winning talent in the areas of Customer Care, Fulfillment and Logistics, and Marketing Services, Harte Hanks has a proven track record of driving results for some of the world’s premier brands, including Bank of America, GlaxoSmithKline, Unilever, Pfizer, HBOMax, Volvo, Ford, FedEx, Midea, Sony and IBM, among others. Headquartered in Chelmsford, Massachusetts, Harte Hanks has over 2,500 employees in offices across the Americas, Europe, and Asia Pacific.
About Quiet Platforms:
By creating interoperable open and sharing supply chain platforms powered by an intelligent and unified orchestration layer, Quiet Platforms helps companies collaborate to drive scale efficiencies and sustainability. The plug-and-play, open-sharing platform is enabling globally renowned retailers such as Kohl’s, Peloton, Steve Madden, Li & Fung and more than 60 others to optimize their inventory and access digital capabilities such as track and trace to increase efficiency and improve margins. A wholly owned subsidiary of American Eagle Outfitters, Inc. (NYSE: AEO), Quiet Platforms levels the playing field for small and midsized retailers by providing access to shared supply chain assets and relationships across every link of the chain – so they can ship less and operate more sustainably.
Motorsport Games Officially Licensed NASCAR Game to
Bring Users Authentic and Customizable Racing Experiences, Available for
Pre-order August 24
MIAMI, Aug. 17, 2022 (GLOBE NEWSWIRE) — Motorsport Games Inc. (NASDAQ: MSGM) (“Motorsport Games”), a leading racing game developer, publisher and esports ecosystem provider of official motorsport racing series throughout the world, announces today its official video game of the 2022 season, NASCAR
Rivals. This newest addition to the officially licensed NASCAR video game franchise will put the fun and intensity of the NASCAR Cup Series right into the hands of users everywhere with the Nintendo Switch console and will include new features that elevate players’ driving experience. NASCAR Rivals, prior to launching on October
14, 2022, will be available for pre-order beginning August
24, 2022 across leading retailers and the Nintendo eShop ($49.99). A link to the trailer can be found here.
“NASCAR Rivals is Motorsport Games’ latest racing experience that meets fans where they are, giving real-life drivers and NASCAR fans alike the ability to take it on the go,” said Dmitry Kozko, CEO of
Motorsport Games. “As we continue to work alongside NASCAR to grow its gaming franchise, we’re excited to give players the opportunity to out-do themselves on the track wherever they are thanks to the Switch’s portability.”
Players have the opportunity to compete and race in a variety of different modes in NASCAR
Rivals, with something for everyone. ‘Race Now’ will allow players to select any driver/team and race at any track on the 2022 NASCAR Cup Series circuit. ‘Career Mode’ gives players the chance to create their own legacy in the sport by either joining an existing team or creating one of their own, customizing their driver in the process. ‘Challenges’ will put players into scenarios inspired by real-life on-track events to see if they have what it takes to complete the challenge.
NASCAR Rivals is all about finding rivals on the track or on the go with several ‘Multiplayer’ functions presenting users with plenty of options for challenging others on the track. Players are able to race against their friends using the Nintendo Switch Joy Cons in ‘Split Screen’ mode or race online against 15 other players anywhere in the world with the online ‘Multiplayer’ feature. New to the game is the ‘Local Multiplayer’ feature in which players are able to race against up to seven other players on a local network.
The latest Nintendo Switch game from Motorsport Games will offer drivers the opportunity to create custom and unique schemes utilizing the enhanced ‘Paint Booth,’ which gives fans a host of customization options. Unique driver avatars can also be created with a variety of appearances, sponsor logos and more.
NASCAR Rivals was developed by Motorsport Games to ensure fans are able to embrace the intensity and thrill of NASCAR to the fullest degree with heightened accessibility through Nintendo’s portable Switch console. Fans now have the ability to take NASCAR with them and compete against their rivals anywhere they go, be that at the racetrack, at home and everywhere in between.
About Motorsport Games: Motorsport Games, a Motorsport Network company, is a leading racing game developer, publisher and esports ecosystem provider of official motorsport racing series throughout the world. Combining innovative and engaging video games with exciting esports competitions and content for racing fans and gamers, Motorsport Games strives to make the joy of racing accessible to everyone. The Company is the officially licensed video game developer and publisher for iconic motorsport racing series across PC, PlayStation, Xbox, Nintendo Switch and mobile, including NASCAR, INDYCAR, 24 Hours of Le Mans and the British Touring Car Championship (“BTCC”), as well as the industry leading rFactor 2 and KartKraft simulations. RFactor 2 also serves as the official sim racing platform of Formula E. Motorsport Games is an award-winning esports partner of choice for 24 Hours of Le Mans, Formula E, BTCC, the FIA World Rallycross Championship and the eNASCAR Heat Pro League, among others. Motorsport Games is building a virtual racing ecosystem where each product drives excitement, every esports event is an adventure and every story inspires.
Forward-Looking Statements:
Certain statements in this press release which are not historical facts are forward-looking statements within the meaning of Section 27A of the Securities Act of 1933, as amended, and Section 21E of the Securities Exchange Act of 1934, as amended, and are provided pursuant to the safe harbor provisions of the Private Securities Litigation Reform Act of 1995. Any statements in this press release that are not statements of historical fact may be deemed forward-looking statements. Words such as “continue,” “will,” “may,” “could,” “should,” “expect,” “expected,” “plans,” “intend,” “anticipate,” “believe,” “estimate,” “predict,” “potential,” and similar expressions are intended to identify such forward-looking statements. These forward-looking statements include, but are not limited to, statements concerning: (i) the release of the NASCAR
Rivals game on October 14, 2022 and its availability for pre-order beginning August 24, 2022 across leading retailers and the Nintendo eShop; (ii) the expectation that the new features of the NASCAR
Rivals game will elevate players’ driving experience; (iii) the expectation that the NASCAR Rivals game will enable the fans will have the ability to take NASCAR with them and compete against their rivals anywhere they go, be that at the racetrack, at home and everywhere in between; and (iv) the expected future impact of new or planned products, features and/or offerings and the timing of launching such products, features and/and offerings. All forward-looking statements involve significant risks and uncertainties that could cause actual results to differ materially from those expressed or implied in the forward-looking statements, many of which are generally outside the control of Motorsport Games and are difficult to predict. Examples of such risks and uncertainties include, but are not limited to: difficulties, delays in or unanticipated events that may impact the timing and scope of new product launches and product features and playability, such those that may arise from (i) difficulties or delays in using its product development personnel in Russia due to the Russia invasion of Ukraine and the related sanctions and/or more restrictive sanctions rendering transacting in the region more difficult or costly or military actions in other parts of the world that may strain global labor and supply chain resources and contribute to even higher inflation levels; (ii) difficulties and/or delays arising out of any resurgence of the ongoing and prolonged COVID-19 pandemic; (iii) difficulties, delays or less than expected results in achieving the Company’s growth plans, strategies, objectives and expectations, such as due to (A) a slower than anticipated economic recovery; (B) the Company’s inability, in whole or in part, to continue to execute its business strategies and plans, such as due to less than anticipated customer acceptance of the Company’s new game titles, the Company’s experiencing difficulties or the inability to launch its games as planned, less than anticipated performance of the games impacting customer acceptance and sales and/or greater than anticipated costs and expenses to develop and launch its games, including, without limitation, higher than expected labor costs and less than expected access to liquidity on terms acceptable to the Company, or at all, whether due to the Company’s continuing financial condition and/or difficulties or delays in obtaining additional debt and/or equity financing to meet its liquidity requirements financing; and/or (iv) adverse economic, market and geopolitical conditions that negatively impact industry trends, such as significant changes in the labor markets, an extended or higher than expected inflationary environment (such as the impact on consumer discretionary spending as a result of significant increases in energy and gas prices which have been increasing since early in 2020), a higher tax rate and interest rate environment impacting consumer discretionary spending. Factors other than those referred to above could also cause Motorsport Games’ results to differ materially from expected results. Additional examples of such risks and uncertainties include, but are not limited to: (i) Motorsport Games’ ability (or inability) to maintain existing, and to secure additional, licenses and other agreements with various racing series; (ii) Motorsport Games’ ability to successfully manage and integrate any joint ventures, acquisitions of businesses, solutions or technologies; (iii) unanticipated operating costs, transaction costs and actual or contingent liabilities; (iv) the ability to attract and retain qualified employees and key personnel; (v) adverse effects of increased competition; (vi) changes in consumer behavior, including as a result of general economic factors, such as increased inflation, higher energy prices and higher taxes and interest rates; (vii) Motorsport Games’ ability to protect its intellectual property; and/or (viii) local, industry and general business and economic conditions. Additional factors that could cause actual results to differ materially from those expressed or implied in the forward-looking statements can be found in Motorsport Games’ filings with the Securities and Exchange Commission (the “SEC”), including its Annual Report on Form 10-K for the fiscal year ended December 31, 2021, its Quarterly Reports on Form 10-Q filed with the SEC during 2022, as well as in its subsequent filings with the SEC. Motorsport Games anticipates that subsequent events and developments may cause its plans, intentions and expectations to change. Motorsport Games assumes no obligation, and it specifically disclaims any intention or obligation, to update any forward-looking statements, whether as a result of new information, future events or otherwise, except as expressly required by law. Forward-looking statements speak only as of the date they are made and should not be relied upon as representing Motorsport Games’ plans and expectations as of any subsequent date. Additionally, the business and financial materials and any other statement or disclosure on, or made available through, Motorsport Games’ website or other websites referenced or linked to this press release shall not be incorporated by reference into this press release.
Website and Social Media Disclosure:
Investors and others should note that we announce material financial information to our investors using our investor relations website (ir.motorsportgames.com), SEC filings, press releases, public conference calls and webcasts. We use these channels, as well as social media and blogs, to communicate with our investors and the public about our company and our products. It is possible that the information we post on our websites, social media and blogs could be deemed to be material information. Therefore, we encourage investors, the media and others interested in our company to review the information we post on the websites, social media channels and blogs, including the following (which list we will update from time to time on our investor relations website):