The Ultimate Guide to Stock Market News
When stocks make sharp price moves, the natural inkling is to search for any news that may be driving the volatility. It’s just human nature to try to explain what is causing the action. Since news comes out all hours of the day, it can be overwhelming trying to filter and determine what impact if any can be attributable to specific price moves. For this reason, it’s important for traders to optimize their time and efforts when analyzing stock market news.
Types of Stock Market News
Not all news applies to all stocks. Being selective is possible once you understand the different types of stock market news and the potential for making a material impact on stock prices. It helps to categorize news items to quickly filter through the noise and get to the “meat”. Here are some general categories and specifics of how they can impact the underlying stocks.
Company Press Releases
These are official news items announced by the company through press releases which get distributed through the various newswires and media outlets. Not all press releases make a material impact on share prices. A lot of them are just fluff and have no bearing on immediate price action. Here are the more significant types of press releases to pay attention to:
Earnings Releases are the most significant and material press releases. These are usually reported four times a year, represent quarterly performance results and potential forward guidance.
The Fourth-Quarter Release is often combined with the annual report which sums up the cumulative performance of the company for the year. Earnings releases are binary events that can cause share prices to gap up or down in the after-hours and often generate heavy relative volume the following trading day.
The focus on whether the company beat or missed the analyst forecasts for earnings-per-share (EPS) and revenues for the recent quarter as well as color on forward-guidance can determine which way the stock price gaps. However, the price reaction can be swayed by different selected metrics that may have improved or devolved during the quarter (IE: monthly average users (MAUs)). The key is not to predict or explain the results but to trade the reaction.
Deal News
Companies often issue press releases pertaining to deals. These can pertain to winning large business contracts or forming partnerships with other companies. The impact on stock prices relies on how large the contracts are relative to current revenues.
Partnerships with large halo companies can help boost share prices just from the association. Companies that acquire smaller companies can result in falling stock prices from the potential dilution of shares unless the deal is accretive or plays into a consolidation theme where market share will improve dramatically. Companies can also get a spike in share prices when they issue a press release stating they are “exploring strategic alternatives to raise shareholder value” or hire an investment banker, which implies the potential for putting itself up for sale.
Product Launches
These types of press releases don’t impact shares too much unless it’s something that wasn’t anticipated. Announcing the next upgrade cycle of products is something that is usually anticipated and factored into share prices ahead of the actual launch date. However, when a company schedules a launch event ahead of time, it can become a binary event causing shares to rise into the launch event and promptly sell-off when news is released.
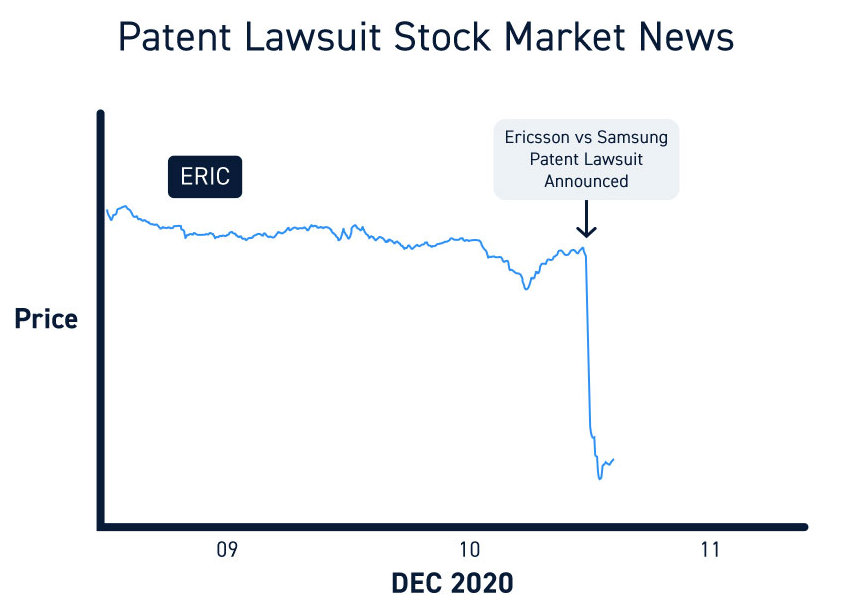
Legal Rulings
These press releases can be significant if the lawsuits relate to the core business or intellectual property (IP) patents. Oftentimes, patent lawsuits result in a settlement or ongoing royalties which can have a significant material impact on the bottom line. This is of course assuming both parties agree to a settlement and not continuing to pursue appeals.
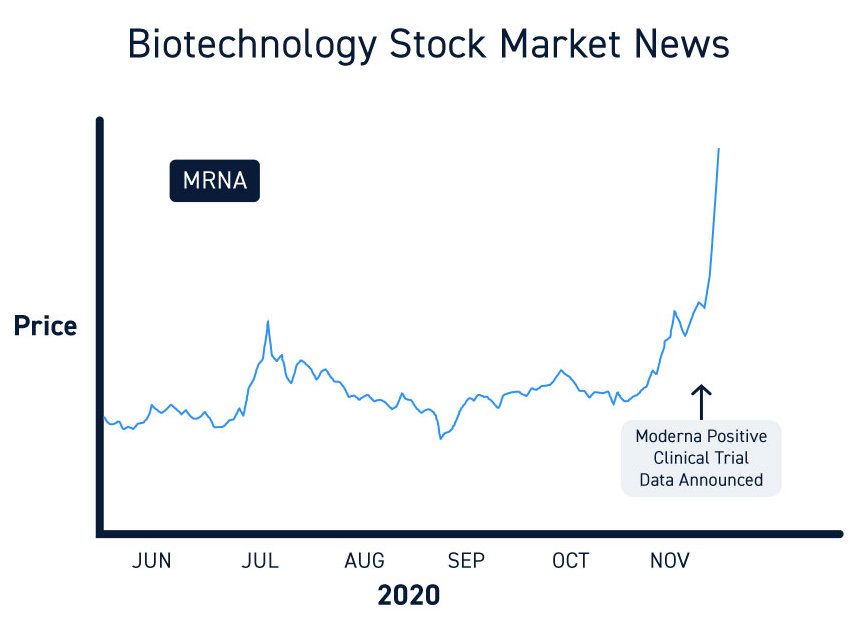
Clinical Trials and FDA Decisions
These are very material to biotechnology and pharmaceutical companies with costly drug pipelines. Positive clinical trial data can surge share prices whereas negative trial results can tank shares. FDA approvals which are often preceded by FDA advisory panel decisions can also impact shares significantly. Be aware that an FDA Response Letter is usually a request for more information, which can initially tank share prices since it often implies having to initiate more clinical trials that take more time to see the drug through approval if it can be approved.
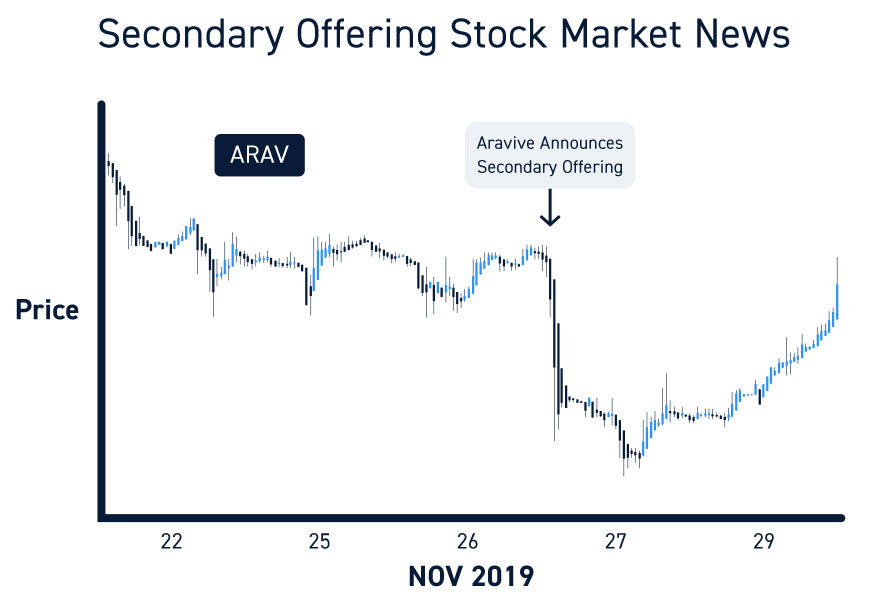
Secondary Offerings
When a company decides to raise funds in the equity markets, it can file for a secondary offering. Usually, these types of press releases cause stock prices to fall in anticipation of share dilution for existing shareholders. Stocks often tend to rise in a “peculiar” manner ahead of the secondary offering news and promptly fall afterward. After the completion of the offering, the company may issue another press release stating a successful offering and even provide pricing details. The pricing details can eventually form a theoretical “floor” for the stock.
Opinion Pieces
As they say, everyone has an opinion. In the financial markets, some opinions are more important than most. It’s important to distinguish an opinion versus actual company news. Opinions range from impactful analyst upgrades/downgrades to newsletters and paid promotions to social media posts.
Paid Promotions are sneaky press releases often distributed by a third-party that’s tilted towards lifting a company’s share price. Many companies will hire marketing firms that specialize is “awareness campaigns” to promote the company’s prospects in an effort to lift its share prices. The resulting price “pump” is often temporary and tends to “dump” after the promotion campaign is completed. Low-priced micro-cap stocks are notorious for pump and dump price action and best to avoid these companies and stick to nationally listed companies on the NYSE, NASDAQ or AMEX exchanges.
Short Activism is performed through newsletters, research reports, or websites operated by short-sellers that profit from falling prices in the underlying shares. Many of these short-sellers seek to expose companies for fraudulent and/or questionable practices with the intent of causing prices to collapse. While not all short activism may be accurate, some of the best-known short-sellers have gained notoriety for exposing very real frauds that ultimately trigger financial market regulators to further investigate. Be aware that short-sellers derive their income from falling share prices so options will be negatively biased.
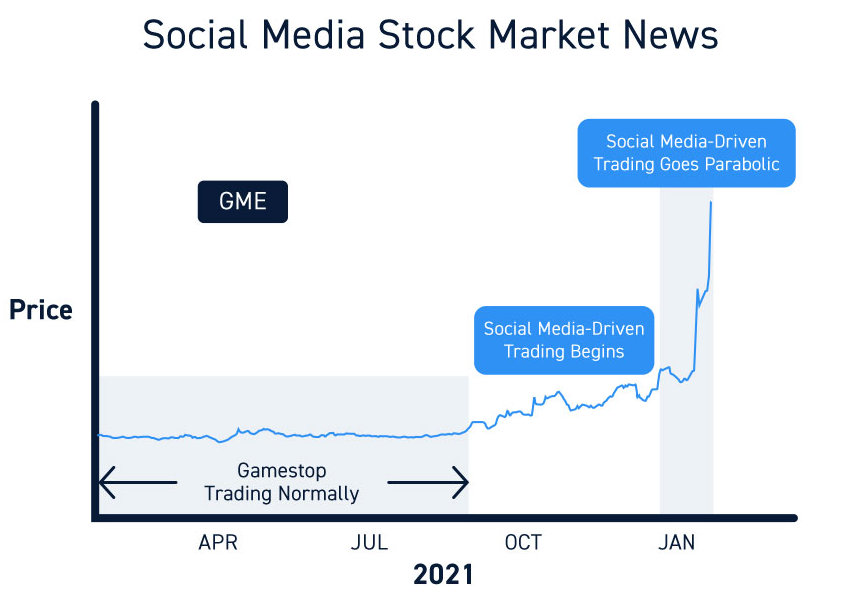
Social Media is a popular platform where certain posters can have an impact on share prices. It’s prudent to be skeptical and do your own analysis and research before taking any posts too seriously. Many short-sellers have large social media followings which can impact near-term share prices but can also result in getting squeezed on reversions if timing is off.
Industry and Market News
These are general financial news items that report on economic data, sector and industry trends. They impact on a macro market level often causing S&P 500 futures prices to react which then impacts the underlying stock prices. These can be distributed via news wires, a government organization, or on financial networks.
Government Economic Reports
These are government-issued reports that highlight specific economic data. The unemployment report can be significant based on how well it beats or misses estimates. Press releases from the Federal Reserve carry significant impact as monetary policy and the narrative provided triggers immediate reaction in the S&P 500 futures and then drives the trend.
Sector and Industry Reports
Reputable research firms release sector and industry reports that can impact companies within those categories. For example, if a gaming association reports the trend of video game sales trends doubling during the holidays, it can impact the shares of video game stocks.
News Sources
Financial news is disseminated through a number of sources. The type of news can range from general to company-specific based on the underlying news sources. Here’s a breakdown of the sources and where news can be pulled.
Newswires are a direct source of financial news and press releases. Most trading platforms have news feeds connected to some of the most popular newswires. The main difference between newswires is the speed at which company news is distributed and the depth of news that can be pulled.
News Aggregators are free sources that traders can refer to get company-specific news. These can range from search engines to social media sites, but can require manually filtering through advertisements, paid promotions, and various other “noise”.
Trading Platforms can be used to pull relevant news items to the trader. General news items tend to be accessible through conventional trading broker platforms. When you want to filter for company, theme, keyword news items, a direct market access (DMA) trading platform is a prudent choice for relevancy, speed, and being able to link alerts.
News Scanners are usually subscription services that filter through general financial news to alert subscribers to “tradeable” and relevant news that can materially impact stock prices. These are premium services that tailor its news towards traders and investors.
Considerations for Trading the News
So now that you have access to stock market news and can immediately access it to find the underlying catalyst driving stock prices, how do you trade it? First of all, make sure you have a firm trading methodology. The news may be a catalyst, but managing the trade relies on preparation and prudent execution of a sound game plan. Here are some things to keep in mind
Focus on The News and Market Reaction
Based on the aforementioned types of news, be sure to categorize the news to gauge its significance. The material impact of the news is evident in the price reaction. If the reaction is large, then it’s materially significant (IE: earnings release and raised guidance). Don’t try to rationalize the news.
Consider the News Itself
Ask yourself some quick questions when reading the news.
Is the news accurate? Check the source. If it’s a company press release then likely so, if it’s an opinion from a short-seller research report, then be skeptical.
Does it have a material impact on the company? If it’s a patent ruling and ongoing royalty settlement that adds 25% more revenues to the bottom line, then yes. If it’s a minor legacy product upgrade, then probably not.
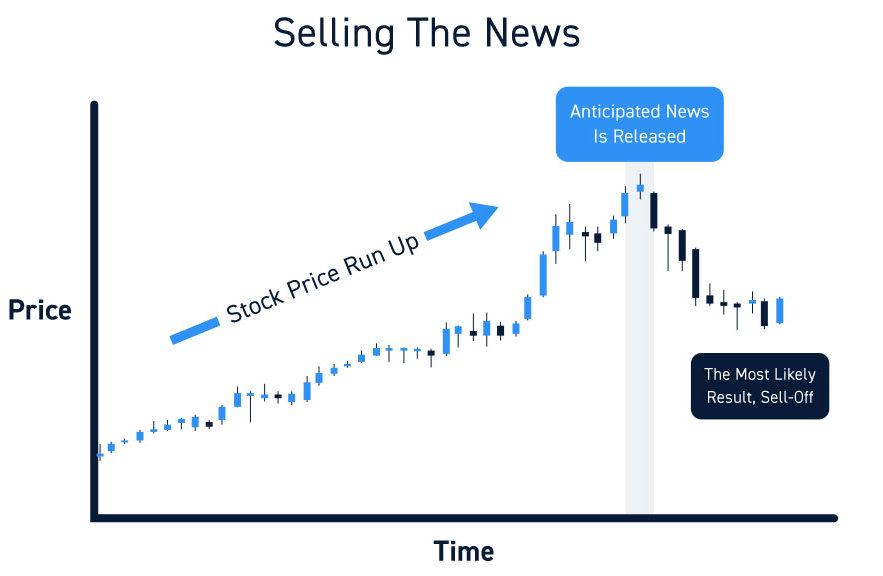
Was the news expected? If the news was a surprise contract win with a major social media platform using the product, then yes. If the news was the launch of a next-gen mobile phone with all the features prominently detailed ahead of the event, then watch out for a sell the news reaction.
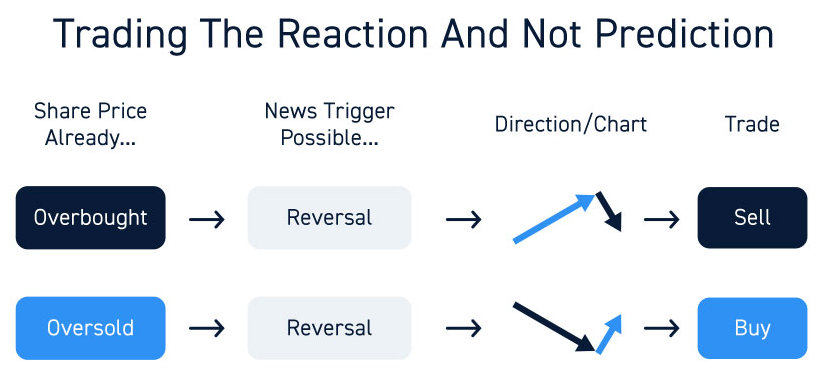
Consider the Reaction
When it comes to analyzing the significance of news, too many traders make the mistake of trying to game or rationalize the price reaction. Rather than fight the reaction, accept it and game plan trading the reaction and not prediction. Ask yourself if the market has already reacted in anticipation of the news. Are share prices already overbought or are they oversold? If oversold, then the news could be a catalyst to trigger a reversal enabling a first-person advantage to get into position. If overbought, then the news could trigger a sell-off.
Sell the New Reactions
When anticipated and expected news is release following a stock price run-up, the resulting reaction can be a sell-off. While this can take many traders by surprise, the reality is that when full transparency is unveiled, there are more sellers than buyers. This can be obvious by watching the magnitude of the price gains ahead of news releases to gauge if it’s too late to chase.
Prepare a Trading Game Plan
After analyzing the news and the market reaction, prepare your trading game plan implementing a trading methodology. If the news generates an overextended move, then target the most solid support or resistance levels to consider scaling into a position and setting stop-loss levels. The market isn’t always right in the near-term. Oftentimes, an initial reaction can provide opportunities for longer trends. For example, if a company reports a weak earnings miss, causing shares to drop but upgrades its next quarter’s forecast, you may watch for entry levels in anticipation of a reversion bounce.
In conclusion, keep in mind that news is often a laggard catalyst. If it’s made the news, then it’s already happened. Don’t impulse trade headlines and don’t try to justify or rationalize the price reaction with the news. Accept that the reaction can diverge from the anticipated reaction. Be flexible and disciplined in preparing and executing your trading plan when trading the news.
Reprinted with permission from Centerpoint Securities
Suggested Reading:
Special Thanks to CenterPoint Securities for use of this article.

CenterPoint Securities is a direct market access broker catering to active, sophisticated traders and those striving to be full-time traders.