Schwazze (SHWZ) – Continuing to Build a Leading Regional MSO

Monday, May 23, 2022

Schwazze (SHWZ)
Continuing to Build a Leading Regional MSO

Schwazze (OTCQX:SHWZ, NEO:SHWZ) is building a premier vertically integrated regional cannabis company with assets in Colorado and New Mexico and will continue to take its operating system to other states where it can develop a differentiated regional leadership position. Schwazze is the parent company of a portfolio of leading cannabis businesses and brands spanning seed to sale. The Company is committed to unlocking the full potential of the cannabis plant to improve the human condition. Schwazze is anchored by a high-performance culture that combines customer-centric thinking and data science to test, measure, and drive decisions and outcomes. The Company’s leadership team has deep expertise in retailing, wholesaling, and building consumer brands at Fortune 500 companies as well as in the cannabis sector. Schwazze is passionate about making a difference in our communities, promoting diversity and inclusion, and doing our part to incorporate climate-conscious best practices.

Joe Gomes, Senior Research Analyst, Noble Capital Markets, Inc.

Joshua Zoepfel, Research Associate, Noble Capital Markets, Inc.

Refer to the full report for the price target, fundamental analysis, and rating.

1Q22 Results. Revenue for the quarter totaled $31.8 million, up from $26.5 million in the fourth quarter and $19.3 million a year ago. The increase was mostly due to acquisitions as the Colorado market continued to experience softness from the 2021 COVID highs. Adjusted EBITDA was $7.9 million in the quarter. Schwazze reported an operating loss of $4.8 million and a net loss of $28.5 million, or $0.61 per share. We had forecast revenue of $35 million and net income of $1.7 million, or $0.03 per share.

One-Time Items Impact Results. First quarter 2022 COGS was impacted by $6.3 million of purchase accounting on acquisitions, compared to $2.2 million in the year ago period. One-time costs associated with acquisitions totaled $2.8 million. Below the line, results were impacted by $13.4 million of unrealized loss on derivative liabilities and a y-o-y increase in interest expense to $7.3 million from $961,282 in 1Q21.

This Company Sponsored Research is provided by Noble Capital Markets, Inc., a FINRA and S.E.C. registered broker-dealer (B/D).

*Analyst certification and important disclosures included in the full report. NOTE: investment decisions should not be based upon the content of this research summary. Proper due diligence is required before making any investment decision. 

Stem Holdings, Inc. (STMH) – Reports Fiscal 2Q22 Operating Results

Monday, May 23, 2022

Stem Holdings, Inc. (STMH)
Reports Fiscal 2Q22 Operating Results

Stem is a multi-state, vertically integrated, cannabis company that, through its subsidiaries and its investments, is engaged in the cultivation, processing, packaging, distribution and branding of cannabis, hemp and their derivatives, including oils, edibles, concentrates. Additionally, the Company purchases, improves, leases, operates, and invests in properties for use in the production, distribution and sales of cannabis and cannabis-infused products licensed under the laws of the states of Oregon, Nevada, California, Massachusetts, and New York. As of December 31, 2021, Stem had ownership interests in 24 state-issued cannabis licenses including nine (9) licenses for cannabis cultivation, three (3) licenses for cannabis processing, two (2) licenses for cannabis wholesale distribution, three (3) licenses for hemp production and seven (7) cannabis dispensary licenses.

Joe Gomes, Senior Research Analyst, Noble Capital Markets, Inc.

Joshua Zoepfel, Research Associate, Noble Capital Markets, Inc.

Refer to the full report for the price target, fundamental analysis, and rating.

2QFY22 Results. Stem reported net revenue of $4.1 million compared to $5.5 million last year. The sales decline reflects a decrease in sales resulting from general market conditions. Stem reported a net loss of $3.5 million, or $0.02 per share, for the quarter. In the same period last year, Stem recorded a net loss of $8.6 million, or $0.06 per share. Outstanding shares increased to 223.7 million from 137.8 million. We had projected revenue of $4.2 million and a net loss of $4.0 million, or $0.02 per share. 

Segments. While the wholesale business saw a modest increase year-over-year, retail revenue declined to $3.2 million from $6.0 million year-over-year. We attribute the drop to a combination of a soft overall cannabis market and Stem’s ongoing restructuring of its Oregon operations.

This Company Sponsored Research is provided by Noble Capital Markets, Inc., a FINRA and S.E.C. registered broker-dealer (B/D).

*Analyst certification and important disclosures included in the full report. NOTE: investment decisions should not be based upon the content of this research summary. Proper due diligence is required before making any investment decision. 

BioSig Technologies (BSGM) – 1Q Short Of Expectations But Signal Strength Improving

Monday, May 23, 2022

BioSig Technologies (BSGM)
1Q Short Of Expectations But Signal Strength Improving

BioSig Technologies is a medical technology company commercializing a proprietary biomedical signal processing platform designed to improve signal fidelity and uncover the full range of ECG and intra-cardiac signals (www.biosig.com). The Company’s first product, PURE EP(TM) System is a computerized system intended for acquiring, digitizing, amplifying, filtering, measuring and calculating, displaying, recording and storing of electrocardiographic and intracardiac signals for patients undergoing electrophysiology (EP) procedures in an EP laboratory.

Gregory Aurand, Senior Research Analyst, Healthcare Services & Medical Devices, Noble Capital Markets, Inc.

Refer to the full report for the price target, fundamental analysis, and rating.

Company filed 1Q 2022. Last week BioSig released its 10-Q for 1Q 2022.  The company recorded no PURE EP unit sales in the quarter, below our expectations of three units.  The Company received strong signals from facilities, but contracts were not signed by the end of the quarter. We expect agreements in the second quarter.  Total expenses, reduced by overhead reduction, ran higher than our expected levels as the company added back staff as part of its commercial buildout and official June 1st rollout. 

ATM agreement filed. In preparation for the commercial buildout for PURE EP, and general corporate purposes, BioSig also filed an At-The-Market (ATM) agreement for up to $10 million in common stock. We had expected a capital raise in the second half of 2022.

This Company Sponsored Research is provided by Noble Capital Markets, Inc., a FINRA and S.E.C. registered broker-dealer (B/D).

*Analyst certification and important disclosures included in the full report. NOTE: investment decisions should not be based upon the content of this research summary. Proper due diligence is required before making any investment decision. 

Release – Ocugen Announces FDA Removes Clinical Hold on Phase 2/3 Clinical Trial for COVAXIN (BBV152)


Ocugen Announces FDA Removes Clinical Hold on Phase 2/3 Clinical Trial for COVAXIN™ (BBV152)

Research, News, and Market Data on Ocugen


DOSING TO RESUME
IMMEDIATELY

MALVERN, Pa., May 23, 2022 (GLOBE NEWSWIRE) — Ocugen, Inc. (NASDAQ: OCGN), a biotechnology company focused on discovering, developing, and commercializing novel gene therapies, biologicals, and vaccines, today announced that the U.S. Food and Drug Administration (FDA) lifted the clinical hold on the Company’s Phase 2/3 clinical trial, OCU-002, for COVAXIN™ (BBV152).

“We’re extremely pleased that we can proceed with our clinical trials for COVAXIN™, our whole virus inactivated COVID-19 vaccine candidate. The need for delivering an additional, differentiated vaccine option, we believe, remains a priority,” said Dr. Shankar Musunuri, Chairman, CEO and Co-Founder, Ocugen, Inc. “Thank you to our clinical trial partners and site collaborators for their ongoing support. Ocugen will now work with study sites to fully resume this clinical development program immediately.”

People interested in learning about how to participate in this clinical
trial (NCT05258669) can visit the clinical trials section of Ocugen.com.

About
COVAXIN™ (BBV152)

COVAXIN™ (BBVI52) is an investigational vaccine candidate product in the U.S. It was developed by Bharat Biotech in collaboration with the Indian Council of Medical Research (ICMR) – National Institute of Virology (NIV). COVAXIN™ (BBV152) is a highly purified and inactivated vaccine that is manufactured using a vero cell manufacturing platform.

With more than 350 million doses having been administered to adults outside the U.S., COVAXIN™ is currently approved for adults in India and authorized under emergency use in 25 countries. Applications for emergency use authorization are pending in more than 60 other countries. COVAXIN™ is listed by the World Health Organization (WHO) as authorized for emergency use. And, as many as 110 countries have agreed to mutual recognition of COVID-19 vaccination certificates with India that includes vaccination using COVAXIN™. The trade name, COVAXIN™, has not been evaluated by the FDA.

About
Ocugen, Inc.

Ocugen, Inc. is a biotechnology company focused on discovering, developing, and commercializing novel gene therapies, biologicals and vaccines that improve health and offer hope for people and global communities. We are making an impact through courageous innovation, taking science in new directions in service of patients. Our breakthrough modifier gene therapy platform has the potential to treat multiple diseases with one drug and we are advancing research in other therapeutic areas to offer new options for people with unmet medical needs. Discover more at www.ocugen.com and follow us on Twitter and LinkedIn.

Cautionary
Note on Forward-Looking Statements

This press release contains forward-looking statements
within the meaning of The Private Securities Litigation Reform Act of 1995,
which are subject to risks and uncertainties. Ocugen may, in some cases, use
terms such as “predicts,” “believes,” “potential,” “proposed,” “continue,”
“estimates,” “anticipates,” “expects,” “plans,” “intends,” “may,” “could,”
“might,” “will,” “should,” or other words that convey uncertainty of future
events or outcomes to identify these forward-looking statements. Such forward-looking
statements include, but are not limited to, statements about Ocugen’s intention
to 
begin dosing patients in its Phase 2/3 immune-bridging and broadening trial for COVAXIN™ in the coming weeks, and are
subject to risks and uncertainties that could cause actual results to differ
materially from those expressed or implied by such statements, including, among
other things, the uncertainties inherent in research and development, including
the ability to meet anticipated clinical endpoints, ability to timely enroll
clinical trial participants, commencement and/or completion dates for clinical
trials, regulatory submission dates, regulatory approval dates and/or launch
dates; the risk that Health Canada does not accept its New Drug Submission
(“NDS”) for COVAXIN™ or that Ocugen may not be able to adequately resolve the
deficiencies noted by Health Canada with respect to its NDS, for which Ocugen
has provided responses that are currently under review by Health Canada; the
risk that Ocugen may not be able to successfully commercialize COVAXIN™ in
Mexico for adults over the age of 18 pursuant to Ocugen’s agreement with Bharat
Biotech and the risk that Ocugen does not obtain emergency pediatric use for
COVAXIN™ in Mexico for children between two and 18 years of age on a timely
basis, if at all; the risk that Ocugen’s Phase 2/3 immuno-bridging and
broadening clinical trial for COVAXIN™ is not completed on a timely basis, if
at all; or that the U.S. Food and Drug Administration places a new clinical
hold on such trial in the future, for any reason; risks associated with
preliminary and interim data, including the possibility of unfavorable new
clinical trial data and further analyses of existing clinical trial data; the
risk that the results of in-vitro studies will not be duplicated in human
clinical trials; the risk that clinical trial data is subject to differing
interpretations and assessments, including during the peer review/publication
process, in the scientific community generally, and by regulatory authorities;
whether and when data from Bharat Biotech’s clinical trials will be published
in scientific journal publications and, if so, when and with what
modifications; whether the data and results from the preclinical and clinical
studies of COVAXIN™, which have been conducted by Bharat Biotech in India, will
be accepted by regulatory authorities or otherwise sufficient to support
Ocugen’s submissions for regulatory approvals or authorizations in the United
States, Canada or Mexico; the size, scope, timing and outcome of any additional
clinical trials or studies that Ocugen may be required to conduct to support
regulatory approvals or authorizations; any additional chemistry,
manufacturing, and controls information that Ocugen may be required to submit
to regulatory authorities ; whether and when a Biologics License Application
for COVAXIN™ will be submitted to or approved by the FDA; the risk that Ocugen
may not be able to successfully negotiate and execute definitive transaction
agreements for the acquisition of the manufacturing site on acceptable terms,
if at all, and the ultimate terms and timing for closing of the transactions
contemplated thereby; the risk that Ocugen will not be able to successfully
close the acquisition of the manufacturing site; risks associated with the
planned development and refurbishing of the manufacturing site, including that
the expected costs for such development may be greater than currently
contemplated or that the planned development may take longer than expected or
fail to be completed on a timely basis, if at all; and the risk that Ocugen
will not be able to scale production for such manufacturing site to adequately
support manufacturing of its product candidates or the other products that may
in the future be manufactured at such manufacturing site; whether developments
with respect to the COVID-19 pandemic will affect the regulatory pathway
available for vaccines in the United States, Canada, Mexico or other
jurisdictions; market demand for COVAXIN™ in the United States, Canada or
Mexico; decisions by the regulatory authorities impacting labeling,
manufacturing processes, safety and/or other matters that could affect the
availability or commercial potential of COVAXIN™ in the United States, Canada
or Mexico, including development of products or therapies by other companies
. Such
 statements are subject to numerous
important factors, risks and uncertainties that may cause actual events or
results to differ materially from our current expectations, such as market and
other conditions. These and other risks and uncertainties are more fully
described in our periodic filings with the Securities and Exchange Commission
(the “SEC”), including the risk factors described in the section entitled “Risk
Factors” in the quarterly and annual reports that we file with the SEC. Any
forward-looking statements that we make in this press release speak only as of
the date of this press release. Except as required by law, we assume no
obligation to update forward-looking statements contained in this press release
whether as a result of new information, future events or otherwise, after the
date of this press release.

Ocugen
Contact:

Ken Inchausti
Head, Investor Relations & Communications
ken.inchausti@ocugen.com

Please submit investor-related inquiries to: IR@ocugen.com


Release – Bowlero Corp Announces Agreement to Acquire Three Bowling Centers in Wichita, Kansas


Bowlero Corp Announces Agreement to Acquire Three Bowling Centers in Wichita, Kansas

Research, News, and Market Data on Bowlero

05/23/2022

Bowlero Corp to expand in the state of Kansas

NEW YORK, May 23, 2022 (GLOBE NEWSWIRE) — Bowlero Corp. (“Bowlero” or the “Company”), the world’s largest owner and operator of bowling centers, as well as the owner of the Professional Bowlers Association (PBA), announced today that it had entered into an agreement to acquire three bowling centers in Wichita, Kansas – Northrock Lanes, West Acres Bowling Center and The Alley Indoor Entertainment, expanding the company’s footprint in the state to four locations.

Northrock Lanes, one of the three locations, is the largest bowling center in the state of Kansas and is located at 3232 N Rock Road. This center features 48 lanes, an interactive arcade, a banquet hall that fits more than 120 guests, a sports grill and snack bar.

The second location, West Acres Bowling Center is located at 749 N Ridge Road. This center features 36 lanes, cosmic bowling, an on-site pro shop and a full-service bar.

The third center, The Alley Indoor Entertainment, is located at 11413 E 13th Street N. This center is equipped with 32 lanes, indoor electric go karts, a Laser Maze, an interactive arcade, virtual reality, a sports grill and an escape room.

“Bowlero Corp is committed to delivering a world class bowling experience to the guests we serve each year and we’re thrilled to welcome these three new centers to our portfolio,” said Tom Shannon, Chairman and CEO of Bowlero Corp.

The three locations will officially operate under Bowlero Corp management upon completion of the acquisition, introducing new offers and exclusive promotions to the centers from Bowlero. The acquisition is expected in the next three months.

About Bowlero Corp
Bowlero Corp. is the worldwide leader in bowling entertainment, media, and events. With more than 300 bowling centers across North America, Bowlero Corp. serves more than 26 million guests each year through a family of brands that includes Bowlero, Bowlmor Lanes, and AMF. In 2019, Bowlero Corp. acquired the Professional Bowlers Association, the major league of bowling, which boasts thousands of members and millions of fans across the globe. For more information on Bowlero Corp., please visit BowleroCorp.com.

For Media:
Bowlero Corp. Public Relations
pr@bowlerocorp.com  

For Investors:
ICR, Inc.
Ryan Lawrence
Ryan.Lawrence@icrinc.com

Ashley DeSimone
Ashely.desimone@icrinc.com


Companies Dialing Up Gains and Delivering to their Stockholders


Image Credit: freestocks.org (Flickr)


Not all Big Stock Market Gainers are Headline News, These Two Have Quietly Excelled This Year

This year has been tricky for investors and risky for savers. Inflation is taking away buying power at a rate of 8% or more, while market indexes have sunk by double that amount. Whether you’re young and looking to be prudent and build for the future, or you’re a baby boomer trying to stay even, whether you’re in the market or out, you can wind up worse off.  

During this year’s S&P 500 decline there have been sectors that have stayed strong. Within those sectors, there are particularly decent performers. Everyone knows the energy sector has been a highflyer, but the reasons for this could reverse, remember it was recently the worst-performing sector. But outside of the energy industry, there are a few media companies that have performed exceptionally well even though the market has been bearish. If the overall market turns bullish, there is no reason to expect their performance to reverse.

Two companies that are in very different businesses in the media space caught my attention. One is a 99-year-old company that began in print media, and the other is one of the largest owners of radio stations. Both would seem to be old school companies, but they aren’t run that way, and the stocks are well in the positive so far this year.  


Cumulus Media (CMLS)

Cumulus Media (CMLS) is an audio-first media company that provides premium content to over a quarter billion people every month. It’s among the largest owners of radio stations in the United States. Perhaps you’ve heard of the groups it operates including Radio Station Group and Westwood One. It sells commercial advertising time to local, regional, and national advertisers; and network advertising. The company offers content through approximately 445 owned-and-operated stations in 90 United States media markets; and approximately 8,000 broadcast radio stations affiliates and various digital channels. Cumulus Media Inc. was founded in 1997 and is based in Atlanta, Georgia.


Source: Koyfin

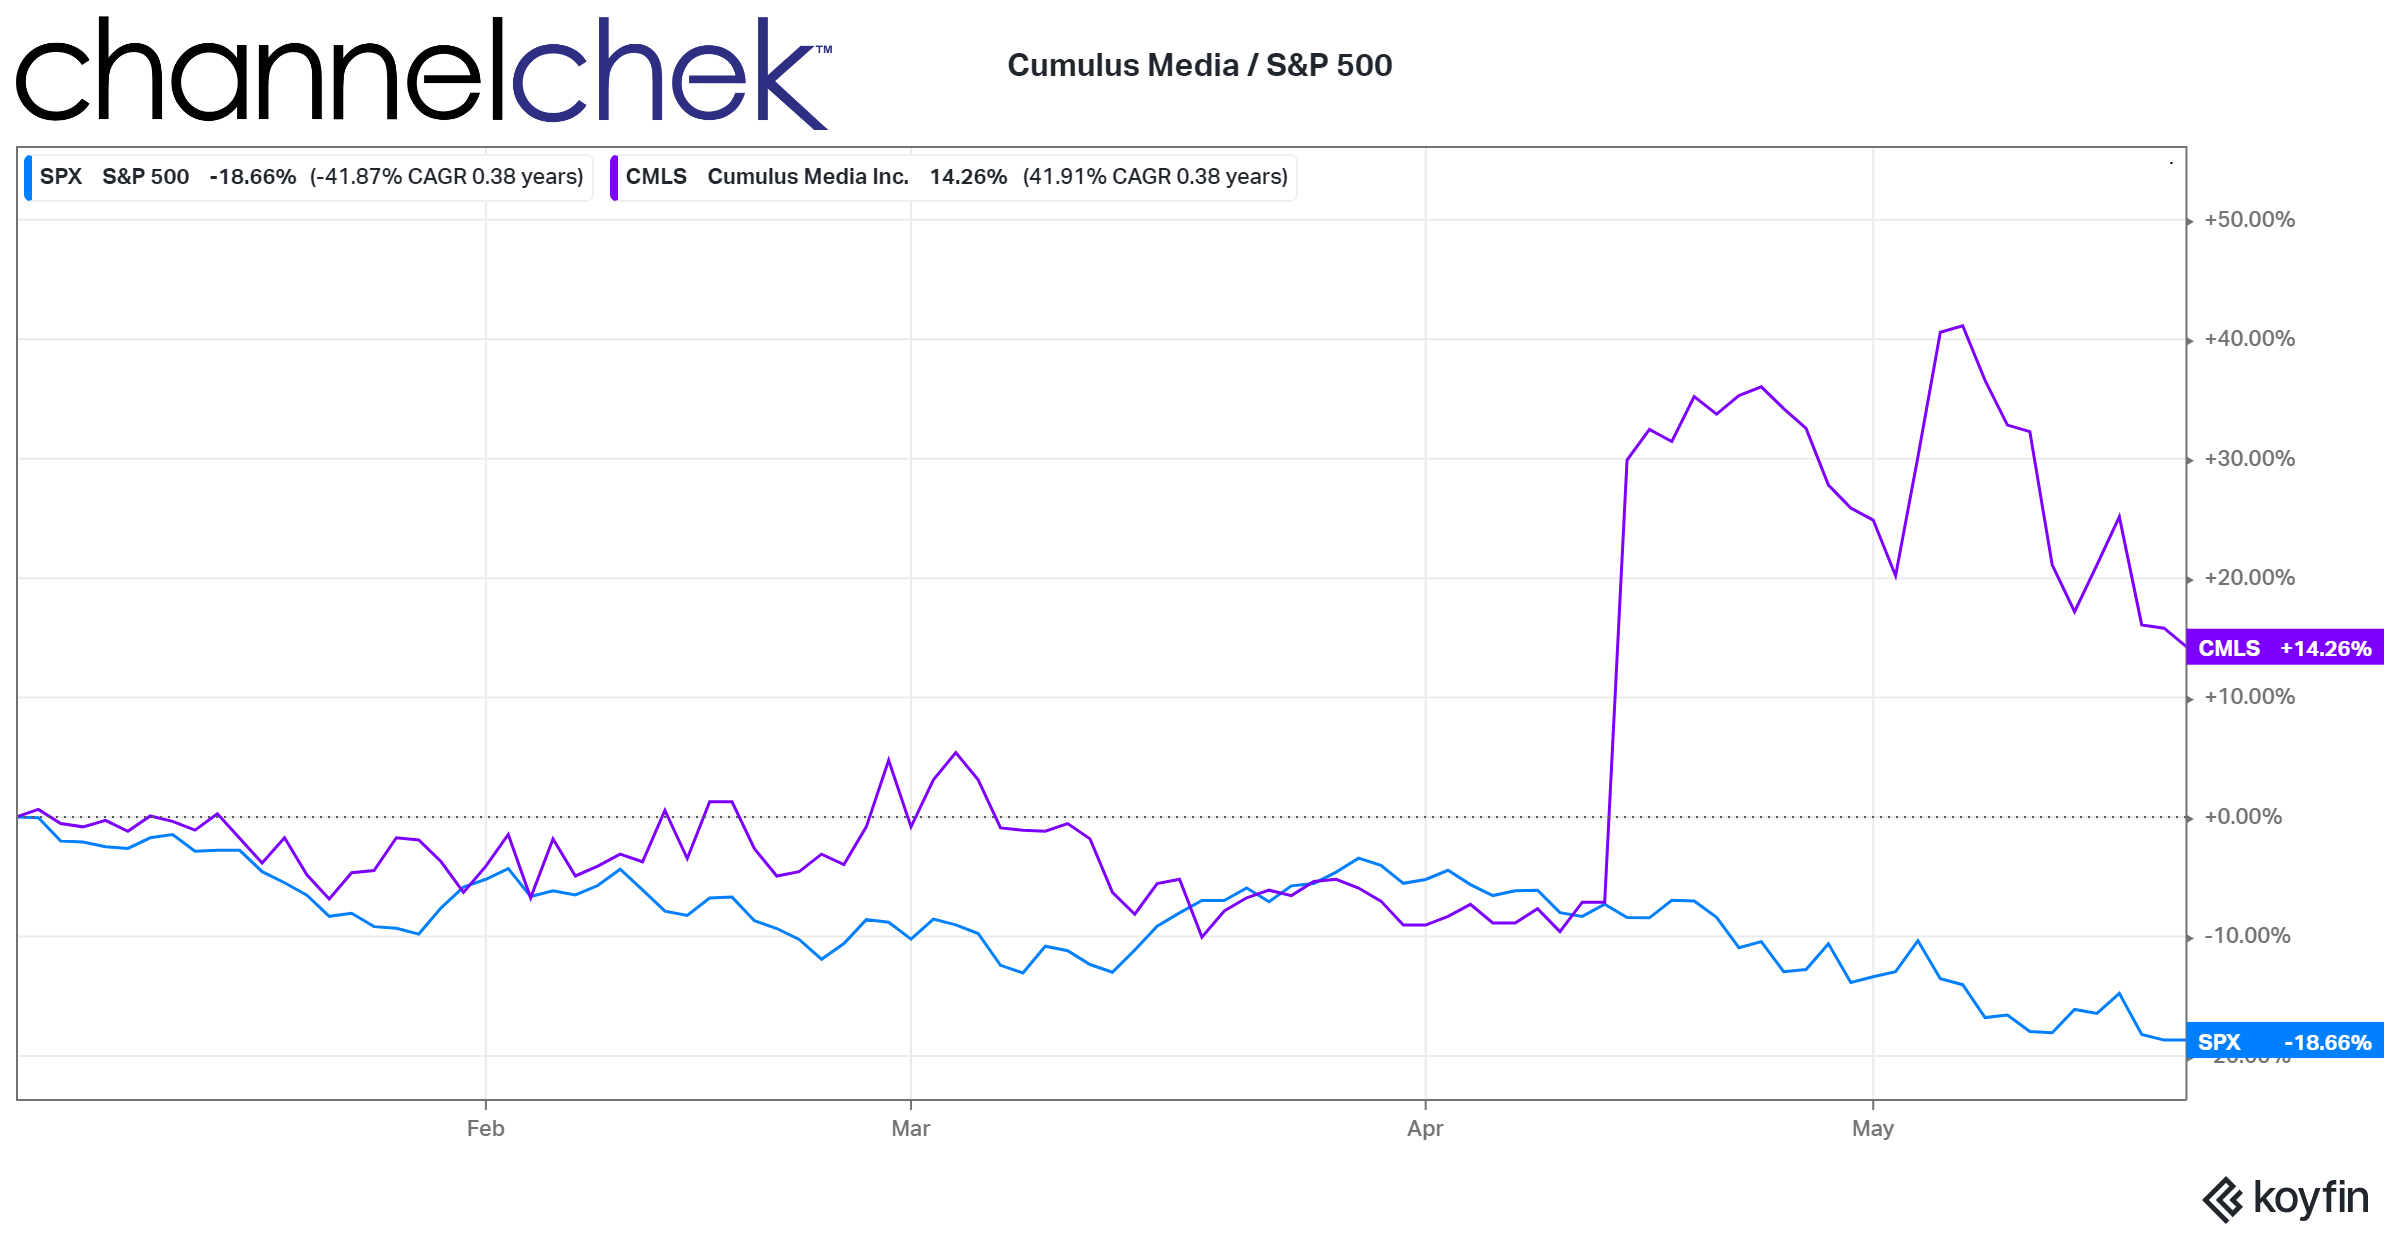
Since the beginning of the year, the company has beaten the S&P 500 by more than 32%. Cumulus is in the process of conducting a Dutch auction to tender up to $25 million shares. According to a research report released by Noble Capital markets earlier this month, the move could position CMLS to be part of the Russell 3000 which would provide it with more natural holders. Read the research report here.

Harte Hanks

Harte Hanks (HHS) has been around for 99 years. While they sold the Pennysaver brand back in 2013, connecting business to business and business to customers is what they have always excelled at. Today their business is split into thirds, with one-third marketing to generate interest for other companies (B2B, B2C), another third that is a customer care business which primarily serves to answer customer concerns and chat, and the final third is a customer fulfillment business that takes orders and fulfills them in a B2B capacity. These three segments provide unparalleled service and function synergistically to leverage multiple segments and drive better outcomes for customers.

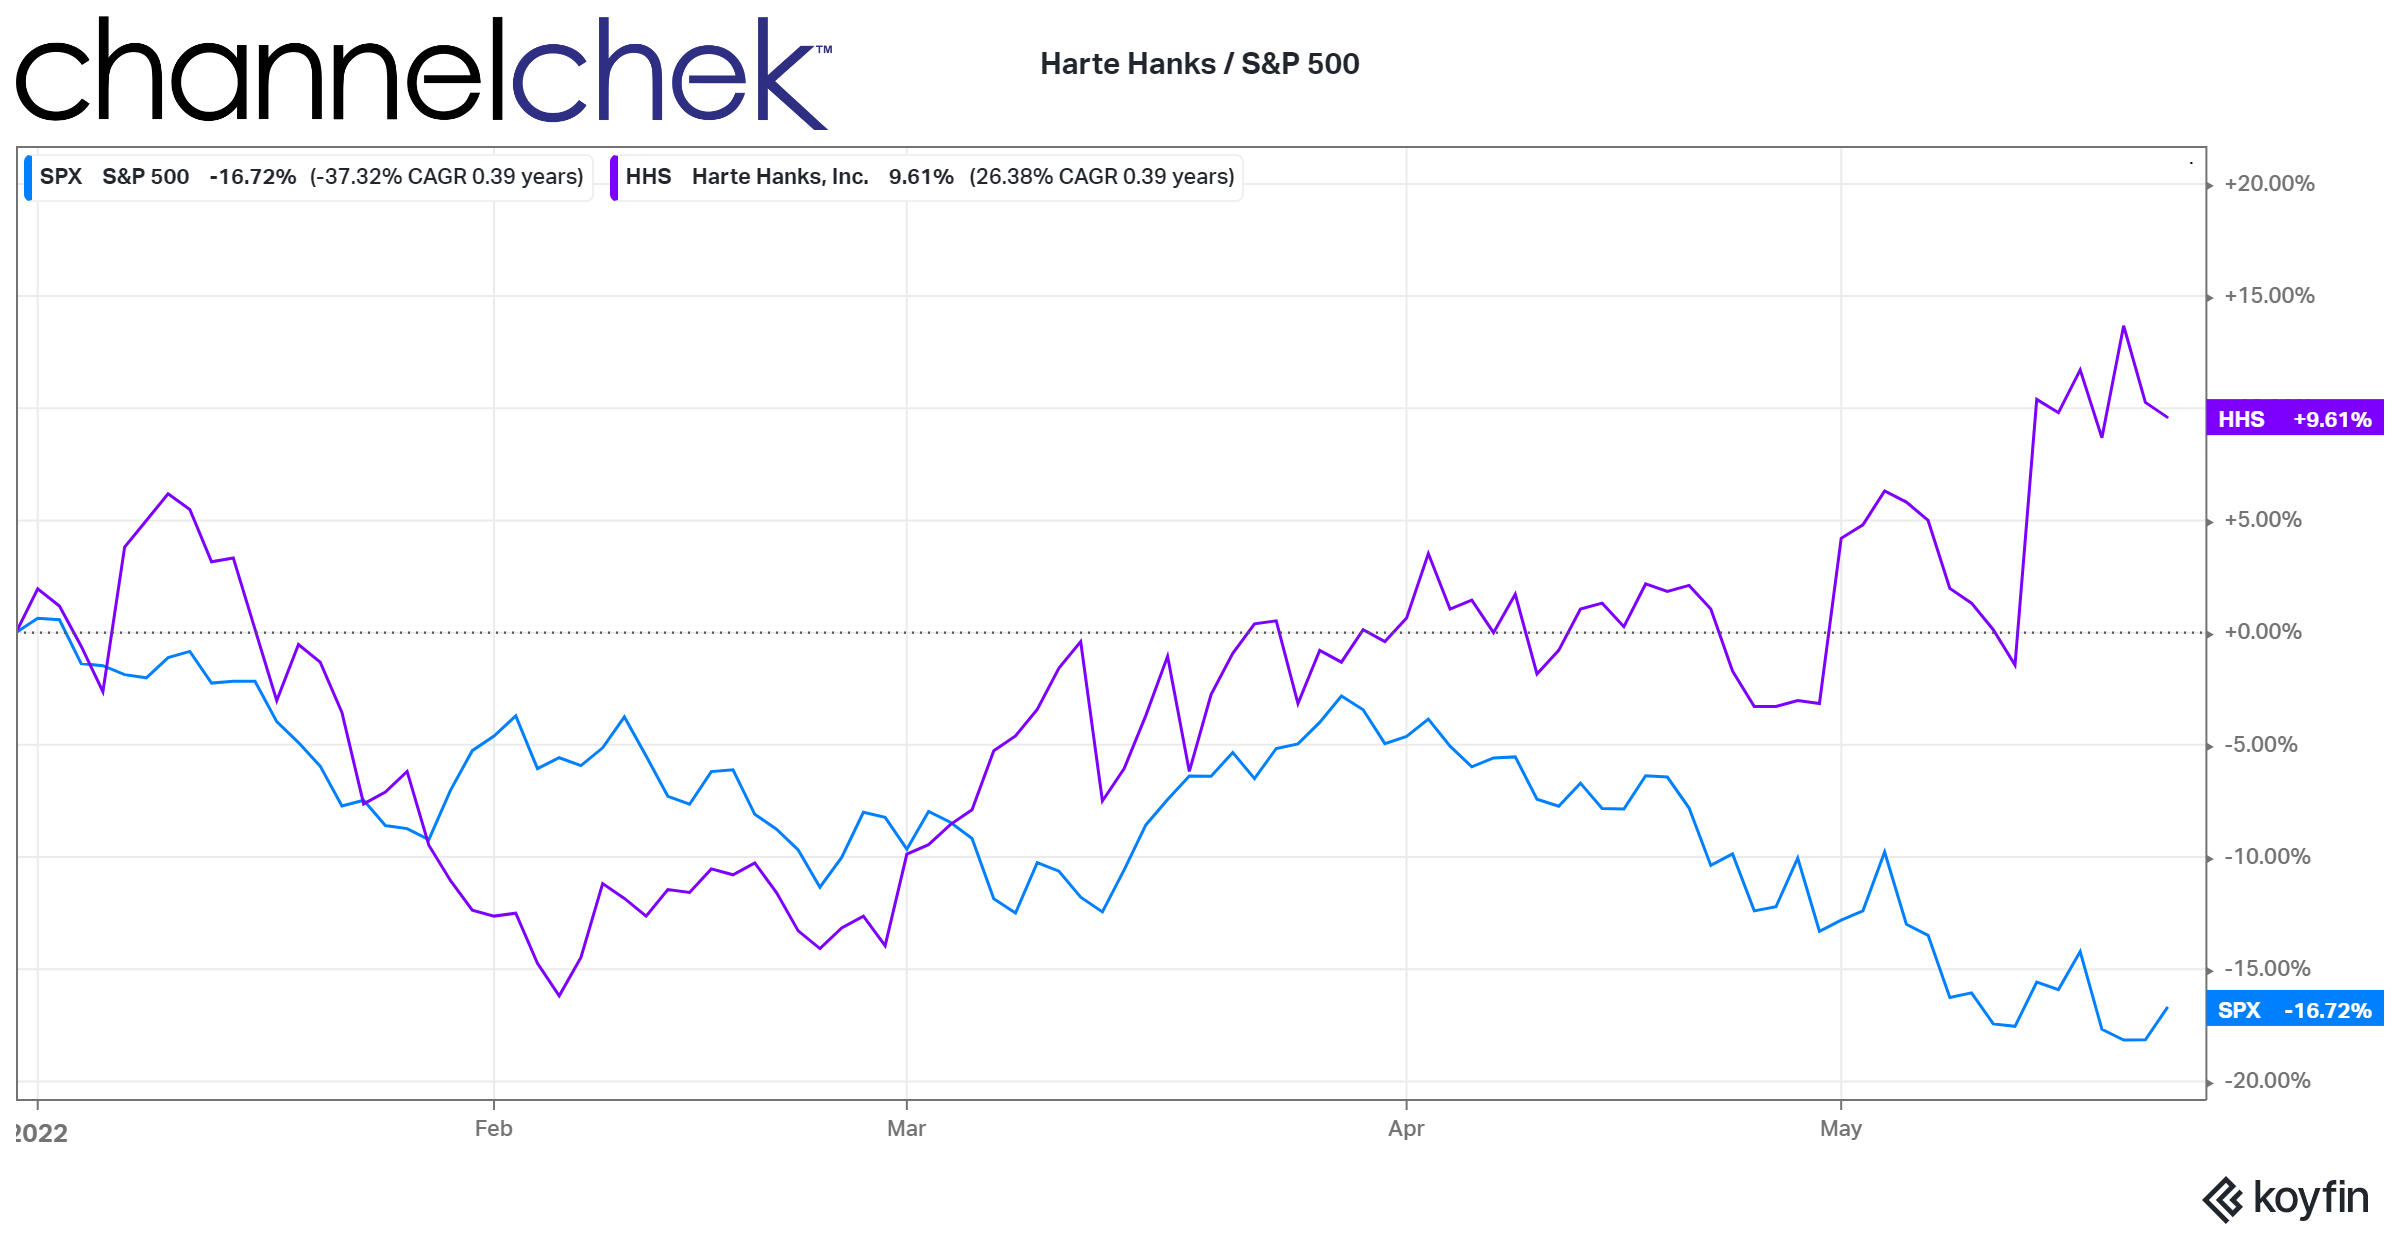
Harte Hanks is beating the S&P 500 index by 26.33%.


Source: Koyfin

In a research note published on May 13, Michael Kupinski, Director of Research at Noble Capital Markets wrote about the company’s positive upside potential,  “In spite of the strong start, we are maintaining our full year 2022 adj. EBITDA estimate of $19.8 million. We believe  that the stage is set for positive upside surprise potential should the company be able to replace a large portion of the anticipated fall off in its Customer Care business.”  View the full report.

Take-Away

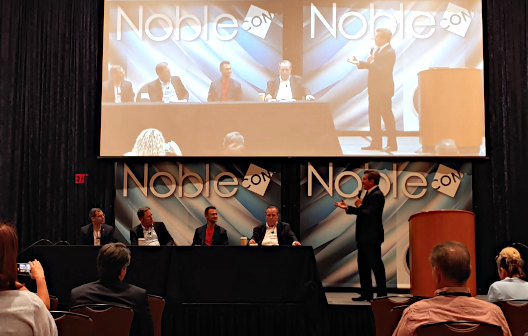
Both media companies, Cumulus Media and Harte Hanks presented at the recent NobleCon18 investor conference. Follow these links to listen to the management discussions, CMLS and HHS.

The battle of all savers and investors is real. Staying ahead of inflation to retain purchasing power has been elusive for many. There are sectors and stocks within the sectors worth reviewing. Channelchek provides research from Noble Capital Markets on companies that may not get as much attention as others. Sign-up to receive emails each morning with fresh reports pre-market opening.

Paul Hoffman

Managing Editor, Channelchek

Suggested Content


What Media Experts Expect from the Metaverse


Forbes Global Media (OPA) NobleCon18 Presentation Replay


Avoiding the Noise and Focusing on Managing Your Investments


Noble Capital Markets Media Sector Review – Q1 2022

Sources

https://www.prnewswire.com/news-releases/harte-hanks-generates-12-revenue-growth-delivers-0-39-in-eps-for-the-first-quarter-of-2022–301545501.html

www.Channelchek.com

Stay up to date. Follow us:


C-Suite Interview with FAT Brands (FAT) President & CEO Andrew Wiederhorn


Noble Capital Markets Senior Research Analyst Joe Gomes sits down with FAT Brands President & CEO Andrew Wiederhorn.

Research, News, and Advanced Market Data on FAT


View all C-Suite Interviews


The 2022 C-Suite Interview series is now available on major podcast platforms

About FAT (Fresh. Authentic. Tasty.) Brands

FAT Brands (NASDAQ: FAT) is a leading global franchising company that strategically acquires, markets, and develops fast casual, quick-service, casual dining, and polished casual dining concepts around the world. The Company currently owns 17 restaurant brands: Round Table Pizza, Fatburger, Marble Slab Creamery, Johnny Rockets, Fazoli’s, Twin Peaks, Great American Cookies, Hot Dog on a Stick, Buffalo’s Cafe & Express, Hurricane Grill & Wings, Pretzelmaker, Elevation Burger, Native Grill & Wings, Yalla Mediterranean and Ponderosa and Bonanza Steakhouses, and franchises and owns over 2,300 units worldwide.

The Federal Reserve’s Financial Well-Being Survey Breaks Record


Image Credit: Rodnae (Pexels)


Federal Reserve Board Issues Economic Well-Being of U.S. Households Report

The Federal Reserve Board on Monday issued its Economic Well-Being of U.S. Households in 2021 report, which examines the financial lives of U.S. adults and their families. The report draws from the Board’s ninth annual Survey of Household Economics and Decisionmaking, or SHED, which was conducted in October and November of last year before the increase in COVID-19 cases from the Omicron variant and other changes to the economic landscape in recent months. The report, fact sheet, downloadable data, data visualizations, and a video summarizing the survey’s findings may be found here.

The report indicates that self-reported financial well-being reached its highest level since the SHED began in 2013. In the fourth quarter of 2021, 78 percent of adults reported either doing okay or living comfortably financially. Financial well-being also increased among all the racial and ethnic groups measured in the survey, with a particularly large increase among Hispanic adults. Parents were one group who reported large gains in financial well-being with three-fourths saying they were doing at least okay financially, up 8 percentage points from 2020.

“The SHED results provide valuable insight into Americans’ financial conditions during the late fall of 2021. This important perspective helps the Federal Reserve better understand the economic challenges that existed during that phase of the pandemic recovery,” said Federal Reserve Board Governor Michelle W. Bowman.

The share of adults who reported that they would cover a $400 emergency expense using cash or its equivalent similarly increased to the highest level since the start of the survey—68 percent—and was up from 50 percent when the survey began in 2013. Eleven percent of adults could not pay the expense by any method.

In addition, the survey presents insight into the experiences of workers through the pandemic. Fifteen percent of workers said they were in a different job than 12 months earlier. Most who changed jobs said the job change was an improvement. Remote work also continued to evolve in 2021. During the week of the survey in late 2021, 22 percent of employees worked entirely from home, down from 29 percent in late 2020, but well above the 7 percent who worked entirely from home before the pandemic. Most employees who worked from home preferred to do so, often citing work-life balance and less time commuting. Those working from home indicated that they would be about as likely to look for a new job if required to return to the office as if their employer instituted a pay freeze.

In addition, the
report
explores families’ experiences related to banking and credit, income, housing, retirement, student loans, and retirement alongside several new topics, such as the use of emerging financial products including cryptocurrencies and “Buy Now, Pay Later” services.

This press release was originally published by the U.S. Federal Reserve on May 23, 2022. Links to the survey results and release are provided below.

Suggested Reading


Tulip Mania Compared to Cryptocurrencies and Meme Stock Investing


Why Good Economic Numbers Can Cause a Selloff


SEC Chairman Links Crypto and Other Financial Markets


Is the Bear Market Bull?

Sources

https://www.federalreserve.gov/publications/report-economic-well-being-us-households.htm

https://www.federalreserve.gov/newsevents/pressreleases/other20220523a.htm

Stay up to date. Follow us:


Release – Entravision Announces Participation in Upcoming Investor Conferences


Entravision Announces Participation in Upcoming Investor Conferences

Research, News, and Market Data on Entravision

Company Release – 5/23/2022 4:15 PM ET

SANTA MONICA, Calif.–(BUSINESS WIRE)– Entravision (NYSE: EVC), a leading global advertising solutions, media and technology company, today announced Chris Young, Chief Financial Officer and Treasurer, will participate in the following upcoming investor conferences:

  • Singular Research’s Spring Select Webinar to be held Wednesday, May 25, 2022 from 6:00 a.m. to 4:00 p.m. PT. Management is scheduled to present that day at 1:45 p.m. PT.
  • The Gabelli 14th Annual Entertainment & Broadcasting Symposium to be held Thursday, June 2, 2022 in New York, New York. Management is scheduled to present on Thursday, June 2, 2022 at 10:00 a.m. ET and will participate in meetings with investors throughout the day.
  • The 12th Annual East Coast IDEAS Investor Conference to be held virtually on June 22-23, 2022. Management will host meetings on Wednesday, June 22, 2022, and Entravision’s presentation will be available beginning on Wednesday, June 22, 2022 at 6:00 a.m. ET.

The presentations will be webcast live over the Internet, and links to the live webcasts and replays will be available on Entravision’s Investor Relations website at investor.entravision.com.

About Entravision Communications Corporation

Entravision is a leading global advertising solutions, media and technology company connecting brands to consumers. Our dynamic portfolio includes digital, television and audio offerings. Digital, our largest revenue segment, is comprised of four business units: our digital sales representation business; Smadex, our programmatic ad purchasing platform; our branding and mobile performance solutions business; and our digital audio business. Through our digital sales representation business, we connect global media companies such as Meta, Twitter, TikTok and Spotify with advertisers in primarily emerging growth markets worldwide. Smadex is our mobile-first demand side platform, enabling advertisers to execute performance campaigns using machine learning. We also offer a branding and mobile performance solutions business, which provides managed services to advertisers looking to connect with global consumers, primarily on mobile devices, and our digital audio business provides digital audio advertising solutions for advertisers in the Americas. In addition to digital, Entravision has 49 television stations and is the largest affiliate group of the Univision and UniMás television networks. Entravision also manages 46 primarily Spanish-language radio stations that feature nationally recognized, Emmy award-winning talent. Shares of Entravision Class A Common Stock trade on the NYSE under ticker: EVC. Learn more about our offerings at entravision.com or connect with us on LinkedIn and Facebook.

View source version on businesswire.comhttps://www.businesswire.com/news/home/20220523005892/en/

Christopher T. Young
Chief Financial Officer
Entravision

310-447-3870

Kimberly Esterkin
Addo Investor Relations
310-829-5400

evc@addo.com

Source: Entravision Communications Corporation


Release – Euroseas Ltd. Reports Results for the Quarter Ended March 31, 2022, Announces Share Repurchase Program and Declares Quarterly Common Stock Dividend


Euroseas Ltd. Reports Results for the Quarter Ended March 31, 2022, Announces Share Repurchase Program and Declares Quarterly Common Stock Dividend

Research, News, and Market Data on Euroseas Ltd


ATHENS, Greece, May 23, 2022 (GLOBE NEWSWIRE) — Euroseas Ltd. (NASDAQ: ESEA, the “Company” or “Euroseas”), an owner and operator of container carrier vessels and provider of seaborne transportation for containerized cargoes, announced today its results for the three-month period ended March 31, 2022 and a share repurchase program and declared a common stock dividend.

First Quarter 2022
Financial Highlights:

  • Total net revenues of $45.4 million. Net income and net income attributable to common shareholders of $29.9 million or $4.15 and $4.13 earnings per share basic and diluted, respectively. Adjusted net income attributable to common shareholders1 for the period was $26.8 million or $3.71 and $3.70 per share basic and diluted, respectively.
  • Adjusted EBITDA
    1 was $31.1 million.

  • An average of 16.0 vessels were owned and operated during the first quarter of 2022 earning an average time charter equivalent rate of $33,986 per day. 
  • The Board of Directors has approved a share repurchase program for up to a total of $20 million of the Company’s common stock. The Board will review the program after a period of 12 months. Share repurchases will be made from time to time for cash in open market transactions at prevailing market prices or in privately negotiated transactions. The timing and amount of purchases under the program will be determined by management based upon market conditions and other factors. The program does not require the Company to purchase any specific number or amount of shares and may be suspended or reinstated at any time at the Company’s discretion and without notice.
  • Declared a quarterly dividend of $0.50 per share for the first quarter of 2022 payable on or about June 16, 2022 to shareholders of record on June 9, 2022. This dividend reinstates the Company’s common stock dividend plan.

Recent developments

  • At the beginning of May we agreed to acquire M/V “Rena P” (ex. Seaspan Melbourne) and M/V “Emmanuel P” (ex. Seaspan Manila), both intermediate size container vessels with capacity of 4,250 teu each, built in 2007 and 2005, respectively. The vessels are being acquired for a combined price of $37 million and are expected to be delivered to the Company within May and June 2022, respectively. The Company will also assume the existing charter arrangements of the vessels as noted in the fleet profile below. Both acquisitions will be initially financed with the Company’s own funds.
  • In mid-May the Company exercised its option to proceed with the construction of two additional eco design fuel efficient containerships. The vessels will have a carrying capacity of about 2,800 teu each and will be built at Hyundai Mipo Dockyard Co. in South Korea. The two newbuildings are scheduled to be delivered during the fourth quarter of 2024. The total consideration for these two newbuilding contracts is approximately $86 million and will be financed with a combination of debt and equity.

Aristides Pittas,
Chairman and CEO of Euroseas commented: 
“Despite their recent small correction, the containership feeder charter rates have remained at levels near historical highs resulting in increased profitability for Euroseas. In parallel, expectations of continuing strength of the charter market have allowed us to charter forward the first two newbuildings of our 9-vessel newbuilding program at rates that will allow us to fully recover their construction cost over the 3-year duration of the charters. While the inefficiencies of the transportation system introduced by the COVID pandemic, that effectively reduce supply of ships, remain, uncertainties have been introduced by the on-going Ukraine-Russia conflict and increased levels of inflation that could affect economic growth and, thus, demand for shipping.   We expect the market to remain strong in the near and medium term and are monitoring the above trends which alongside with new regulation on greenhouse gas emissions and expected increased new vessel deliveries will shape our markets.

“Within this environment, we continuously look for investment and other opportunities that will allow us to maximize returns to our shareholders. Our investment strategy is focused either on placing newbuilding orders that also enhance the environmental footprint of our company, or, secondhand vessels with simultaneous charters that bring their cost basis to below historical average levels by the end of the charter, thus, providing us the option for upsized returns.

“Overall, we are determined to remain a significant participant in the feeder containership market and grow the company. Our charter coverage provides earnings visibility well into 2024. Despite that, our stock trades at levels that do not reflect the mere value of our contracted earnings let alone the net asset value of the company, thus, representing one of the most attractive investment opportunities for us. In that spirit, our Board of Directors has authorized a $20 million stock repurchase program which management may use at its discretion. Our Board believes that our increased profitability and earnings visibility should be used to restore our dividend policy which had run continuously from 2005 until 2013 and had been paused during the tough last decade. Our Board decided to use a small part of our contracted earnings which will not alter our growth philosophy to reward our shareholders and declared a common stock dividend of $0.50 per share.

“We are very pleased with these developments and we look forward to continuing to chart a very profitable future for our shareholders and investors.”

Tasos Aslidis, Chief
Financial Officer of Euroseas commented: 
“The results of the first quarter of 2022 reflect the strong market charter rates our vessels earned compared to the same period of last year. Our net revenues increased to $45.4 million in the first quarter of 2022 compared to $14.3 million during the same period of last year due to the higher number of vessels we operated in the first quarter of 2022 and the higher market rates earned by our vessels. During the first quarter of 2022 we operated 16.0 vessels versus 14.0 vessels during the same period of last year.

“On a per-vessel-per-day basis, our vessels earned a 180.1% higher average charter rate in the first quarter of 2022 as compared to the same period of 2021. Again, on a per-vessel-per-day basis, the sum of vessel operating expenses, management fees and general and administrative expenses increased by 5.3% during the first quarter of 2022 as compared to the same period in 2021 which was attributable mainly to an increase in hull and machinery insurance premiums, the increased crewing costs resulting from difficulties in crew rotation due to COVID-19 related restrictions and the increased lubricants oil costs as a result of the war in Ukraine for our vessels compared to the same period of 2021. We believe that we continue to maintain one of the lowest operating cost structures amongst the public shipping companies which is one of our competitive advantages.

“Adjusted EBITDA during the first quarter of 2022 was $31.1 million compared to $5.6 million achieved for the first quarter of 2021.

“Finally, as of March 31, 2022, our outstanding debt (excluding the unamortized loan fees) is about $112.1 million versus restricted and unrestricted cash of about $54.1 million.”
        

First Quarter 2022 Results:
For the first quarter of 2022, the Company reported total net revenues of $45.4 million representing a 217.1% increase over total net revenues of $14.3 million during the first quarter of 2021. On average, 16.0 vessels were owned and operated during the first quarter of 2022 earning an average time charter equivalent rate of $33,986 per day compared to 14.0 vessels in the same period of 2021 earning on average $12,134 per day. The Company reported a net income and a net income attributable to common shareholders for the period of $29.9 million, as compared to a net income of $3.8 million and a net income attributable to common shareholders of $3.6 million for the first quarter of 2021.

Vessel operating expenses for the first quarter of 2022 amounted to $8.4 million as compared to $6.9 million for the same period of 2021. The increased amount is due to the higher number of vessels owned and operated in the first quarter of 2022 compared to the corresponding period of 2021, partly offset by the increased crewing costs, for our vessels compared to the same period of 2021, resulting from difficulties in crew rotation due to COVID-19 related restrictions, the higher prices in the supply of lubricants and the increase in hull and machinery insurance premiums. Depreciation expense for the first quarter of 2022 amounted to $3.7 million compared to $1.6 million for the same period of 2021 due to the increased number of vessels in the Company’s fleet and the fact that the new vessels acquired in the fourth quarter of 2021 have a higher average daily depreciation charge as a result of their higher acquisition price compared to the remaining vessels. Related party management fees for the first quarter of 2022 increased to $1.2 million from $1.1 million for the same period of 2021 for the same reason. In the first quarter of 2022 two of our vessels completed their intermediate survey in water and one of our vessels completed her special survey with drydock for a total cost of $1.8 million. In the same period of 2021, none of our vessels underwent drydocking and certain expenses were incurred in connection with upcoming drydockings. Finally, during the first quarter of 2022 and 2021, we had other operating expenses of $0.35 million and other operating income of $0.2 million, respectively, relating to settlement of accounts with charterers.

Interest and other financing costs for the first quarter of 2022 amounted to $1.0 million compared to $0.7 million for the same period of 2021. This increase is due to the increased amount of debt and the increase in the weighted average LIBOR rate in the current period compared to the same period of 2021. For the three months ended March 31, 2022 the Company recognized a $2.34 million gain on its interest rate swap contracts, comprising a $0.04 million realized loss and a $2.38 million unrealized gain. For the three months ended March 31, 2021 the Company recognized a $0.48 million loss on its interest rate swap contract, comprising a $0.52 million unrealized loss and a $0.04 million realized gain.

Adjusted EBITDA1 for the first quarter of 2022 was $31.1 million, compared to $5.6 million achieved for the first quarter of 2021. Please see below for Adjusted EBITDA reconciliation to net income.

Basic and diluted earnings per share for the first quarter of 2022 was $4.15 and $4.13, respectively, calculated on 7,221,941 basic and 7,254,593 diluted weighted average number of shares outstanding compared to basic and diluted earnings per share of $0.53 for the first quarter of 2021, calculated on 6,711,408 basic and 6,749,393 diluted weighted average number of shares outstanding.

Excluding the effect on the income attributable to common shareholders for the quarter of the unrealized gain on derivatives, the amortization of below market time charters acquired and the depreciation charged due to the increased value of the vessel acquired with below market time charter, the adjusted earnings per share for the quarter ended March 31, 2022 would have been $3.71 and $3.70 per share basic and diluted, respectively, compared to adjusted earnings of $0.45 per share basic and diluted for the first quarter of 2021, after excluding unrealized gain on derivatives and loss on sale of a vessel. Usually, security analysts do not include the above items in their published estimates of earnings per share.

Fleet Profile:
The Euroseas Ltd. fleet profile is as follows:

Vessels
under construction

Type

Dwt

TEU

To be delivered

Employment

TCE Rate ($/day)

GREGOS (*) (H4201)

Feeder

37,237

2,800

Q1 2023

TC until Mar-26

$48,000

TERATAKI (*) (H4202)

Feeder

37,237

2,800

Q2 2023

TC until Jun-26

$48,000

TENDER SOUL (H4236)

Feeder

37,237

2,800

Q4 2023


LEONIDAS Z (H4237)

Feeder

37,237

2,800

Q1 2024


MONICA (H4248)

Feeder

22,262

1,800

Q1 2024


STEPHANIA K (H4249)

Feeder

22,262

1,800

Q2 2024


PEPI STAR (H4250)

Feeder

22,262

1,800

Q2 2024


DEAR PANEL (H4251)

Feeder

37,237

2,800

Q4 2024


SYMEON P (H4252)

Feeder

37,237

2,800

Q4 2024


Total
under construction

9

290,208

22,200


Note: (*)(+) TC denotes time charter. Charter duration indicates the earliest redelivery date; All dates listed are the earliest redelivery dates under each TC unless the contract rate is lower than the current market rate in which cases the latest redelivery date is assumed; vessels with the latest redelivery date shown are marked by (+).

(**) The CONTEX (Container Ship Time Charter Assessment Index) has been published by the Hamburg and Bremen Shipbrokers’ Association (VHBS) since October 2007. The CONTEX is a company-independent index of time charter rates for containerships. It is based on assessments of the current day charter rates of six selected containership types, which are representative of their size categories: Type 1,100 TEU and Type 1,700 TEU with a charter period of one year, and the Types 2,500, 2,700, 3,500 and 4,250 TEU all with a charter period of two years.

(***) Rate is net of commissions (which are typically 5-6.25%)


Summary Fleet Data:


Three Months Ended
March 31,2021

Three Months Ended
March 31,2022


Revenues


Time charter revenue

14,916,567

47,119,092

Commissions

(607,249)

(1,745,554)

Net revenues

14,309,318

45,373,538


Operating
expenses / (income)


Voyage expenses

127,409

354,024

Vessel operating expenses

6,864,353

8,398,893

Drydocking expenses

82,209

1,787,926

Vessel depreciation

1,596,543

3,721,116

Related party management fees

1,086,405

1,172,032

Loss on sale of vessel

9,417

General and administrative expenses

760,977

983,072

Other operating (income) / expenses

(216,496)

350,000

Total operating expenses, net

10,310,817

16,767,063


Operating
income

3,998,501

28,606,475


Other
income / (expenses)


Interest and other financing costs

(694,307)

(1,014,431)

Gain on derivatives, net

484,910

2,342,517

Foreign exchange (loss) / gain

(241)

1,052

Interest income

1,214

681

Other (expenses) / income, net

(208,424)

1,329,819


Net income

3,790,077

29,936,294

Dividend Series B Preferred shares

(138,269)

Preferred deemed dividend

(86,356)

Net income attributable to common
shareholders

3,565,452

29,936,294

Earnings per share, basic

0.53

4.15

Weighted average number of shares, basic

6,711,408

7,221,941

Earnings per share, diluted

0.53

4.13

Weighted average number of shares, diluted

6,749,393

7,254,593


Euroseas Ltd.
Unaudited Consolidated Condensed Balance Sheets
(All amounts expressed in U.S. Dollars – except number of shares)


Three Months
Ended March 31,
2021

Three Months
Ended March 31,
2022


Cash
flows from operating activities:


Net income

3,790,077

29,936,294

Adjustments to reconcile net income to net cash provided by operating activities:


Vessel depreciation

1,596,543

3,721,116

Amortization of deferred charges

49,280

83,496

Share-based compensation

28,765

214,559

Loss on sale of vessel

9,417

Unrealized gain on derivatives

(527,775)

(2,383,764)

Amortization of fair value of below market time charters acquired

(1,218,240)

Changes in operating assets and liabilities

1,422,694

(130,692)

Net
cash provided by operating activities

6,369,001

30,222,769


Cash
flows from investing activities:


Cash paid for vessels under construction

(1,732)

Cash paid for vessels acquisitions and capitalized expenses

(281,300)

Cash paid for vessel improvements

(208,457)

(403,928)

Net
cash used in investing activities

(208,457)

(686,960)


Cash flows from financing activities:


Redemption of Series B preferred shares

(2,000,000)

Proceeds from issuance of common stock, net of commissions paid

743,552

Preferred dividends paid

(91,607)

Repayment of long-term bank loans

(2,185,460)

(6,885,460)

Repayment of related party loan

(2,500,000)

Offering expenses paid

(60,357)

(27,838)

Net
cash used in financing activities

(6,093,872)

(6,913,298)


Net increase in cash, cash equivalents, and restricted cash

66,672

22,622,511

Cash, cash equivalents, and restricted cash at beginning of period

6,338,177

31,498,229

Cash,
cash equivalents, and restricted cash at end of period

6,404,849

54,120,740

Cash
breakdown


Cash and cash equivalents

3,629,150

49,151,500

Restricted cash, current

341,432

169,240

Restricted cash, long term

2,434,267

4,800,000

Total
cash, cash equivalents, and restricted cash shown in the statement of cash
flows

6,404,849

54,120,740


Euroseas Ltd.
Reconciliation of Adjusted EBITDA to
Net Income
(All amounts expressed in U.S. Dollars)


Three Months Ended
March 31, 2021

Three Months Ended
March 31, 2022

Net
income

3,790,077


29,936,294


Unrealized gain on derivatives

(527,775

)

(2,383,764

)

Loss on sale of vessel

9,417


Amortization of below market time charters acquired


(1,218,240

)

Depreciation charged due to increase in vessel value from below market time charter acquired


494,808


Adjusted
net income

3,271,719


26,829,098


Preferred dividends

(138,269

)


Preferred deemed dividend

(86,356

)


Adjusted
net income attributable to common shareholders

3,047,094


26,829,098


Adjusted earnings per share, basic

0.45


3.71


Weighted average number of shares, basic

6,711,408


7,221,941


Adjusted earnings per share, diluted

0.45


3.70


Weighted average number of shares, diluted

6,749,393


7,254,593


Adjusted net income and Adjusted earnings per share Reconciliation:
Euroseas Ltd. considers Adjusted net income to represent net income before unrealized gain on derivatives, loss on sale of vessel, amortization of below market time charters acquired and depreciation charged due to increase in vessel value from below market time charter acquired. Adjusted net income and Adjusted earnings per share is included herein because we believe it assists our management and investors by increasing the comparability of the Company’s fundamental performance from period to period by excluding the potentially disparate effects between periods of unrealized gain on derivatives, loss on sale of vessel, amortization of below market time charters acquired and depreciation charged due to increase in vessel value from below market time charter acquired, which items may significantly affect results of operations between periods.

Adjusted net income and Adjusted earnings per share do not represent and should not be considered as an alternative to net income or earnings per share, as determined by GAAP. The Company’s definition of Adjusted net income and Adjusted earnings per share may not be the same as that used by other companies in the shipping or other industries.

About Euroseas Ltd.
Euroseas Ltd. was formed on May 5, 2005 under the laws of the Republic of the Marshall Islands to consolidate the ship owning interests of the Pittas family of Athens, Greece, which has been in the shipping business over the past 140 years. Euroseas trades on the NASDAQ Capital Market under the ticker ESEA.

Euroseas operates in the container shipping market. Euroseas’ operations are managed by Eurobulk Ltd., an ISO 9001:2008 and ISO 14001:2004 certified affiliated ship management company, which is responsible for the day-to-day commercial and technical management and operations of the vessels. Euroseas employs its vessels on spot and period charters and through pool arrangements.

The Company has a fleet of 18 vessels, including 10 Feeder containerships and 8 Intermediate containerships. Euroseas 18 containerships have a cargo capacity of 58,871 teu. After the delivery of nine feeder containership newbuildings in 2023 and 2024, Euroseas’ fleet will consist of 27 vessels with a total carrying capacity of 81,071 teu.

Forward Looking Statement
This press release contains forward-looking statements (as defined in Section 27A of the Securities Act of 1933, as amended, and Section 21E of the Securities Exchange Act of 1934, as amended) concerning future events and the Company’s growth strategy and measures to implement such strategy; including expected vessel acquisitions and entering into further time charters. Words such as “expects,” “intends,” “plans,” “believes,” “anticipates,” “hopes,” “estimates,” and variations of such words and similar expressions are intended to identify forward-looking statements. Although the Company believes that the expectations reflected in such forward-looking statements are reasonable, no assurance can be given that such expectations will prove to have been correct. These statements involve known and unknown risks and are based upon a number of assumptions and estimates that are inherently subject to significant uncertainties and contingencies, many of which are beyond the control of the Company. Actual results may differ materially from those expressed or implied by such forward-looking statements. Factors that could cause actual results to differ materially include, but are not limited to changes in the demand for containerships, competitive factors in the market in which the Company operates; risks associated with operations outside the United States; and other factors listed from time to time in the Company’s filings with the Securities and Exchange Commission. The Company expressly disclaims any obligations or undertaking to release publicly any updates or revisions to any forward-looking statements contained herein to reflect any change in the Company’s expectations with respect thereto or any change in events, conditions or circumstances on which any statement is based.

Visit the Company’s
website 
www.euroseas.gr


Price Moves When Warren Buffett Buys and Sells (Based on May 16 SEC Filing)

The Big Price Impact on Stocks After Warren Buffett’s Most Active Buying Spree

Warren Buffett and Berkshire Hathaway (BRK.A, BRK.B) were actively spending down the company’s large pool of cash last quarter, just as they promised during their recent annual meeting. This makes sense as some stock prices are lower than they have been in years, and a few sectors are showing they could have plenty of upside potential. It makes even more sense when you consider that Berkshire Hathaway was sitting on $144 billion in cash. The inflation rate is now running above 8% and eroding the value of every unearning penny.

Jumping into the market can be costly if wrong, but investor’s ‘dry powder’ is being eroded with increased costs by the day – finding a place for money to grow by at least the inflation rate would seem prudent. The analysts at Berkshire Hathaway are certainly aware of this.

The positive impact of Berkshire showing confidence in a company is often all that is needed to exceed the near non-earnings holding a cash position. Below we look at three Berkshire Hathaway changed positions as reported on May 16, and then compare the stock’s price moves versus the overall market.

Where Did They Gain Exposure

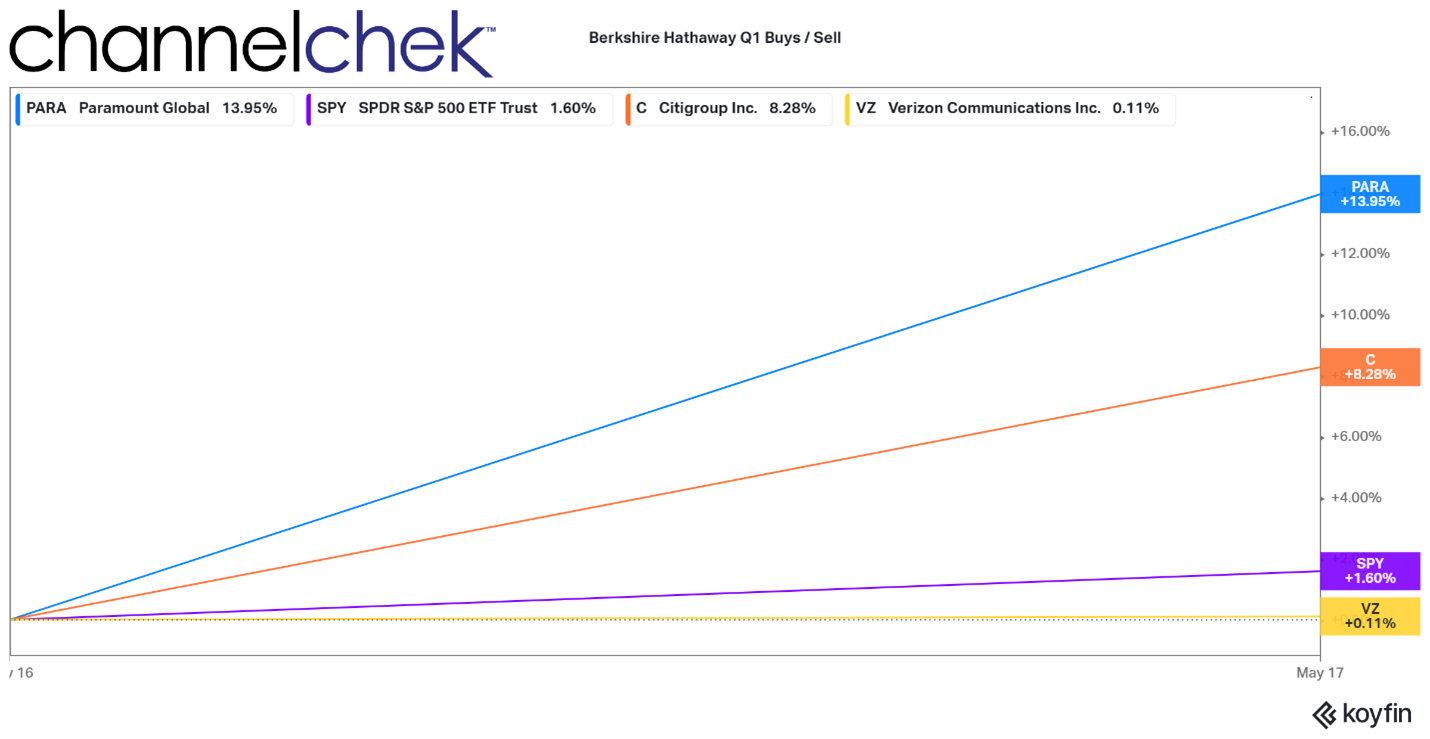
As revealed by the companies 13F filed on May 16, as of March 31 Berkshire Hathaway added Citigroup (C), Paramount Global (PARA), and sold Verizon (VZ). There were older positions added to as well, such as Chevron (CVX), and Activision Blizzard (ATVI). But for the purpose of showing the power of Buffett’s believing a stock is attractive, or in Verizon’s case, no longer attractive, we’ll take a look at the market moves of these companies as of 1pm the day after the 13F was made public.

Source: Koyfin
The above chart of Citibank, Paramount Global, and Verizon from the beginning trading on Monday compares the stocks to the S&P 500 performance during the same short period.

The S&P, as reflected during the short period in this chart, beginning on the date of Berkshire’s 13F filing, shows the S&P 500 up 1.60%. This is substantial in a year when the index has mostly been delivering red to investors. Verizon was the most noteworthy sale of Buffett as they brought their position near zero. The company’s stock rose only 0.11%, well below the S&P benchmark performance.

As for the positions opened during the first quarter by Berkshire Hathaway, Citicorp shot up 8.28%. Paramount Global reacted even more strongly, rising double digits to 13.95%. 

Lessons

While an SEC-registered portfolio new holdings are kept close to the vest before reported in order to avoid insider trading problems, listening to what someone like Warren Buffett is saying at annual meetings and at other times can allow you to get a sense if they have been active, and in what industries. More important, is whether they are active buying or selling. For an investor that is holding a stock which a well-followed investor has decided to sell, can cause significant underperformance for at least the near term.

Other Pertinent Info from the 13F Filing

During the first quarter of 2022, the value of Berkshire’s US stock portfolio rose by 10% to $364 billion. Buffett had indicated the firm he manages has been struggling to find bargains in recent years. He blamed this on stocks swelling to record highs, fierce competition from private equity firms, and SPACs which increased competition and costs of acquisitions. Even Berkshire’s own rising stock price made it unappealing as a company stock buy-back.

A change of appetite took place in the first quarter of 2022. Berkshire bought $51 billion worth of equities and sold less than $10 billion in stocks. Its net cash reduction of $41 billion helped slash its cash pile by 28% to $106 billion. Q1 2022 marked one of the most active buying periods in Berkshire Hathaway’s history.

Take-Away

Well known, successful investors can either make a winner out of your holding or cause it to trade at a pace below the market. While knowing and trading on information before it is made public can get you in trouble, investors like Buffett do provide guidance. These hints as to their thinking and likely direction may help investors somewhat. This is why it always makes sense to know what they’re saying – it isn’t fun holding something they just reported sold, and the tailwind they create when you’re long the same company can be profitable.

Paul Hoffman

Managing Editor, Channelchek

Sources

https://www.sec.gov/Archives/edgar/data/1067983/000095012322006442/xslForm13F_X01/primary_doc.xml

https://whalewisdom.com/filer/berkshire-hathaway-inc#google_vignette

www.koyfin.com

Bowlero (BOWL) – Cleans Up Capital Structure

Friday, May 20, 2022

Bowlero (BOWL)
Cleans Up Capital Structure

Bowlero Corp. is the worldwide leader in bowling entertainment, media, and events. With more than 300 bowling centers across North America, Bowlero Corp. serves more than 26 million guests each year through a family of brands that includes Bowlero, Bowlmor Lanes, and AMF. In 2019, Bowlero Corp. acquired the Professional Bowlers Association, the major league of bowling, which boasts thousands of members and millions of fans across the globe. For more information on Bowlero Corp., please visit BowleroCorp.com.

Michael Kupinski, Director of Research, Noble Capital Markets, Inc.

Patrick McCann, Research Associate, Noble Capital Markets, Inc.

Refer to the full report for the price target, fundamental analysis, and rating.

Warrants off the books. The company announced that all of its outstanding warrants have been either redeemed or exercised. As of March 31, the company had a total of roughly 14.5 million outstanding warrants, a combination of public and privately held. The company also announced the repurchase of 0.46 million shares since the last quarter-end for roughly $4.3 million.

Cashless Exercise. The company received roughly $23,000 in connection with the exercise of some of the publicly held warrants. However, the vast majority of the warrants were exercised on a cashless basis. In total, the company issued approximately 4.26 million shares for the exercise of the remaining warrants.

This Company Sponsored Research is provided by Noble Capital Markets, Inc., a FINRA and S.E.C. registered broker-dealer (B/D).

*Analyst certification and important disclosures included in the full report. NOTE: investment decisions should not be based upon the content of this research summary. Proper due diligence is required before making any investment decision. 

Cypress Development (CYDVF) – Recent Share Price Weakness Offers Investors an Attractive Entry Point

Friday, May 20, 2022

Cypress Development (CYDVF)
Recent Share Price Weakness Offers Investors an Attractive Entry Point

Mark Reichman, Senior Research Analyst, Natural Resources, Noble Capital Markets, Inc.

Refer to the full report for the price target, fundamental analysis, and rating.

Well positioned to meet growing demand for lithium. Cypress Development is advancing its 100%-owned Clayton Valley Lithium Project near Silver Peak, Nevada. Cypress intends to mine Nevada claystone, produce a high-grade lithium concentrate solution and apply a licensed lithium extraction process based on ion-exchange to produce lithium carbonate or hydroxide. Clayton Valley could go into production as early as 2025, following the completion of a feasibility study by year-end 2022, a two-year permitting period which could begin mid-year 2022, and one-year construction period. We have assumed commercial production commences in 2026.

Enertopia acquisition closed. Cypress Development recently completed its acquisition of Enertopia’s lithium claystone project adjacent and at the northwest end of its own Clayton Valley lithium project. The acquisition adds seventeen unpatented mining claims totaling 160 contiguous acres and will be rolled into Cypress’ own resource model and feasibility study which is expected by year-end 2022. The acquired property could extend the pit outline to the northeast and provide material that could enhance the production schedule in the early years.  …

This Company Sponsored Research is provided by Noble Capital Markets, Inc., a FINRA and S.E.C. registered broker-dealer (B/D).

*Analyst certification and important disclosures included in the full report. NOTE: investment decisions should not be based upon the content of this research summary. Proper due diligence is required before making any investment decision.