PDS Biotechnology Corp (PDSB) – Clinical Progress Continues As 1Q22 Results Were Within Expectations

Thursday, May 12, 2022

PDS Biotechnology Corp (PDSB)
Clinical Progress Continues As 1Q22 Results Were Within Expectations

PDS Biotech is a clinical-stage immunotherapy company developing a growing pipeline of molecularly targeted cancer and infectious disease immunotherapies based on the Company’s proprietary Versamune® and Infectimune™ T-cell activating technology platforms. Our Versamune®-based products have demonstrated the potential to overcome the limitations of current immunotherapy by inducing in vivo, large quantities of high-quality, highly potent polyfunctional tumor specific CD4+ helper and CD8+ killer T-cells. PDS Biotech has developed multiple therapies, based on combinations of Versamune® and disease-specific antigens, designed to train the immune system to better recognize diseased cells and effectively attack and destroy them. The Company’s pipeline products address various cancers including HPV16-associated cancers (anal, cervical, head and neck, penile, vaginal, vulvar) and breast, colon, lung, prostate and ovarian cancers.

Robert LeBoyer, Vice President, Research Analyst, Life Sciences , Noble Capital Markets, Inc.

Refer to the full report for the price target, fundamental analysis, and rating.

PDS Biotechnology Reported 1Q22.  PDS Biotechnology reported a loss of $8.5 million or $(0.32) per share for 1Q22, consistent with our expectations.  The company also gave updates on its clinical trials and pipeline products, and has two  upcoming poster presentations scheduled to provide clinical data updates from PDS0101 trials in trials for HPV-associated cancers.  Cash on hand at the end of the quarter was $58.9 million.

PDS0101 Has Four Trials For HPV-Associated Cancer.    The lead product is PDS0101, a cancer therapy that uses the Versamune technology to deliver the HPV16 antigen. There are four trials in progress that test the drug in HPV-associated cancers found in any tissue or location, and at different stages of disease, and in combination with other drugs. Two clinical updates are scheduled for the American Society of Clinical Oncology (ASCO) from June 3-7….

This Company Sponsored Research is provided by Noble Capital Markets, Inc., a FINRA and S.E.C. registered broker-dealer (B/D).

*Analyst certification and important disclosures included in the full report. NOTE: investment decisions should not be based upon the content of this research summary. Proper due diligence is required before making any investment decision. 

Vectrus (VEC) – Solid First Quarter Results Set the Table for 2022

Thursday, May 12, 2022

Vectrus (VEC)
Solid First Quarter Results Set the Table for 2022

For more than 70 years, Vectrus has provided critical mission support for our customers’ toughest operational challenges. As a high-performing organization with exceptional talent, deep domain knowledge, a history of long-term customer relationships, and groundbreaking technical expertise, we deliver innovative, mission-matched solutions for our military and government customers worldwide. Whether it’s base operations support, supply chain and logistics, IT mission support, engineering and digital integration, security, or maintenance, repair and overhaul, our customers count on us for on-target solutions that increase efficiency, reduce costs, improve readiness, and strengthen national security. Vectrus is headquartered in Colorado Springs, Colo., and includes about 8,100 employees spanning 205 locations in 28 countries. In 2021, Vectrus generated sales of $1.8 billion. For more information, visit the company’s website at www.vectrus.com or connect with Vectrus on Facebook, Twitter, and LinkedIn.

Joe Gomes, Senior Research Analyst, Noble Capital Markets, Inc.

Joshua Zoepfel, Research Associate, Noble Capital Markets, Inc.

Refer to the full report for the price target, fundamental analysis, and rating.

1Q22 Results. Revenue of $456.5 million was up 5.2% y-o-y and above our $427 million estimate, with the revenue beat due to the pull forward of some business. Adjusted EBITDA margin of 4% continued to be impacted by the phase-in of new awards and pass through content. Adjusted EPS in the quarter was $1.01 versus $1.20. We had estimated $0.77.

Kwajalein. Vectrus was able to transition to full operational control of Kwajalein a full six weeks from original expectations. Not only did this add to first quarter results, but several of the functions being provided are additive to the Company’s core O&M offerings and will provide a path to pursue adjacent and expanded opportunities with clients in the future.

This Company Sponsored Research is provided by Noble Capital Markets, Inc., a FINRA and S.E.C. registered broker-dealer (B/D).

*Analyst certification and important disclosures included in the full report. NOTE: investment decisions should not be based upon the content of this research summary. Proper due diligence is required before making any investment decision. 

Release – Avivagen Announces Approval in China, the World’s Largest Commercial Feed Production Market


Avivagen Announces Approval in China, the World’s Largest Commercial Feed Production Market

Research, News, and Market Data on Avivagen

Ottawa, ON /Business Wire/ May 12, 2022 /– Avivagen Inc. (TSXV:VIV, OTCQB:VIVXF) (“Avivagen”), a life sciences corporation focused on developing and commercializing products for livestock, companion animal and human applications that safely enhances feed intake and supports immune function, thereby supporting general health and performance, is pleased to announce that Avivagen’s oxidized carotenoid-based feed additive product has received approval for use in China.

“Core to our success to date has been the strong inroads we’ve made across key Asian feed markets, and we’re thrilled to now have regulatory approval to bring OxC-betaTM to feed producers and commercial operations across China,” says Kym Anthony, Chief Executive Officer, Avivagen. “Having direct access to the world’s largest feed market at a time of continued growth has the potential to be transformative for Avivagen and help drive greater adoption and growth in Asia and worldwide.”

The approval comes as a result of Avivagen working closely with COFCO Biotech, a state-owned multi-billion-dollar company, and follows successful trials across numerous species.

China was ranked as the number one feed-producing country in the world in the 2022 Alltech Agri-Food Outlook, producing 261.4mmt in 2021. The country also experienced the largest increase in feed production by tonnage during the year, as the country’s feed industry continues to consolidate and modernize . The country has been a leader in efforts to reduce antibiotic use with livestock nationwide, in an effort to reduce antimicrobial-resistance in the region.

About Avivagen
Avivagen is a life sciences corporation focused on developing and commercializing products for livestock, companion animal and human applications that, by safely supporting immune function, promote general health and performance. It is a public corporation traded on the TSX Venture Exchange under the symbol VIV and is headquartered in Ottawa, Canada, based in partnership facilities of the National Research Council of Canada. For more information, visit www.avivagen.com. The contents of the website are expressly not incorporated by reference in this press release.

About OxC-beta™
Technology and OxC-beta™ Livestock

Avivagen’s OxC-beta™ technology is derived from Avivagen discoveries about ?-carotene and other carotenoids, compounds that give certain fruits and vegetables their bright colours. Through support of immune function the technology provides a non-antibiotic means of promoting health and growth. OxC-beta™ Livestock is a proprietary product shown to be an effective and economic alternative to the antibiotics commonly added to livestock feeds. The product is currently available for sale in the United States, Philippines, Mexico, Taiwan, New Zealand, Thailand, Brazil, Australia, Vietnam and Malaysia.

Avivagen’s OxC-beta™ Livestock product is safe, effective and could fulfill the global mandate to remove all in-feed antibiotics as growth promoters. Numerous international livestock trials with poultry and swine using OxC-beta™ Livestock have proven that the product performs as well as, and, sometimes, in some aspects, better than in-feed antibiotics.

Forward Looking
Statements

This
news release includes certain forward-looking statements that are based upon
the current expectations of management. Forward-looking statements involve
risks and uncertainties associated with the business of Avivagen Inc. and the
environment in which the business operates. Any statements contained herein
that are not statements of historical facts may be deemed to be
forward-looking, including those identified by the expressions “aim”,
“anticipate”, “appear”, “believe”, “consider”, “could”, “estimate”, “expect”,
“if”, “intend”, “goal”, “hope”, “likely”, “may”, “plan”, “possibly”,
“potentially”, “pursue”, “seem”, “should”, “whether”, “will”, “would” and
similar expressions.

Statements set out in
this news release relating to the potential impacts on Avivagen from this
regulatory approval, future growth and prospects for Avivagen and the
possibility for OxC-beta™ Livestock to replace antibiotics in livestock feeds
as growth promoters are forward-looking statements. These forward-looking
statements are subject to a number of risks and uncertainties that could cause
actual results or events to differ materially from current expectations. For
instance, Avivagen’s products may not gain market acceptance or regulatory
approval in new jurisdictions or for new applications and may not be widely
accepted as a replacement for antibiotics as growth promoters in livestock
feeds due to many factors, many of which are outside of Avivagen’s control.
Readers are referred to the risk factors associated with the business of
Avivagen set out in Avivagen’s most recent management’s discussion and analysis
of financial condition available at www.SEDAR.com. Except as required by law,
Avivagen assumes no obligation to update the forward-looking statements, or to
update the reasons why actual results could differ from those reflected in the
forward-looking statements.

Neither TSX Venture
Exchange nor its Regulation Services Provider (as that term is defined in the
policies of the TSX Venture Exchange) accepts responsibility for the adequacy
or accuracy of this release.

For more information:
Avivagen Inc.
Drew Basek
Director of Investor Relations
100 Sussex Drive, Ottawa, Ontario, Canada K1A 0R6 Phone: 416-540-0733
E-mail: d.basek@avivagen.com

Kym Anthony
Chief Executive Officer
100 Sussex Drive, Ottawa, Ontario, Canada K1A 0R6 Head Office Phone: 613-949-8164

Website: www.avivagen.com
Copyright © 2022 Avivagen Inc. OxC-beta™ is a trademark of Avivagen Inc.

Release – Kelly Reports First-Quarter 2022 Earnings


Kelly Reports First-Quarter 2022 Earnings

Research, News, and Market Data on Kelly

  • Q1 revenue up 7.5%; 9.0% in constant currency
  • Q1 operating earnings of $23.4 million; up 121% from a year ago
  • Q1 loss per share of $1.23 down from a year ago on a non-cash loss on Persol Holdings investment
  • Adjusted EPS of $0.46 in Q1; up from $0.12 a year ago
  • Created $235M of liquidity by ending the cross-ownership between Kelly and Persol Holdings and reducing our ownership interest in PersolKelly, the companies’ joint venture in the APAC region
  • Completed the first quarter acquisition of RocketPower to strengthen our RPO practice and acquired Pediatric Therapeutic Services in May to extend our leading position in K-12 education

TROY, Mich., May 12, 2022 /PRNewswire/ — Kelly (Nasdaq: KELYAKELYB), a leading specialty talent solutions provider, today announced results for the first quarter of 2022.

Peter Quigley, president and chief executive officer, announced revenue for the first quarter of 2022 totaled $1.3 billion, a 7.5% increase, or 9.0% in constant currency, compared to the corresponding quarter of 2021. Revenue improved year-over-year in the quarter reflecting increased customer demand compared to the COVID-19-impacted prior year period, as well as the impact of the Q2 2021 acquisition of Softworld.

Earnings from operations in the first quarter of 2022 totaled $23.4 million, compared to $10.6 million reported in the first quarter of 2021. Earnings improved as a result of revenue growth combined with structural improvement in gross profit rate and expense leverage.

The loss per share in the first quarter of 2022 was $1.23 compared to diluted earnings per share of $0.64 in the first quarter of 2021. Included in the loss per share in the first quarter of 2022 is a loss, net of tax, on Kelly’s investment in Persol Holdings common stock of $1.26 per share compared to a gain, net of tax, of $0.52 per share in the first quarter of 2021. In addition, the loss per share in the first quarter of 2022 includes a $0.43 loss per share on non-cash foreign currency matters, net of tax, related to the dissolution of our Japanese subsidiary following the sale of the Persol Holding common shares. On an adjusted basis, earnings per share were $0.46 in the first quarter of 2022 compared to $0.12 in the corresponding quarter of 2021.

“Kelly’s first quarter performance proves that our growth strategy is paying off,” said Quigley. “We achieved significant year-over-year improvement in revenue; our GP rate reached its highest level in 25 years; and we more than doubled earnings from operations. At the same time, we’re acting quickly to redeploy capital and accelerate inorganic growth. Our acquisitions of RocketPower in March and Pediatric Therapeutic Services in May both expand Kelly’s presence in high-growth, high-margin specialties, and offer significant opportunities for top-line synergies moving forward.”  

Kelly also reported that on May 10, its board of directors declared an increased dividend of $0.075 per share.  The dividend is payable June 9, 2022, to shareholders of record as of the close of business on May 26, 2022 and represents a 50% increase.  Commenting on the dividend increase, Quigley said, “We are pleased that our improving operating results and strategic progress have given us the ability to return our dividend back to pre-pandemic levels and enhance shareholder value.”

In conjunction with its first-quarter earnings release, Kelly has published a financial presentation on the Investor Relations page of its public website and will host a conference call at 9 a.m. ET on May 12 to review the results and answer questions. The call may be accessed in one of the following ways:

Via the Internet:  

Kellyservices.com

Via the Telephone  

(877) 692-8955 (toll free) or (234) 720-6979 (caller paid)  
Enter access code 5728672  
After the prompt, please enter “#”

A recording of the conference call will be available after 2:30 p.m. ET on May 12, 2022, at (866) 207-1041 (toll-free) and (402) 970-0847 (caller-paid). The access code is 6759661#. The recording will also be available at kellyservices.com during this period.

This release contains statements that are forward looking in nature and, accordingly, are subject to risks and uncertainties. These factors include, but are not limited to, changing market and economic conditions, the impact of the novel coronavirus (COVID-19) outbreak, competitive market pressures including pricing and technology introductions and disruptions, disruption in the labor market and weakened demand for human capital resulting from technological advances, competition law risks, the impact of changes in laws and regulations (including federal, state and international tax laws), unexpected changes in claim trends on workers’ compensation, unemployment, disability and medical benefit plans, or the risk of additional tax liabilities in excess of our estimates, our ability to achieve our business strategy, our ability to successfully develop new service offerings, material changes in demand from or loss of large corporate customers as well as changes in their buying practices, risks particular to doing business with government or government contractors, the risk of damage to our brand, our exposure to risks associated with services outside traditional staffing, including business process outsourcing, services of licensed professionals and services connecting talent to independent work, our increasing dependency on third parties for the execution of critical functions, our ability to effectively implement and manage our information technology strategy, the risks associated with past and future acquisitions, including risk of related impairment of goodwill and intangible assets, risks associated with conducting business in foreign countries, including foreign currency fluctuations, risks associated with violations of anti-corruption, trade protection and other laws and regulations, availability of qualified full-time employees, availability of temporary workers with appropriate skills required by customers, liabilities for employment-related claims and losses, including class action lawsuits and collective actions, our ability to sustain critical business applications through our key data centers, risks arising from failure to preserve the privacy of information entrusted to us or to meet our obligations under global privacy laws, the risk of cyberattacks or other breaches of network or information technology security, our ability to realize value from our tax credit and net operating loss carryforwards, our ability to maintain specified financial covenants in our bank facilities to continue to access credit markets, and other risks, uncertainties and factors discussed in this release and in the Company’s filings with the Securities and Exchange Commission. Actual results may differ materially from any forward-looking statements contained herein, and we undertake no duty to update any forward-looking statement to conform the statement to actual results or changes in the Company’s expectations.

About Kelly®

Kelly Services, Inc. (Nasdaq: KELYA, KELYB) connects talented people to companies in need of their skills in areas including Science, Engineering, Education, Office, Contact Center, Light Industrial, and more. We’re always thinking about what’s next in the evolving world of work, and we help people ditch the script on old ways of thinking and embrace the value of all workstyles in the workplace. We directly employ more than 350,000 people around the world, and we connect thousands more with work through our global network of talent suppliers and partners in our outsourcing and consulting practice. Revenue in 2021 was $4.9 billion. Visit kellyservices.com and let us help with what’s next for you.

MEDIA CONTACT:


ANALYST CONTACT:

Jane Stehney


James Polehna

(248) 765-6864


(248) 244-4586

stehnja@kellyservices.com


james.polehna@kellyservices.com


https://kellyservices.gcs-web.com/news-releases/news-release-details/kelly-reports-first-quarter-2022-earnings


Release – Endeavour Silver Releases 2021 Sustainability Report


Endeavour Silver Releases 2021 Sustainability Report

Research, News, and Market Data on Endeavour Silver


VANCOUVER, British Columbia, May 12, 2022 (GLOBE NEWSWIRE) —
Endeavour Silver Corp. (“Endeavour” or the “Company”) (TSX: EDR, NYSE:
EXK) 
today published its 
2021 Sustainability
Report 
entitled “Bridge to the Future”. The report details the Company’s commitment to transparently disclose its targets and performance, while maintaining industry-leading corporate governance practices, and having a positive environmental and social impact while generating long-term value for all stakeholders.

“Despite the challenges of the persisting COVID-19 pandemic, we are proud of our 2021 performance, surpassing our key sustainability targets and addressing environmental and social issues that matter to our stakeholders,” stated Dan Dickson, CEO of Endeavour Silver. “We recognize that sustainability is imperative for our long-term success, including financial success. This year’s report, ‘Bridge to the Future’ speaks to our ongoing actions to help shape a more inclusive and sustainable tomorrow in which both our business and our stakeholders can prosper.”

The 2021 Sustainability Report and related performance tables are available on Endeavour’s 
website . Additionally, the Company is pleased to share a short video with CEO, Dan Dickson, as he talks about the past year’s achievements and future plans. The Endeavour blog also showcases recent stories of sustainability in action.

Earlier this year, Endeavour released its Sustainability Strategy 2022-2024 to further enhance the Company’s sustainability practices and impacts. Added Mr. Dickson: “Our three-year Sustainability Strategy charts our path to economic and social well-being, as we invest into the next phase of growth for the Company. By setting meaningful targets, we are confident that we will enhance our sustainability practices.”

2021 Performance Highlights
(All dollar amounts presented below are in U.S. dollars.)

Increasing Positive Social Impacts for Our People

  • Achieved a 42% reduction in the Reportable Injury Rate (RIR)
  • Provided an average of 44 hours of training to employees and contractors
  • Contributed $302,000 in community donations to help build resilient and thriving communities
  • Launched a company-wide program for mental health, with 50% of employees participating in mental health resources including counselling services

Elevating Environmental Stewardship of Our Planet

  • Reduced absolute greenhouse gas emissions intensity by 12% due to improved operating efficiencies
  • Planted 55,000 trees in reforestation projects to reclaim disturbed ground
  • Recycled 93% of water used in our operations
  • Reduced hazardous waste intensity by 21%

Leading a Healthy, Long Term Business

  • Developed a 3-year Sustainability Strategy that sets priorities and targets in three focus area: people, planet and business
  • 100% of our employees completed training on our Code of Business Conduct & Ethics
  • Spent $165 million on goods and services, 98.8% of which was from within Mexico.
  • Launched the “Endeavour Trust Line” to give stakeholders an online channel for reporting concerns https://edrsilver.com/about-endeavour/ethics-hotline/

The 2021 Sustainability Report is prepared in accordance with the Global Reporting Initiative (GRI) Standards, the Sustainability Accounting Standards Board (SASB) framework and the United Nations Sustainable Development Goals (SDGs). A Spanish version of the report will be available online in June 2022.

About Endeavour Silver – Endeavour Silver is a mid-tier precious metals mining company that operates two high-grade, underground, silver-gold mines in Mexico. Endeavour is currently advancing the Terronera mine project towards a development decision, pending financing and final permits and exploring its portfolio of exploration and development projects in Mexico, Chile and the United States to facilitate its goal to become a premier senior silver producer. Our philosophy of corporate social integrity creates value for all stakeholders.

SOURCE Endeavour Silver Corp.

Contact Information
Trish Moran
Interim Head of Investor Relations
Tel: (416) 564-4290
Email: pmoran@edrsilver.com

Website: 
www.edrsilver.com


Release – Voyager Digital Rolls Out 1-1 Live Messaging Support For Customers


Voyager Digital Rolls Out 1-1 Live Messaging Support For Customers

Research, News, and Market Data on Voyager Digital

Company continues to rapidly expand its personalized customer
support capabilities as well as multimedia information and education, building
on its “Crypto for All” initiative

NEW YORK, May 12, 2022 /CNW/ – Voyager Digital Ltd. (“Voyager” or the “Company”) (TSX: VOYG) (OTCQX: VYGVF) (FRA: UCD2), one of the fastest-growing consumer cryptocurrency platforms in the United States, today announced it is currently rolling out Live Messaging Support for Voyager customers, available through Voyager’s award-winning mobile app, from 8am – 8pm Eastern time, Monday through Friday.

“Voyager support is now as easy as a text with one of our expert team members,” said Steve Ehrlich, Voyager’s CEO and co-founder. “To keep pace with customer growth over the past 12 months, we have dramatically increased our highly-trained customer support team, adding specialists across the United States. Today, we are adding industry-leading tools and capabilities to connect this expertise with customers through a new, dynamic channel that continues our laser-focus on building a world-class, customer-first organization centered on digital assets.”

To access the new Live Messaging Support feature that provides text communication through the Voyager app with an expert support team member, customers can:

  • Go to the Voyager mobile app and tap on the “Accounts” symbol on the far right of the lower navigation bar.
  • Scroll to the “Help” section, then tap the “?” icon in the purple bubble in the lower right corner.

This will initiate a chat session with VAL, Voyager’s virtual assistant, that will either answer a customer’s question immediately, route directly to Live Messaging Support, or request that a ticket be submitted for more detailed analysis. Voyager’s Live Messaging Support seamlessly initiates a conversation with one of our team members, during available hours, starting a text thread that is accessible at the customer’s convenience.

Voyager plans to expand on this capability by providing live, text-based support through additional channels in the future. 

In addition to introducing Live Messaging Support, Voyager is expanding customer information and communication through a series of video conversations between Stephen Ehrlich and leading voices in the financial and crypto world, as well as high-profile Voyager customers. The company is also piloting a video component to its weekly Market Roundup. These videos can be viewed on
Voyager’s YouTube channel
.

About Voyager Digital Ltd.

Voyager Digital Ltd.’s (TSX: 
VOYG) (OTCQX: VYGVF) (FRA: UCD2) US subsidiary, Voyager Digital, LLC, is a fast-growing cryptocurrency platform in the United States founded in 2018 to bring choice, transparency, and cost-efficiency to the marketplace. Voyager offers a secure way to trade over 100 different crypto assets using its easy-to-use mobile application. Through its subsidiary Coinify ApS, Voyager provides crypto payment solutions for both consumers and merchants around the globe. To learn more about the company, please visit https://www.investvoyager.com.

The TSX has not approved
or disapproved of the information contained herein.

Press Contacts

Voyager Digital, Ltd.
Voyager Public Relations Team
pr@investvoyager.com

SOURCE Voyager Digital (Canada) Ltd.

Release – Sierra Metals Reports Consolidated Financial Results for the First Quarter Of 2022


Sierra Metals Reports Consolidated Financial Results for the First Quarter Of 2022

Research, News, and Market Data on Sierra Metals

Conference Call May 12, 2022 At 11:00 AM (EDT)

  ______________________________________________________________________
(All $ figures reported in USD)

  • Revenue from metals payable of $57.2 million in Q1 2022, an 18% decrease from $69.6 million in Q1 2021 and an 8% decrease from Q4, 2021.
  • Adjusted EBITDA of $16.0 million in Q1 2022, a 43% decrease from $27.9 million in Q1 2021 and a 15% decrease from Q4, 2021.
  • Operating cash flows before movements in working capital of $10.7 million in Q1 2022, a 58% decrease from $25.3 million in Q1 2021 and a 31% decrease of from Q4, 2021.
  • Copper equivalent production of 15.9 million pounds; a 38% decrease from Q1 2021 and an 11% decrease from Q4, 2021.
  • Cash costs and AISC per copper equivalent payable pound compared to Q1 2021 increased at Yauricocha 48% and 41% respectively; at Bolivar cash costs and AISC per copper equivalent payable pound increased by 187% and 152%, respectively, driven by higher costs and lower copper equivalent pounds payable; and at Cusi cash costs per silver equivalent payable ounce decreased by 28% and 34%, respectively.
  • Net income attributable to shareholders for Q1 2022 was $0.4 million (Q1 2021: $3.1 million) or $0.00 per share (basic and diluted) (Q1 2021: $0.02);
  • Adjusted net income attributable to shareholders (1) of $5.9, or $0.04 per share, for Q1 2022 as compared to the adjusted net income of $4.7 million, or $0.03 per share for Q1 2021;
  • After reaching the Bolivar Northwest orebody at the end of Q1 2022, a continued focus on meeting maximum permitted throughput at Yauricocha and an increase in throughput with higher grades at Cusi, production is on track to reach the Company’s H1 guidance of 34.0 to 39.5 million copper equivalent pounds.
  • $19.5 million of cash and cash equivalents as at March 31, 2022 .
  • $61.6 million in net debt as at March 31, 2022.

A
shareholder conference call to be held Thursday, May 12, 2022, at 11:00 AM
(EDT). Click here to register.

Luis
Marchese, CEO of Sierra Metals, commented, “Following a difficult start to
the year, the Company continues on its path towards operational recovery.
During the first quarter, lower throughput and grades resulted in a decrease in
the production of all metals along with significant increases to cash costs and
all-in sustaining costs at both Yauricocha and Bolivar.

He
continued, “Our turnaround program continues at Bolivar. With close to 20,000
meters in exploration drilling completed, we have now accessed the Bolivar
NorthWest zone, which is expected to provide ore for the next several quarters.
As previously stated, production at the Mine is expected to improve for the
balance of the year as we ramp up production to full capacity. Additionally,
with the discovery of the new Fortuna zone at Yauricocha, we expect to see an
improvement in throughput and grades during the second half of the year.
Continued drilling will help us better understand the patterns within the high
grade orebody and provide potential to find additional high value targets.
Meanwhile, we are pleased with Cusi’s performance during the first quarter. As
a result of increased throughput and higher grades, the Mine is on track to
meet production guidance for the year and continue its positive contribution to
the Company’s EBITDA. Mine development at Cusi will continue with the goal of
targeting a throughput increase to 1,200 tonnes per day.”

He
concluded, “The outlook for a full recovery at our largest mines is
encouraging. With the first quarter behind us, we continue to proceed in a
disciplined manner. Our goal is to ensure that our current guidance is met and
that we are making the right decisions now for future performance at our mines,
so that we can deliver improved value for our shareholders going forward.”

TORONTO–(BUSINESS WIRE)– 
Sierra Metals Inc. (TSX: SMT) (BVL: SMT) (NYSE AMERICAN: SMTS) (“Sierra Metals” or “the Company”) today reported revenue of $57.2 million and an adjusted EBITDA of $16.0 million on the throughput of 590,730 tonnes and metal production of 15.9 million copper equivalent pounds for the three-month period ended March 31, 2022.

This press release features multimedia. View the full release here: https://www.businesswire.com/news/home/20220511005888/en/

Q1
2022 Consolidated Operating Highlights

The Yauricocha Mine achieved a throughput of 315,250 tonnes or 3% lower in Q1 2022 compared to Q1 2021. This 3% decrease was due to delays in shotcrete work resulting from lower equipment availability and shortage of manpower. Labor shortages were also experienced in development and mining areas due to the continued impact of COVID-19. The delays in preparation of the polymetallic mining zones forced the mine to focus on copper sulfides during the quarter, which resulted in higher copper head grades, but negatively impacted grades for all other metals, except gold. Q1 2022 copper and gold production was 60% and 19% higher, while silver, lead and zinc production was 43%, 56% and 57% lower respectively as compared to Q1 2021. Lower throughput combined with the impact of lower grades, except for copper and gold, resulted in a 32% decrease in copper equivalent pounds produced in Q1 2022 compared to Q1 2021. Cash costs per copper equivalent payable pound increased 48% and AISC per copper equivalent payable pound increased by 41% as compared to Q1 2021.

The Bolivar Mine processed 187,556 tonnes in Q1 2022, representing a 50% decrease from tonnes processed in Q1 2021. Ore tonnage and grades at Bolivar in Q1 2022 were negatively impacted due to the presence of intrusive rock in the Mina de Fierro zone and lower than expected grades from the Bolivar West ore body. Grades for copper, silver and gold were 25%, 44% and 16% lower respectively, as compared to Q1 2021. The decrease in throughput and grades resulted in a 64% decrease in copper equivalent pounds produced during Q1 2022 as compared to Q1 2021. Production is expected to improve for the balance of the year, in particular, during the second half of 2022, due to the full turn-around effort currently underway. Mining started in the Bolivar Northwest zone, which is expected to support the bulk of production for the coming quarters. Cash costs and AISC per copper equivalent payable pound increased by 187% and 152%, respectively, as compared to Q1 2021.

The Cusi Mine achieved a 15% increase in throughput at 11% higher silver grades during Q1 2022, resulting in 37% higher silver equivalent production as compared to Q1 2021 as higher head grades resulted from positive reconciliations to the resources in the mined zones. Cusi production is on track to meet production guidance for the year. Cash costs and AISC per silver equivalent ounce decreased by 28% and 34%, respectively, as compared to Q1 2021.

Consolidated production of silver decreased 24% to 0.7 million ounces, copper decreased 20% to 6.3 million pounds, lead decreased 53% to 4.2 million pounds, zinc decreased 57% to 10.5 million pounds, and gold decreased 27% to 1,923 ounces compared to Q1 2021.

Q1
2022 Consolidated Financial Highlights

Revenue from metals payable of $57.2 million in Q1 2022 decreased by 18% from $69.6 million in Q1 2021. The decrease in revenues was largely the result of lower throughput at the Bolivar mine and lower grades from the Bolivar and Yauricocha mine. Higher average realized prices for all metals, except silver, could not compensate for the lower metals production.

Yauricocha’s cash cost per copper equivalent payable pound was $2.19 (Q1 2021 – $1.48), and AISC per zinc equivalent payable pound of $3.73 (Q1 2021 – $2.65). Higher unit costs resulted from a 37% decrease in copper equivalent payable pounds.

Bolivar’s cash cost per copper equivalent payable pound was $4.55 (Q1 2021 – $1.58), and AISC per copper equivalent payable pound was $7.33 (Q1 2021 – $2.91) for Q1 2022. Unit costs at Bolivar increased as the 50% decrease in tonnage processed resulted in higher operating costs per tonne. Further, lower grades resulted in a 56% decrease in the copper equivalent payable pounds as compared to Q1 2021.

Cusi’s cash cost per silver equivalent payable ounce was $13.48 (Q1 2021 – $18.72), and AISC per silver equivalent payable ounce was $19.94 (Q1 2021 – $30.28) for Q1 2022 as compared to Q1 2021. Unit costs for Q1 2022 declined at Cusi due to the 49% increase in the silver equivalent payable ounces sold as compared to Q1 2021.

Adjusted EBITDA(1) of $16.0 million for Q1 2022 decreased compared to $27.9 million in Q1 2021. The decrease in adjusted EBITDA in Q1 2022 resulted from lower revenues and lower gross margins as compared to Q1 2021.

Net income attributable to shareholders for Q1 2022 was $ 0.4 million (Q1 2021: $3.1 million) or $0.00 per share (basic and diluted) (Q1 2021: $0.02).

Adjusted net income attributable to shareholders (1) of $5.9 million, or $0.04 per share, for Q1 2022 as compared to the adjusted net income of $4.7 million, or $0.03 per share for Q1 2021.

Cash flow generated from operations before movements in working capital of $10.7 million for Q1 2022 decreased compared to $25.3 million in Q1 2021. The decrease in operating cash flow is mainly the result of lower consolidated revenues generated and lower gross margins realized.

Cash and cash equivalents of $19.5 million and working capital of $12.4 million as at March 31, 2022 compared to $34.9 million and $17.3 million, respectively, at the end of 2021. Cash and cash equivalents decreased during Q1 2022 due to $3.9 million used in operating cash activities, $10.7 million of cash used in investing activities and $0.9 million used in financing activities.

The Company has access to an available credit line with a Peruvian Bank in the amount of US$14 million as well as other short term lines and prepayment facilities with its commercial offtakers.

(1) This is a non-IFRS performance measure. See the Non-IFRS Performance Measures section of the MD&A.

Outlook
2022

Yauricocha:

  • Lost production during Q1/2022 is expected to be recovered in the coming quarters by making use of spare capacity at the plant, with increased throughput. Our drilling campaign remains focused on the upper areas of the mine to identify new mineable areas within the permitted levels.
  • Expect to access the newly discovered high grade Fortuna orebody as early as Q3, 2022.
  • Yauricocha Mine remains on track to achieve copper equivalent production guidance of 45 to 49 million copper equivalent pounds.

Bolivar:

  • Expect improved production for the balance of 2022, in particular, during the second half of the year, due to the full turn-around effort currently underway. Mining started in the Bolivar NW zone, which is expected to support the bulk of the production for the coming quarters.
  • Infill drilling and development will continue.
  • Bolivar Mine is expected to meet copper equivalent production guidance of 23.8 to 29.9 million copper equivalent pounds.

Cusi:

  • Focus on development to target throughput of 1,200 TPD.
  • Cusi Mine is on track to meet production guidance of 1.75 million to 1.85 million silver equivalent ounces.

Exploration
Update

Peru:

During the first quarter, 2,053 meters of surface exploration was completed in the Yauricocha Medio (1,095 meters), Kilcasca (449 meters), Exito (373 meters) and Fortuna (136 meters) zones;

Underground exploration continued during Q1 2022 with the aim to replace and increase mineral resources. Approximately 4,213 meters of drilling was completed mainly in France Chert, Adrico Sur and Amoeba zones;

Drilling during the first quarter allowed for the recent discovery of the Fortuna zone, which belongs to system of high-grade polymetallic bodies associated with structural traps. A structural analysis of the area as well as further drilling is required, to understand the patterns for the presence of this type of orebody. A program of at least 1,500 meters of additional drilling is proposed.

An analysis of the structural patterns within the Fortuna orebody with a review of geophysical information to look for correlations, can allow for important targets for future additional drilling.

Mexico:

Bolivar

At Bolivar during Q1 2022, 19,739 meters were drilled from surface including 780 meters drilled in the Bolivar West, 13,353 meters in the Bolivar North-West and 441 meters in the Gallo Inferior encountering skarn intersections with mineralization in all the zones. Additionally, infill drilling of 2,078 meters was completed in the Bolivar West zone and 3,087 meters in the Gallo Inferior (Mina de Fierro).

Additional exploration will focus on 2 areas:

Bolivar East, an area of high grade zinc, silver and gold. The Company is currently carrying out geochemistry analysis as well as a review of geophysics with the aim of initiating a drilling campaign later this year; and

La Sidra, a high grade epithermal system of silver and gold. Necessary drilling permits are already in place for this zone. The zone lies within close proximity to current operations, potentially allowing for improved mineral value to support the Bolivar mine.

Cusi

During Q1 2022, the Company completed 7,092 meters of infill drilling to support the development of the Santa Rosa de Lima vein and NE Trend.

The exploration focus in the short term is to continue investigating the NE SW system as it has significant potential, both laterally and at depth.

Covid-19
Update

The COVID-19 pandemic has impacted the Company’s operations, and this is reflected in delays in mine development and preparation of areas for mining and consequent lower head grades. Lower volume of sales is a result of decrease in concentrate production attributable to lower grades. Costs are also negatively impacted mainly due to indirect fixed costs which have to be incurred, despite lower production. The Company continues to take proactive and reactive mitigation measures to minimize any potential impacts COVID-19 may have on its employees, communities, operations, supply chain, and finances.

During the quarter ended March 31, 2022, the Company has continued its efforts to safeguard the health of its employees, while continuing to operate safely. During this quarter, the company still suffered some delays in mine development leading to lower head grades, and forced deferral of some exploration and capital projects.

Due to the current vaccination efforts at Yauricocha, 100% of onsite personnel have been vaccinated with three doses, significantly reducing any further risk of serious infection caused by COVID. The Company is constantly updating its guidelines by closely following the health updates issued by the Peruvian government.

In Mexico, there has been significant progress with the vaccination program. Currently, most personnel at Bolivar and Cusi are vaccinated with at least two doses with plans to achieve full vaccination with three doses by the end of Q3 2022.

Conference
Call and Webcast

Sierra Metals’ senior management will host a conference call on Thursday, May 12, 2022, at 11:00 AM (EDT) to discuss the Company’s financial and operating results for the three months ended March 31, 2022.

Via
Webcast:

A live audio webcast of the meeting will be available on the Company’s website:

https://event.on24.com/wcc/r/3724262/ABA56A91A50DA5A991E18125DC207388

The webcast, along with presentation slides, will be archived for 180 days on www.sierrametals.com.

Via
phone:

For those who prefer to listen by phone, dial-in instructions are below. To ensure your participation, please call approximately five minutes prior to the scheduled start time of the call.

US/CAN dial-in number (Toll Free): 1 844 200 6205
US dial-in number (Local): 1 646 904 5544
Canada dial-in number (Local): 1 226 828 7575
All other locations: +1 929 526 1599
Access code: 020167
Press *1 to ask a question, *2 to withdraw your question, or *0 for operator assistance.

Qualified
Persons

Américo Zuzunaga, FAusIMM CP (Mining Engineer) and Vice President of Corporate Planning, is a Qualified Person under National Instrument 43-101 – Standards of Disclosure for Mineral Projects.

About
Sierra Metals

Sierra Metals Inc. is a diversified Canadian mining company with Green Metal exposure including increasing copper production and base metal production with precious metals byproduct credits, focused on the production and development of its Yauricocha Mine in Peru, and Bolivar and Cusi Mines in Mexico. The Company is focused on increasing production volume and growing mineral resources. Sierra Metals has recently had several new key discoveries and still has many more exciting brownfield exploration opportunities at all three Mines in Peru and Mexico that are within close proximity to the existing mines. Additionally, the Company also has large land packages at all three mines with several prospective regional targets providing longer-term exploration upside and mineral resource growth potential.

The Company’s Common Shares trade on the Bolsa de Valores de Lima and on the Toronto Stock Exchange under the symbol “SMT” and on the NYSE American Exchange under the symbol “SMTS”.

Continue to Follow, Like and Watch our progress:

Webwww.sierrametals.com | Twittersierrametals | FacebookSierraMetalsInc | LinkedInSierra Metals Inc | Instagramsierrametals

Forward-Looking
Statements

This press release contains “forward-looking information” and “forward-looking statements” within the meaning of Canadian and U.S. securities laws (collectively, “forward-looking information”). Forward-looking information includes, but is not limited to, statements with respect to the date of the 2021 Shareholders’ Meeting and the anticipated filing of the Compensation Disclosure. Any statements that express or involve discussions with respect to predictions, expectations, beliefs, plans, projections, objectives, assumptions or future events or performance (often, but not always, using words or phrases such as “expects,” “anticipates,” “plans,” “projects,” “estimates,” “assumes,” “intends,” “strategy,” “goals,” “objectives,” “potential” or variations thereof, or stating that certain actions, events or results “may,” “could,” “would,” “might” or “will” be taken, occur or be achieved, or the negative of any of these terms and similar expressions) are not statements of historical fact and may be forward-looking information.

Forward-looking information is subject to a variety of risks and uncertainties, which could cause actual events or results to differ from those reflected in the forward-looking information, including, without limitation, the risks described under the heading “Risk Factors” in the Company’s annual information form dated March 16, 2022 for its fiscal year ended December 31, 2021 and other risks identified in the Company’s filings with Canadian securities regulators and the United States Securities and Exchange Commission, which filings are available at www.sedar.com and www.sec.gov, respectively.

The risk factors referred to above are not an exhaustive list of the factors that may affect any of the Company’s forward-looking information. Forward-looking information includes statements about the future and is inherently uncertain, and the Company’s actual achievements or other future events or conditions may differ materially from those reflected in the forward-looking information due to a variety of risks, uncertainties and other factors. The Company’s statements containing forward-looking information are based on the beliefs,

expectations, and opinions of management on the date the statements are made, and the Company does not assume any obligation to update such forward-looking information if circumstances or management’s beliefs, expectations or opinions should change, other than as required by applicable law. For the reasons set forth above, one should not place undue reliance on forward-looking information.

View source version on 
businesswire.comhttps://www.businesswire.com/news/home/20220511005888/en/

For further information regarding Sierra Metals, please visit www.sierrametals.com or contact:

Investor
Relations

Sierra Metals Inc.
+1 (416) 366-7777
Email: 
info@sierrametals.com

Luis
Marchese

CEO

Sierra Metals Inc.
+1(416) 366-7777

Source: Sierra Metals Inc.


Release – Comtech Promotes Timothy Jenkins to President of its Safety & Security Technologies Product Group


Comtech Promotes Timothy Jenkins to President of its Safety & Security Technologies Product Group

Research, News, and Market Data on Comtech Telecommunications

Jenkins to succeed Kent Hellebust, who is retiring end of
May

MELVILLE, N.Y.–(BUSINESS WIRE)–May 12, 2022– May 12, 2022– Comtech Telecommunications Corp. (NASDAQ: CMTL), a leading global provider of next-generation 911 emergency systems and secure wireless communications technologies, today announced that Timothy Jenkins will become President of its Safety and Security Technologies product group, effective as of June 1, 2022.

Jenkins has been with Comtech for over three years, joining the company through its 2019 acquisition of the state and local government next-generation 911 business from General Dynamics Information Technology, Inc. Most recently, he has served as Group Vice President and General Manager within the Safety and Security Technologies organization, leading the implementation of next-generation 911 capabilities for customers across the United States. Jenkins has been involved in the public safety and 911 industry for over 28 years, serving in leadership positions at Ameritech and SBC Communications (subsequently acquired by AT&T) and Intrado.

Kent Hellebust, the current President of Comtech’s Safety and Security Technologies product group, will be retiring as of May 31, 2022, after serving in the role since April 2018. This culminates Hellebust’s decade of service at Comtech after joining in January 2012 and holding a variety of leadership roles related to the 911 business.

Mike Porcelain, Comtech President and CEO, commented, “Tim has played a key role in the growth and development of our next-generation 911 product line. He has been an invaluable contributor to the organization, leading customer operations and support. I look forward to Tim’s continued leadership and contributions to Comtech as he assumes the role of President.”

“We want to thank Kent for his outstanding leadership, significant contributions and dedicated commitment to Comtech throughout his distinguished career. Kent has worked diligently to lead, support and grow our next-generation 911 product line throughout his time at Comtech. We wish Kent the very best as he retires and moves into the next chapter.”

About Comtech

Comtech Telecommunications Corp. is a leading global provider of next-generation 911 emergency systems and secure wireless communications technologies to commercial and government customers around the world. Headquartered in Melville, New York and with a passion for customer success, Comtech designs, produces and markets advanced and secure wireless solutions. For more information, please visit www.comtechtel.com (and preview its new website at www.comtech.com).

Forward-Looking
Statements

Certain information in this press release contains statements that are forward-looking in nature and involve certain significant risks and uncertainties. Actual results could differ materially from such forward-looking information. The Company’s Securities and Exchange Commission filings identify many such risks and uncertainties. Any forward-looking information in this press release is qualified in its entirety by the risks and uncertainties described in such Securities and Exchange Commission filings.

PCMTL

View source version on businesswire.comhttps://www.businesswire.com/news/home/20220511006088/en/

Investor
Relations

Robert Samuels
631-962-7102

robert.samuels@comtech.com

Source: Comtech Telecommunications Corp.


Your Alt-Self in the Metaverse Office as an Avatar


Image Credit: lyncconf.com (Flickr)


Working in the Metaverse: what Virtual Office Life Could Look Like

In the context of work, the digital divide has become less about access to devices and connectivity and more about skills and mindset. Many experienced professionals have never learned more than the rudimentary basics of email, web search and Microsoft Office. Instead, they lean hard on nearby colleagues or the IT helpdesk when things go wrong.

By contrast, young people have already demonstrated a competitive edge in the virtual workplace. They come equipped with a more intuitive grasp of digital technology and the initiative to troubleshoot problems via YouTube tutorials, social media and subreddits.

As a generation, they’re also bigger gamers. As more and more work takes place in virtual reality (VR) – and one does not have to share the somewhat eccentric vision of the metaverse Mark Zuckerberg articulated at the 2021 Connect Conference to believe that it will – being familiar with massively multiplayer online games (MMOs) like Fortnite and Roblox, not to mention the ability to manage multiple digital identities, is set to make that edge keener still.

Much of the metaverse is still to be built. VR, of course, has long been used in training for certain physical jobs, from astronauts and pilots to law enforcement, surgery and manufacturing. When it comes to specialist machinery or complex locations, the relative safety and cost advantages of training virtually are obvious. But it is in knowledge work – from software engineering to law to design – where the changes will be most profound.


VR offers up new possibilities for extracurricular team activities. naratrip

How Virtual Workplaces Can Improve Communication

For most people, remote working during the pandemic has been characterised by alt-tabbing between communications apps and videoconferencing platforms such as Slack, Teams and Miro. And there is certainly a lot of room for improvement there.

Academic studies have found that collaborative work between colleagues suffers when they work remotely. Exchanges over email or Slack increasingly replace real-time in-person conversations, hampering communication.

Google itself has claimed that informal chats at coffee machines and lunch tables in its campus were responsible for innovations such as Street View and Gmail. But, with remote working, this kind of serendipitous encounter all but disappears.

And of course there are costs to remote working, in terms of individual wellbeing too. Stanford researchers have found that so-called “Zoom fatigue” is driven by a combination of intense eye contact, lack of mobility, self-consciousness about one’s own video feed, and the cognitive demands of needing to give exaggerated feedback to signal understanding, agreement or concern.

Technological advances mean solutions to these problems related to remote working are becoming possible. Collaboration software such as Meta’s Horizon Workrooms and Microsoft Mesh, which allow colleagues to meet as avatars in VR or take part in a real-world meeting as a photo-realistic hologram, are already available.

The metaverse 1.0 will no doubt see organisations creating persistent VR workplace environments, in which employees can interact in real time as embodied avatars. VR versions of office spaces can be designed to encourage chance encounters and corridor chats.

Imagine, for example, if going from one remote meeting to another involved leaving the conference room and crossing a bustling virtual atrium. That might sound far-fetched but bear in mind that Korean PropTech company Zigbang has already opened a 30-floor VR office called Metapolis. Employees choose an avatar and navigate to their desks via elevators and corridors. When they meet a colleague’s avatar, their webcam and mic are activated so they’re able to have a conversation. The webcam and mic then turn off automatically as their avatar walks away.

Meanwhile, the ability to use and read body language and actively participate in group discussions by scribbling post-it notes or drawing on a virtual whiteboard should make remote meetings in VR more engaging and less sedentary. They require much more active use of the neck, shoulders, arms and hands than a typical hour on Zoom.

How to Work as an Avatar

It seems likely that a new set of workplace norms will emerge as the metaverse develops. Team games, including virtual bowling nights and virtual ping-pong tournaments, might supplant Zoom drinks as the default remote working social event.

When it comes to hiring, meanwhile, VR could bring distinct benefits. “Blind” auditions have been shown to significantly increase the representation of female musicians in symphony orchestras. It follows that interviewing as an avatar might diminish the effect of bias –- unconscious or otherwise –- against people on the basis of their gender, age or appearance.

Just as custom “skins” (outfits) are a feature of many MMOs, in the virtual world of work, there may well be demand for creativity in virtual fashion and accessories too, as people seek to express their personal brand within the constraints of professional dress codes for avatars. Gucci has already sold virtual hats, handbags, and sunglasses on the MMO platform Roblox.

Young people have been the worst affected by the disruption COVID has caused to the job market. While some struggled with working productively from a shared house or their parents’ homes, others were scammed into joining companies that did not even exist.

Nonetheless, the pandemic has also brought exciting glimpses of how remote working might evolve. Due to public health concerns and climate pressure, the latter is here to stay. As it develops into the metaverse, it will continue to bring capabilities that are concentrated among younger people to the fore.

This article was republished with permission from The Conversation, a news site dedicated to sharing ideas from academic experts. It was written by and represents the research-based opinions of Sam Gilbert, Affiliated Researcher, Bennett Institute for Public Policy, University of Cambridge.


Suggested Reading


Walmart’s Metaverse, NFT, and Crypto Plans


The Metaverse is Under Construction, Here’s What is Known


Metaverse: Is The Future Real? – Panel Presentation from NobleCon18


Motorsport Games (MSGM) NobleCon18 Presentation Replay


Stay up to date. Follow us:


What is a Small-Cap Stock (In 500 Words or Less)


Small-Cap Stocks and How They’re Different

Shares of public companies with a total market capitalization between $300 million to $2 billion are categorized as small-cap.

Market capitalization is determined by taking a stock’s share price and multiplying it by all of the outstanding shares. If the product comes to between $300 million and $2 billion, it fits the definition of small-cap.

Example

ABC Company Share Price: $4.25

Shares Outstanding: 400 Million

Market Capitalization: $4.25 x 400,00,00 =

$1.7 Billion

The above example shows ABC Company trading at $4.25 per share. There are $400 million shares outstanding – by multiplying $4.25 by 400 million, it reveals the company has a market cap of $1.7 billion –  $1.7 billion is between $200 million and $2 billion, so it is categorized as a small-cap company.

Market-cap data is available for small-cap stocks on Channelchek and other websites that provide investor information on companies.

Why is it Important?

Investors generally view stocks in three size categories: large, mid, and small-cap. Some even add two other categories they call microcap and megacap.

Knowing a company’s size, measured by market capitalization, is useful information for investors, here’s why:

Small-cap companies can exist in any industry. The difference between the smaller company and those with larger capitalization in the same business is that smaller companies have an increased potential for growth. Smaller companies are also more prone to being acquired. A company that gets acquired usually does at a share price above market levels.  

Another possible benefit is small companies usually have a more focused business line which allows investors the ability to fine-tune their concentration. To understand this, take a small one-product company that gets FDA approval for the only drug it has been working on for years. Its share price would likely skyrocket. If a large-cap company like Johnson and Johnson got approval for a drug that is just as effective, the impact on J&J’s earnings would not be as impactful for the stock price.

This is because the larger J&J also sells many other products. The stock price of the small company typically would show a much greater impact. This is true of growth, earnings, profit, and market-cap which is watered down when you’re larger.

There are unique risks to small-cap companies as well. Take the company I just mentioned that has just one drug that received FDA approval. What if the drug was turned down? They don’t have other products they can sell to offset costs.

 Most larger company stocks were at one time small-cap stocks.

Performance

Small-cap stocks can also experience larger than average price swings. But, if you’re a long-term investor, it may be worth it.

In the past 20 years, the S&P SmallCap 600 index, a leading benchmark for small-cap stocks, has outperformed the S&P indexes for large- and mid-caps on an average yearly basis. During that period, the S&P’s benchmark small-cap index returned an average of *8.3% annually, compared to 8% and 6.3% from its mid- and large-cap indexes.

Because of their size, small-cap stocks have different risks and rewards for investors when compared to their larger counterparts.

Paul Hoffman

Managing Editor, Channelchek

Suggested Content


What Is a Tender Offer?


What is the Yield Curve?


Stay up to date. Follow us:


Are Stablecoin Markets Signaling a Crypto Crisis?


Image Credit: QuoteInspector.com (Flickr)


Will the Current Stablecoin Situation Hasten Regulation and Oversight?

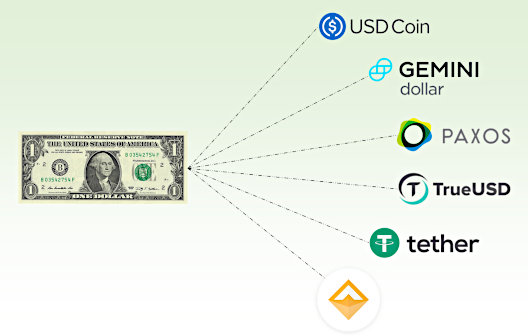
A move toward regulating digital currencies is gaining momentum in the U.S., and elsewhere – stablecoins could be the first cryptocurrency to be handed a rulebook. The variety of Stablecoin that is designed with algorithms to provide one-for-one parity with the U.S. dollar value, are finding it difficult or impossible to remain pegged to the fiat currency. The strong onset of negative sentiment in the crypto markets has already caused some of these less speculative cryptocurrencies to “break-the buck.”  True oversight may be in the best interest of preserving these new asset types, but the loss of autonomy may undermine their purpose and popularity.

The Current Concern

The attraction of stablecoins is they are designed to maintain a fixed value yet still allow for payments without getting the banking system involved. The larger stablecoins, Tether (USDT-USD) and USD Coin (USDC), have maintained their dollar pegs. But another once rising star the “algorithmic” stablecoin called TerraUSD (UST) crashed as low as $0.23 on the dollar this past week. The current price (May 12) is approximately $0.46. The decline in value of UST-USD caused $10 billion in the stablecoin to evaporate. A related crypto token called Luna (LUNA) or Terra Luna caused even greater losses. Terra Luna is down 99.6% today. This is contributing to the selloff crypto speculators are seeing in other digital currencies such as Bitcoin (BTC).

Some are likening the Terra collapse to the “Lehman Brothers moment,” referring to the surprise collapse of the once investment bank. Lehman woke markets up as to the severity of the 2008 financial crisis. The domino effect spurred by its wake-up call signaled the beginning of the awareness to problems the banking system was dealing with.

Is it a Crisis?

Is this a crypto or stablecoin crisis? The Terra losses may be an isolated event that is confined to tokens that either have a different mathematical basis or are especially vulnerable to market volatility. But it highlights risks that have always been inherent in these assets and may indicate a need to evolve with or without the help of regulatory guidance and oversight. The usefulness of stablecoins is diminished if they become one of the more controversial types of traded tokens and payment methods.

Stablecoins are already causing concern among regulators and bankers because, among other things, the money supply is impacted by privately issued digital money. A run on a stablecoin could, in theory, lead to heavy selling in assets held in reserves, such as short-term commercial debt or other cash equivalents. There has also been concern since their growth in popularity that stablecoins are substitutes for Federal Reserve Notes. The problem could be that they bypass the system that measures capital flows in global transactions and other cross-border exchanges. This was recently highlighted as both Russia and Ukraine were able to get around any attempts to shut down exchanges of currency, of the crypto variety, into or moving outside the countries.

Regulation

U.S. Regulators and lawmakers have expressed other concerns related to protecting users of any type of non-regulated token. One is about the liquidity and quality of issuers’ reserve assets. Banks are structured and have oversight to make sure they can meet redemption requests. This is why we don’t have concerns about a run on banks any longer. Panic redemptions of stablecoins or other tokens could have the same economic unsettling impact as a run on banks.  

Tether considered the preferred stablecoin is still not transparent about its holdings. The company, based in the British Virgin Islands, issues a quarterly “assurance opinion” on its reserves from a Cayman Islands auditor. It shows more than 80% of its reserves were held in Treasurys, cash, certificates of deposit, and money-market funds at the end of December. Details about other holdings are barely defined. This includes $4.1 billion in “secured loans”; $3.6 billion in “corporate bonds, funds, and precious metals”; and $5 billion in “other investments,” including “digital tokens.”

To date, Tether has never refused a redemption.

The White House, for its part, wants coin issuers under federal supervision, potentially even carrying FDIC deposit insurance. Biden called on Congress to pass supervisory rules for stablecoins in a recent executive order.

Congress is also working on a variety of rules for stablecoins; a draft bill in the Senate would establish a process for banks and credit unions to issue stablecoins, among other measures.

Another concern of the house-of-cards variety is that crypto exchanges hold large amounts of Tether for market-making and trading liquidity. If Tether were to stop trading 1:1 with the U.S. Dollar, it could impact other crypto trading, which could impact crypto brokerages.

Take-Away

The future of independent stablecoins and other cryptocurrencies may hinge on what is occurring in these markets now. Stablecoins are now widely used as de facto dollars for cryptocurrency exchange. Tether, which has not shown signs of problems is widely used. So while stablecoins are only 12% of the cryptocurrency market, the trading volume is high.

Algorithmic-based coins now appear to be more vulnerable than those backed by assets such as Treasuries, CDs and cash equivalents. Those that are least transparent could also be valuable, but they will for now be considered riskier.

Paul Hoffman

Managing Editor, Channelchek

Suggested Content


Global Regulators Release Principles for Financial Market Infrastructures to Stablecoin


Stealth Digital Asset Bill Surprises Crypto Market


The Federal Reserve Continues to Equivocate on Crypto


Safe Haven Comparison During Downturns, Bitcoin vs. Gold

Sources

Stay up to date. Follow us:


Release – Lineage Cell Therapeutics Reports First Quarter 2022 Financial Results and Provides Business Update


Lineage Cell Therapeutics Reports First Quarter 2022 Financial Results and Provides Business Update

  • Reported RG6501 (OpRegen®)
    Clinical Results at 2022 ARVO Meeting; Outer Retinal Structure Improvement
    Observed in Five Dry AMD Patients
  • Expanded Pipeline with Two New Cell Therapy
    Development Programs; Auditory Neurons and Photoreceptors
  • Announced Completion of Enrollment in VAC2
    Phase 1 NSCLC Study by Cancer Research UK
  • Cash and Cash Equivalents of $78.1
    Million as of March 31, 2022

CARLSBAD, Calif.–(BUSINESS WIRE)–May 12, 2022– Lineage Cell
Therapeutics, Inc.

 (NYSE American and TASE: LCTX), a clinical-stage biotechnology company developing allogeneic cell therapies for unmet medical needs, today reported financial and operating results for the first quarter of 2022. Lineage management will host a conference call and webcast today at 4:30 p.m. Eastern Time/1:30 p.m. Pacific Time to discuss its first quarter 2022 financial and operating results and to provide a business update.

“The first quarter of this year was highlighted by the rapid launch of new cell therapy programs in hearing loss and vision disorders and conducting tech transfer activities to support our alliance with Roche and Genentech for our dry AMD program,” stated Brian M. Culley, Lineage CEO. “Our broad strategic plan is to position Lineage as a leader in regenerative medicine through the transplant of specific cell types to treat significant unmet medical needs. As part of that plan, we have expanded our cell therapy pipeline to five distinct programs, each offering an opportunity to impact various diseases. We believe our ability to, in just a matter of months, advance from a product concept to generating new intellectual property to support the manufacture of specific cell types, is not only illustrative of the power and efficiency of our platform but also a competitive advantage compared to others in this field. Looking forward, our focus is on clinical and regulatory execution across our portfolio. We are working to advance OPC1 and VAC2 into their next phases of clinical testing, in spinal cord injury and oncology, respectively, as well as advancing our auditory neuron and photoreceptor programs through preclinical development and toward pre-IND meetings with FDA. We believe the combination of our disciplined use of capital and current balance sheet will support multiple years of progress, during which we anticipate reaching significant events with each of our clinical and preclinical programs.”

Recent
milestones include:

  • Reported RG6501 (OpRegen) Phase 1/2a clinical results at 2022 Association for Research in Vision and Ophthalmology, Inc. (ARVO) annual meeting: 12-month primary endpoint data support the potential for OpRegen to slow, stop or reverse disease progression in geographic atrophy (GA) secondary to age-related macular degeneration (AMD); outer retinal structure improvement observed in five dry AMD patients;
  • Announced expansion of pipeline with addition of new cell therapy program: allogeneic photoreceptor neural cell (PNC1) transplants for the treatment of diseases which may lead to blindness; dynamic culturing process offers path to clinical- and industrial-scale production of photoreceptors; data generated further demonstrated that a single cell suspension of photoreceptor precursor cells has the potential to survive and mature post-transplantation in a rodent model of retinal degeneration;
  • Announced completion of patient enrollment in Phase 1 clinical study of VAC2 for the treatment of non-small cell lung cancer (NSCLC) by Cancer Research UK; Lineage has now assumed responsibility for further clinical development of VAC2 and any future development opportunities derived from the VAC platform; and
  • Announced expansion of pipeline with addition of new cell therapy program: auditory neuronal cells (ANP1) for the treatment of hearing loss; intellectual property filed covering composition and methods for generating auditory neuronal progenitors.

Some of
the events and milestones anticipated by Lineage in the rest of 2022 include:

  • Investigational New Drug (“IND”) amendment submission to enable clinical performance and safety testing of a novel parenchymal spinal delivery system for OPC1, in Q4 2022;
  • FDA interaction to discuss recent manufacturing improvements made to OPC1, anticipated in Q4 2022;
  • Clinical data update from the ongoing VAC2 Phase 1 non-small cell lung cancer study; anticipated from CRUK in 2H 2022;
  • An IND submission for VAC2 to support US-based clinical testing in 2H 2022;
  • Preclinical activities for both ANP1 and PNC1 programs; ongoing throughout 2022;
  • Additional OPC1 publications, including full clinical study results from the SCiStar clinical study and an MRI findings paper; anticipated in 2H 2022;
  • Continued development of a cell-based therapeutic for glioblastoma with our strategic partner, Immunomic Therapeutics; ongoing throughout 2022;
  • Evaluation of opportunities for new VAC product candidates based on internally identified or partnered tumor antigens; ongoing throughout 2022;
  • Evaluation of new funded partnership opportunities and/or expansion of existing collaborations; ongoing throughout 2022; and
  • Continued participation in numerous investor and partnering meetings and medical and industry conferences to broaden awareness of our mission and accomplishments.

Balance
Sheet Highlights

Cash and cash equivalents totaled $78.1 million as of March 31, 2022.

First
Quarter Operating Results

Revenues: Lineage’s revenue is generated primarily from research grants, royalties, and licensing fees. Total revenues for the three months ended March 31, 2022 were $5.2 million, an increase of $4.8 million as compared to $0.4 million for the same period in 2021. The increase was primarily related to licensing fees recognized from deferred revenues in connection with the $50.0 million upfront licensing payment received in the first quarter of 2022 from Roche.

Operating
Expenses
: Operating expenses are comprised of research and development (“R&D”) expenses and general and administrative (“G&A”) expenses. Total operating expenses for the three months ended March 31, 2022 were $11.5 million, an increase of $4.2 million as compared to $7.3 million for the same period in 2021, primarily attributable to a $3.5 million non-recurring expense related to the potential settlement of the litigation concerning our 2019 acquisition of Asterias (“Asterias Litigation”).

R&D
Expenses
: R&D expenses for the three months ended March 31, 2022 were $3.0 million, a decrease of $0.4 million as compared to $3.4 million for the same period in 2021. The decrease was driven by $0.7 million in lower expenses for the OPC1 program, partially offset by $0.2 million and $0.1 million in higher expenses to support the VAC program and OpRegen related expenses to support the Roche Collaboration, respectively. Another $0.1 million of the offsetting increase was related to initial costs to support the new auditory neuron cell therapy program.

G&A
Expenses
: G&A expenses for the three months ended March 31, 2022 were $8.5 million, an increase of $4.6 million as compared to $3.9 million for the same period in 2021. The increase was primarily attributable to the $3.5 million non-recurring expense related to the potential settlement of the Asterias Litigation, and $0.5 million in share-based compensation.

Loss
from Operations
: Loss from operations for the three months ended March 31, 2022 was $6.4 million, a decrease of $0.7 million as compared to $7.1 million for the same period in 2021.

Other
Income/(Expenses), Net
: Other income (expenses), net for the three months ended March 31, 2022 reflected other expense, net of ($0.7) million, compared to other income, net of $5.6 million for the same period in 2021. The net change of ($6.3) million was primarily related to the gain on sale of marketable securities in the prior year.

Net
Loss Attributable to Lineage
: The net loss attributable to Lineage for the three months ended March 31, 2022 was $7.1 million, or $0.04 per share (basic and diluted), compared to a net loss attributable to Lineage of $1.4 million, or $0.01 per share (basic and diluted), for the same period in 2021.

Conference
Call and Webcast

Interested parties may access today’s conference call by dialing (866) 888-8633 from the U.S. and Canada and (636) 812-6629 from elsewhere outside the U.S. and Canada and should request the “Lineage Cell Therapeutics Call”. A live webcast of the conference call will be available online in the Investors section of Lineage’s website. A replay of the webcast will be available on Lineage’s website for 30 days and a telephone replay will be available through May 20, 2022, by dialing (855) 859-2056 from the U.S. and Canada and (404) 537-3406 from elsewhere outside the U.S. and Canada and entering conference ID number 1875641.

About Lineage
Cell Therapeutics, Inc.

Lineage Cell Therapeutics is a clinical-stage biotechnology company developing novel cell therapies for unmet medical needs. Lineage’s programs are based on its robust proprietary cell-based therapy platform and associated in-house development and manufacturing capabilities. With this platform Lineage develops and manufactures specialized, terminally differentiated human cells from its pluripotent and progenitor cell starting materials. These differentiated cells are developed to either replace or support cells that are dysfunctional or absent due to degenerative disease or traumatic injury or administered as a means of helping the body mount an effective immune response to cancer. Lineage’s clinical programs are in markets with billion dollar opportunities and include five allogeneic (“off-the-shelf”) product candidates: (i) OpRegen, a retinal pigment epithelial cell therapy in Phase 1/2a development for the treatment of geographic atrophy secondary to age-related macular degeneration, which is being developed under a worldwide collaboration with Roche and Genentech, a member of the Roche Group; (ii) OPC1, an oligodendrocyte progenitor cell therapy in Phase 1/2a development for the treatment of acute spinal cord injuries; (iii) VAC2, a dendritic cell therapy produced from Lineage’s VAC technology platform for immuno-oncology and infectious disease, currently in Phase 1 clinical development for the treatment of non-small cell lung cancer; (iv) ANP1, an auditory neuronal progenitor cell therapy for the potential treatment of auditory neuropathy; and (v) PNC1, a photoreceptor neural cell therapy for the treatment of vision loss due to photoreceptor dysfunction or damage. For more information, please visit www.lineagecell.com or follow the company on Twitter @LineageCell.

Forward-Looking
Statements

Lineage cautions you that all statements, other than statements of historical facts, contained in this press release, are forward-looking statements. Forward-looking statements, in some cases, can be identified by terms such as “believe,” “aim,” “may,” “will,” “estimate,” “continue,” “anticipate,” “design,” “intend,” “expect,” “could,” “can,” “plan,” “potential,” “predict,” “seek,” “should,” “would,” “contemplate,” “project,” “target,” “tend to,” or the negative version of these words and similar expressions. Such statements include, but are not limited to, statements relating to: the collaboration and license agreement with Roche and Genentech, activities expected to occur thereunder, the potential to receive upfront, milestone and royalty consideration payable to Lineage thereunder; the potential benefits of treatment with OpRegen; the power and efficiency of Lineage’s platform and its competitive advantages; the ability of Lineage’s resources to support multiple years of progress; the potential future achievements of Lineage’s clinical and preclinical programs; the timing of potential FDA interactions, and of anticipated clinical trials and clinical data updates; and plans and expectations of Lineage’s products in development. Forward-looking statements involve known and unknown risks, uncertainties and other factors that may cause Lineage’s actual results, performance or achievements to be materially different from future results, performance or achievements expressed or implied by the forward-looking statements in this press release, including, but not limited to, the risk that positive findings in early clinical and/or nonclinical studies of a product candidate may not be predictive of success in subsequent clinical and/or nonclinical studies of that candidate; the risk that competing alternative therapies may adversely impact the commercial potential of OpRegen; the risk that Roche and Genentech may not be successful in completing further clinical trials for OpRegen and/or obtaining regulatory approval for OpRegen in any particular jurisdiction; the risk that Lineage may not be able to manufacture sufficient clinical quantities of its product candidates in accordance with current good manufacturing practice; risks and uncertainties inherent in Lineage’s business and other risks discussed in Lineage’s filings with the Securities and Exchange Commission (SEC). Lineage’s forward-looking statements are based upon its current expectations and involve assumptions that may never materialize or may prove to be incorrect. All forward-looking statements are expressly qualified in their entirety by these cautionary statements. Further information regarding these and other risks is included under the heading “Risk Factors” in Lineage’s periodic reports with the SEC, including Lineage’s most recent Annual Report on Form 10-K and Quarterly Report on Form 10-Q filed with the SEC and its other reports, which are available from the SEC’s website. You are cautioned not to place undue reliance on forward-looking statements, which speak only as of the date on which they were made. Lineage undertakes no obligation to update such statements to reflect events that occur or circumstances that exist after the date on which they were made, except as required by law.


LINEAGE CELL THERAPEUTICS, INC. AND
SUBSIDIARIES

CONDENSED CONSOLIDATED BALANCE SHEETS

(IN THOUSANDS)


March 31, 2022
(Unaudited)


December 31, 2021


ASSETS


CURRENT ASSETS


Cash and cash equivalents


$

78,062


$

55,742


Marketable equity securities


1,882


2,616


Accounts and grants receivable, net


515


50,840


Prepaid expenses and other current assets


1,413


2,351


Total current assets


81,872


111,549


NONCURRENT ASSETS


Property and equipment, net


4,548


4,872


Deposits and other long-term assets


639


630


Goodwill


10,672


10,672


Intangible assets, net


46,789


46,822


TOTAL ASSETS


$

144,520


$

174,545


LIABILITIES AND SHAREHOLDERS’ EQUITY


CURRENT LIABILITIES


Accounts payable and accrued liabilities


$

8,957


$

27,969


Lease liabilities, current portion


719


801


Financing lease, current portion


31


30


Deferred revenues


14,885


18,119


Liability classified warrants, current portion


1


197


Total current liabilities


24,593


47,116


LONG-TERM LIABILITIES


Deferred tax liability


2,076


2,076


Deferred revenues, net of current portion


30,821


32,454


Lease liability, net of current portion


1,781


1,941


Financing lease, net of current portion


26


30


Liability classified warrants and other long-term liabilities


5


30


TOTAL LIABILITIES


59,302


83,647


SHAREHOLDERS’ EQUITY


Preferred shares, no par value, authorized 2,000 shares; none issued and outstanding as of
March 31, 2022 and
December 31, 2021


Common shares, no par value, 250,000 shares authorized; 169,727 and 169,477 shares issued and outstanding as of
March 31, 2022 and
December 31, 2021, respectively


435,818


434,529


Accumulated other comprehensive loss


(5,087

)


(5,211

)

Accumulated deficit


(344,184

)


(337,097

)

Lineage Cell Therapeutics, Inc. shareholders’ equity


86,547


92,221


Noncontrolling (deficit)


(1,329

)


(1,323

)

Total shareholders’ equity


85,218


90,898


TOTAL LIABILITIES AND SHAREHOLDERS’ EQUITY


$

144,520


$

174,545


LINEAGE
CELL THERAPEUTICS, INC.
AND SUBSIDIARIES

CONDENSED CONSOLIDATED STATEMENTS OF OPERATIONS

(IN THOUSANDS, EXCEPT PER SHARE DATA)

(UNAUDITED)


Three Months Ended
March 31,


2022


2021


REVENUES:


Collaboration revenues


$

4,865


$


Royalties


372


293


Grant revenues


98


Total revenues


5,237


391


Cost of sales


(176

)


(112

)


Gross profit


5,061


279


OPERATING EXPENSES:


Research and development


2,988


3,394


General and administrative


8,469


3,935


Total operating expenses


11,457


7,329


Loss from operations


(6,396

)


(7,050

)

OTHER INCOME/(EXPENSES):


Interest income, net


1


2


Gain on sale of marketable securities


6,024


Unrealized (loss) gain on marketable equity securities


(735

)


1,239

Unrealized gain on warrant liability


221


18


Other (expenses), net


(184

)


(1,681

)

Total other income (expenses), net


(697

)


5,602

LOSS BEFORE INCOME TAXES


(7,093

)


(1,448

)


Deferred income tax benefit


NET LOSS


(7,093

)


(1,448

)


Net loss attributable to noncontrolling interest


6


32


NET LOSS ATTRIBUTABLE TO LINEAGE CELL THERAPEUTICS,
INC.


$

(7,087

)


$

(1,416

)


NET LOSS PER COMMON SHARE:


BASIC


$

(0.04

)


$

(0.01

)

DILUTED


$

(0.04

)


$

(0.01

)


WEIGHTED AVERAGE NUMBER OF COMMON SHARES OUTSTANDING:


BASIC


169,647


158,725


DILUTED


169,647


158,725


LINEAGE CELL
THERAPEUTICS, INC.
AND SUBSIDIARIES

CONDENSED CONSOLIDATED STATEMENTS OF CASH FLOWS

(IN THOUSANDS)

(UNAUDITED)


Three Months Ended
March 31,


2022


2021


CASH FLOWS FROM OPERATING ACTIVITIES:


Net loss attributable to
Lineage Cell Therapeutics, Inc.


$

(7,087

)


$

(1,416

)

Net loss allocable to noncontrolling interest


(6

)


(32

)

Adjustments to reconcile net loss attributable to
Lineage Cell Therapeutics, Inc. to net cash used in operating activities:


Gain on sale of marketable securities


(6,024

)

Unrealized loss/(gain) on marketable equity securities


735


(1,239

)

Depreciation expense, including amortization of leasehold improvements


150


174


Amortization of right-of-use asset


(4

)


10


Amortization of intangible assets


32


112


Stock-based compensation


1,106


539


Common stock issued for services


102


Change in unrealized gain on warrant liability


(221

)


(18

)

Foreign currency remeasurement and other gain


75


1,712


Changes in operating assets and liabilities:


Accounts and grants receivable


50,321


(135

)

Prepaid expenses and other current assets


573


(92

)

Accounts payable and accrued liabilities


(18,905

)


(1,031

)

Deferred revenue and other liabilities


(4,865

)


(86

)

Net cash provided by (used in) operating activities


21,904


(7,424

)


CASH FLOWS FROM INVESTING ACTIVITIES:


Proceeds from the sale of OncoCyte common shares


10,064


Proceeds from the sale of HBL common shares


21


Purchase of equipment and other assets


(46

)


(11

)

Net cash (used in) provided by investing activities


(46

)


10,074


CASH FLOWS FROM FINANCING ACTIVITIES:


Proceeds from employee options exercised


379


1,717


Common shares received and retired for employee taxes paid


(8

)


(13

)

Proceeds from exercise of subsidiary warrants


2


Proceeds from sale of common shares


148


19,873


Payments for offering costs


(614

)

Repayment of lease liability


(8

)


Net cash provided by financing activities


513


20,963

Effect of exchange rate changes on cash, cash equivalents and restricted cash


(42

)


(80

)

NET INCREASE IN CASH, CASH EQUIVALENTS AND RESTRICTED CASH


22,329


23,533


CASH, CASH EQUIVALENTS AND RESTRICTED CASH:


At beginning of the period


56,277


33,183


At end of the period


$

78,606


$

56,716


Solebury
Trout IR
Justin Frantz (
jfrantz@soleburytrout.com )
(617) 221-9100

Russo
Partners
– Media Relations
Nic Johnson or David Schull Nic.johnson@russopartnersllc.com

David.schull@russopartnersllc.com

(212) 845-4242

Source:
Lineage Cell Therapeutics, Inc.

Release – Direct Digital Holdings Reports First Quarter 2022 Financial Results


Direct Digital Holdings Reports First Quarter 2022 Financial Results

Research, News, and Market Data on Direct Digital Holdings

First Quarter 2022 Revenue Up 100% Year-Over-Year to $11.4
Million

HOUSTON, May 12, 2022 /PRNewswire/ — Direct Digital Holdings, Inc. (Nasdaq: DRCT) (“Direct Digital”), a leading advertising and marketing technology platform, announced financial results for the first quarter ended March 31, 2022.

Chairman and Chief Executive Officer Mark Walker said, “We are pleased to report record revenue for the first quarter of 2022, which demonstrates the increasing value of Direct Digital’s world-class buy- and sell-side advertising platform for middle-market clients. Our quarterly growth was primarily driven by our sell-side advertising segment, and we are excited about the prospect of maintaining this momentum throughout 2022 by continuing to innovate our programmatic advertising offerings for the middle market segment, enhance our publisher partner engagement and monetization strategies, and further extend our reach into the underserved and underrepresented publisher communities.”

Keith Smith, President, added, “Our recent IPO, strategic debt refinance, and successful repurchase of equity from one of Direct Digital’s pre-IPO owners have optimally positioned Direct Digital to achieve its ambitious goals for 2022 and beyond.”

First Quarter 2022
Financial Highlights:

  • Revenue increased to $11.4 million in the first quarter of 2022, an increase of $5.7 million, or 100% over the $5.7 million in the same period of 2021.
    • Our sell-side advertising segment grew to $5.6 million, or 540% over the $0.9 million in the same period of 2021, and contributed $4.7 million of the increase in overall revenue.
    • Our buy-side advertising segment grew to $5.8 million, or 21% over the $4.8 million in the same period of 2021, and contributed $1.0 million of the increase in overall revenue.
  • Operating income increased to $0.6 million for the first quarter of 2022 compared to an operating loss of approximately ($26,000) in the same period of 2021.
  • Net loss was $(0.7) million in the first quarter of 2022, compared to $(0.8) million in the same period of 2021.
  • Adjusted EBITDA(1) increased 113% to $1.1 million in the first quarter 2022, compared to $0.5 million in the same period of 2021.
  • Net operating cash used in the first quarter was ($0.9) million compared to a net operating cash of $3.6 million generated in the same period of 2021.

Business Highlights

  • For the first quarter ended March 31, 2022, we processed approximately 90 billion monthly impressions through our sell-side advertising segment, an increase of 93% growth in the same period of 2021, with over 570 billion bid requests for the quarter.
  • In addition, our sell-side advertising platforms received over 3 billion bid responses, an increase of over 849% over the same period in 2021, through 69,000 buyers for the quarter.
  • Our buy-side advertising segment served over 128 customers, an increase of 41% in comparison to the same period of 2021.

Financial Outlook

Our guidance assumes that the U.S. economy continues to recover, and we do not have any major COVID-19-related setbacks or other major shocks that may cause economic conditions to deteriorate or otherwise significantly reduce advertiser demand. We plan to offer annual guidance and update it throughout the year, accordingly, we estimate the following:

  • For fiscal year 2022, we continue to expect revenue to be in the range of $48.0 million to $52.0 million, or 31% year-over-year growth at the mid-point.

“We are happy to report such a strong first quarter, which is a testament to our strategic post-IPO operating plan. We believe we are poised to continue to deliver significant growth, and favorable conditions in the advertising industry will also drive our business as we take advantage of these tailwinds to execute on both our organic and inorganic growth strategies, ultimately providing long-term shareholder value,” commented Mark Walker.

Conference Call and
Webcast Details

Direct Digital will host a conference call on Thursday, May 12, 2022 at 5:00 p.m. Eastern Time to discuss the Company’s quarterly results. The live webcast, dial-in information and replay can be accessed at https://ir.directdigitalholdings.com/.  Please access the website at least fifteen minutes prior to the call to register, download and install any necessary audio software. For those who cannot access the webcast, a replay will be available at https://ir.directdigitalholdings.com/ for a period of twelve months.

(1)

“Adjusted EBITDA” is a non-GAAP financial measure. The section titled “Non-GAAP Financial Measures” below describes our usage of non-GAAP financial measures and provides reconciliations between historical GAAP and non-GAAP information contained in this press release.

 Forward
Looking Statements

This press release may contain forward-looking statements within the meaning of federal securities laws, including the Private Securities Litigation Reform Act of 1995, Section 27A of the Securities Act of 1933, as amended, and Section 21E of the Securities Exchange Act of 1934, as amended, and which are subject to certain risks, trends and uncertainties. As used below, “we,” “us,” and “our” refer to Direct Digital. We use words such as “could,” “would,” “may,” “might,” “will,” “expect,” “likely,” “believe,” “continue,” “anticipate,” “estimate,” “intend,” “plan,” “prospect,” “project” and other similar expressions to identify forward-looking statements, but not all forward-looking statements include these words. All statements contained in this release that do not relate to matters of historical fact should be considered forward-looking statements. All of our forward-looking statements involve estimates and uncertainties that could cause actual results to differ materially from those expressed in or implied by the forward-looking statements. Our forward-looking statements are based on assumptions that we have made in light of our industry experience and our perceptions of historical trends, current conditions, expected future developments and other factors we believe are appropriate under the circumstances. Although we believe that these forward-looking statements are based on reasonable assumptions, many factors could affect our actual operating and financial performance and cause our performance to differ materially from the performance expressed in or implied by the forward-looking statements, including, but not limited to: our dependence on the overall demand for advertising, which could be influenced by economic downturns; any slow-down or unanticipated development in the market for programmatic advertising campaigns; the effects of health epidemics, such as the ongoing global COVID-19 pandemic; operational and performance issues with our platform, whether real or perceived, including a failure to respond to technological changes or to upgrade our technology systems; any significant inadvertent disclosure or breach of confidential and/or personal information we hold, or of the security of our or our customers’, suppliers’ or other partners’ computer systems; any unavailability or non-performance of the non-proprietary technology, software, products and services that we use; unfavorable publicity and negative public perception about our industry, particularly concerns regarding data privacy and security relating to our industry’s technology and practices, and any perceived failure to comply with laws and industry self-regulation; restrictions on the use of third-party “cookies,” mobile device IDs or other tracking technologies, which could diminish our platform’s effectiveness; any inability to compete in our intensely competitive market; any significant fluctuations caused by our high customer concentration; our limited operating history, which could result in our past results not being indicative of future operating performance; any violation of legal and regulatory requirements or any misconduct by our employees, subcontractors, agents or business partners; any strain on our resources, diversion of our management’s attention or impact on our ability to attract and retain qualified board members as a result of being a public company; our dependence, as a holding company, on receiving distributions from Direct Digital Holdings, LLC to pay our taxes, expenses and dividends; and other factors and assumptions discussed in the “Risk Factors,” “Management’s Discussion and Analysis of Financial Conditions and Results of Operations” and other sections of our filings with the SEC that we make from time to time. Should one or more of these risks or uncertainties materialize or should any of these assumptions prove to be incorrect, our actual operating and financial performance may vary in material respects from the performance projected in or implied by these forward-looking statements. Further, any forward-looking statement speaks only as of the date on which it is made, and except as required by law, we undertake no obligation to update any forward-looking statement contained in this release to reflect events or circumstances after the date on which it is made or to reflect the occurrence of anticipated or unanticipated events or circumstances, and we claim the protection of the safe harbor for forward-looking statements contained in the Private Securities Litigation Reform Act of 1995.

About Direct Digital
Holdings

Direct Digital Holdings (Nasdaq: DRCT) brings state-of-the-art supply- and demand-side advertising platforms together under one umbrella company. The holding group’s supply-side platform Colossus SSP offers advertisers of all sizes extensive reach within general market and multicultural media properties. Its operating companies Huddled Masses and Orange142 deliver significant ROI for middle market advertisers by providing data-optimized programmatic solutions at scale for businesses in sectors that range from energy to healthcare and travel to financial services. Direct Digital Holdings’ buy-side solutions manages over 200 clients daily, and the sell-side solution serves over 80,000 advertisers generating over 70+ billion impressions per month across display, CTV, in-app, and other media channels.


CONSOLIDATED BALANCE SHEETS

March 31, 2022

December 31, 2021

ASSETS

CURRENT ASSETS

Cash and cash equivalents

$

4,406,800

$

4,684,431

Accounts receivable, net

7,754,091

7,871,181

Prepaid expenses and other current assets

875,928

1,225,447

Total current assets

13,036,819

13,781,059

Goodwill

6,519,636

6,519,636

Intangible assets, net (Note 3)

15,103,123

15,591,578

Deferred financing costs, net (Note 2)

66,869

96,152

Operating lease – right-of-use assets

917,877

Other long-term assets

56,602

11,508

Total assets

$

35,700,926

$

35,999,933

LIABILITIES AND MEMBERS’ EQUITY

CURRENT LIABILITIES:

Accounts payable

$

5,920,459

$

6,710,015

Accrued liabilities

6,087,173

1,044,907

Notes payable, current portion

687,500

550,000

Deferred revenues

431,432

1,348,093

Operating lease liabilities, current portion

209,914

Related party payables (Note 7)

70,801

Total current liabilities

13,336,478

9,723,816

Notes payable, net of short-term portion and $2,153,821 and $2,091,732, deferred financing cost, respectively

19,021,179

19,358,268

Mandatorily redeemable non-participating preferred units

6,455,562

Line of credit

400,000

400,000

Paycheck Protection Program loan

287,143

287,143

Economic Injury Disaster Loan

150,000

150,000

Operating lease liabilities, net of current portion

708,262

Total liabilities

33,903,062

36,374,789

COMMITMENTS AND CONTINGENCIES (Note 8)

STOCKHOLDERS’ / MEMBERS’ EQUITY (DEFICIT)

Units, 1,000,000 units authorized at December 31, 2021; 34,182 units issued and outstanding as of December 31, 2021

4,294,241

Class A common stock, $0.001 par value per share, 160,000,000 shares authorized, 2,800,000 shares issued and outstanding as of March 31, 2022

2,800

Class B common stock, $0.001 par value per share, 20,000,000 shares authorized, 11,378,000 shares issued and outstanding as of March 31, 2022

11,378

Additional paid-in capital

7,272,856

Accumulated deficit

(5,489,170)

(4,669,097)

Total stockholders’ / members’ equity (deficit)

1,797,864

(374,856)

Total liabilities and stockholders’ / members’ equity

$

35,700,926

$

35,999,933


CONDENSED CONSOLIDATED STATEMENTS OF
OPERATIONS
(Unaudited)

Three Months Ended
March 31,

2022

2021

Revenues

Buy-side advertising

$

5,831,041

$

4,828,048

Sell-side advertising

5,539,296

865,686

      Total revenues

11,370,337

5,693,734

Cost of revenues

Buy-side advertising

2,069,346

1,954,640

Sell-side advertising

4,520,192

741,693

      Total cost of revenues

6,589,538

2,696,333

Gross Profit

4,780,799

3,482,420

Operating expenses

Compensation, taxes and benefits

2,555,036

1,773,081

General and administrative

1,640,892

1,250,515

      Total operating expenses

4,195,928

3,023,596

Income (loss) from operations

584,871

(26,195)

Other (expense) income

(1,256,494)

(783,098)

      Tax expense (benefit)

Net loss

$

(671,623)

$

(809,293)

Net loss per share of common stock / common unit:

      Basic and diluted

$

(0.09)

$

(23.68)

Weighted-average number of shares / common units outstanding:

      Basic and diluted

7,089,000

34,182


CONSOLIDATED STATEMENTS OF CASH FLOWS
(Unaudited)

For the Three Months Ended

March 31,

2022

2021

Cash Flows Provided By (Used In) Operating Activities:

Net loss

$

(671,623)

$

(809,293)

     Adjustments to reconcile net loss to net cash provided by (used in) operating activities:

Amortization of deferred financing costs

152,287

84,629

Amortization of intangible assets

488,455

488,455

Amortization of right-of-use assets

17,602

Forgiveness of Paycheck Protection Program loan

(10,000)

Paid-in-kind interest

95,344

Loss on redemption of non-participating preferred units

590,689

Bad debt expense

(2,425)

Changes in operating assets and liabilities:

Accounts receivable

119,515

1,508,681

Prepaid expenses and other current assets

304,423

(84,211)

Accounts payable

(926,581)

(717,036)

Accrued liabilities

62,803

46,148

Deferred revenues

(916,661)

2,966,693

Related party payable

(70,801)

                       Net cash provided by (used in) operating activities

(852,317)

3,569,410

Cash Flows Provided By (Used In) Financing Activities:

Proceeds from issuance of Class A common shares, net of transaction costs

11,329,818

Payments on term loan

(137,500)

(77,801)

Payment of deferred financing costs

(185,093)

Redemption of non-participating preferred shares

(7,046,251)

Redemption of common units

(3,237,838)

Distributions to members

(148,450)

(144)

                     Net cash provided used in financing activities

574,686

(77,945)

                     Net (decrease) increase in cash and cash equivalents

(277,631)

3,491,465

Cash and cash equivalents, beginning of the period

4,684,431

1,611,998

Cash and cash equivalents, end of the year

$

4,406,800

$

5,103,463

NON-GAAP FINANCIAL
MEASURES

In addition to our results determined in accordance with U.S. generally accepted accounting principles (“GAAP”), including, in particular operating income, net cash provided by operating activities, and net income, we believe that earnings before interest, taxes, depreciation and amortization (“EBITDA”), as adjusted for acquisition transaction costs, forgiveness of Paycheck Protection Program loans, gain from revaluation and settlement of seller notes and earnout liability, loss on early extinguishment of debt, and loss on early redemption of non-participating preferred units, (“Adjusted EBITDA”), a non-GAAP measure, is useful in evaluating our operating performance. The most directly comparable GAAP measure to Adjusted EBITDA is net loss.

In addition to operating income and net income, we use Adjusted EBITDA as a measure of operational efficiency. We believe that this non-GAAP financial measure is useful to investors for period-to-period comparisons of our business and in understanding and evaluating our operating results for the following reasons:

  • Adjusted EBITDA is widely used by investors and securities analysts to measure a company’s operating performance without regard to items such as depreciation and amortization, interest expense, provision for income taxes, and certain one-time items such as acquisition transaction costs and gains from settlements or loan forgiveness that can vary substantially from company to company depending upon their financing, capital structures and the method by which assets were acquired;
  • Our management uses Adjusted EBITDA in conjunction with GAAP financial measures for planning purposes, including the preparation of our annual operating budget, as a measure of operating performance and the effectiveness of our business strategies and in communications with our board of directors concerning our financial performance; and
  • Adjusted EBITDA provides consistency and comparability with our past financial performance, facilitates period-to-period comparisons of operations, and also facilitates comparisons with other peer companies, many of which use similar non-GAAP financial measures to supplement their GAAP results.

Our use of this non-GAAP financial measure has limitations as an analytical tool, and you should not consider it in isolation or as a substitute for analysis of our financial results as reported under GAAP. The following table presents a reconciliation of Adjusted EBITDA to net loss for each of the periods presented:

RECONCILIATION OF NON-GAAP FINANCIAL METRICS
(Unaudited)

For the Three Months
Ended March 31,

2022

2021

Net loss

$

(671,676)

$

(890,293)

Add back (deduct):

    Amortization of intangible assets

488,455

488,455

    Interest expense

713,787

811,757

    Forgiveness of Paycheck Protection Program loan

(10,000)

    Loss on early redemption of non-participating preferred units

590,689

Adjusted EBITDA

$

1,121,305

$

480,919


Cision View original content to download multimedia:https://www.prnewswire.com/news-releases/direct-digital-holdings-reports-first-quarter-2022-financial-results-301546560.html

SOURCE Direct Digital Holdings