FDA Program May Help Investors Uncover Breakthrough Medical Technology


Image Credit: US Food and Drug Administration (Flickr)


FDA Breakthrough Devices Program Could Aid Investors to Find Opportunities

The FDA Breakthrough Devices Program may be a starting point for investors exploring the medical space. It’s designed to create a quicker path for medical devices that provide more effective treatment or diagnosis of life-threatening or irreversible conditions. There are significant benefits for the companies granted access to the program. Lists of devices after the companies have been granted a marketing authorization are available on the FDA
website
.

While new pharmaceuticals tend to grab headlines quicker than devices, investors looking for public companies, that may be uncorrelated to the pace of US economic growth or the financial markets, may visit the website and then research the companies on Channelchek.

Benefits of the Breakthrough Devices Program

The purpose of the Breakthrough Devices Program is to provide patients and health care providers with timely access to novel medical devices by speeding up their development, assessment, and review. At the same time, it preserves the statutory standards for premarket approval, 510(k) clearance, and De Novo marketing authorization, consistent with the Agency’s mission to protect and promote public health.

Manufacturers have the opportunity to interact with the FDA’s experts through several different program options to efficiently address issues that present themselves during the FDA premarket review phase. This feedback from the FDA helps shorten the agreement phase. The company can also expect a prioritized review of its submission. This can have the effect of speeding the product to market with less cost and fewer problems.


How this Works

Pulling an example from the Channelchek library of
videos
from NobleCon18, we can use Perimeter
Medical Imaging AI
(PYNKF) to understand what a candidate looks like and how it may bring value to the patient, medical provider, and possibly investors.

Perimeter is an early-stage medical device company that expects its flagship product to address unmet cancer treatment needs. Initially, the device is expected to change the way breast cancer is treated and evaluated to improve outcomes and minimize the chance of recurrence or having to reoperate. In order to apply for the FDA designation, Perimeter’s device was indicated for breast cancer. However, the applications are expected to extend well beyond and into other major cancers in the $3.7 billion total market.

This FDA designation makes for a much more clear regulatory pathway. Perimeter meets the first guideline in that its product has unique technology (breakthrough) that is solving problems with a different method on a scalable platform. The procedures are expected to reduce the cost to patients, minimize the need for repeat surgery and be self-funding from the hospitals’ standpoint. This is because about 20 to 25% of cancer patients now need to return for a re-operation that costs approximately $16,000. Hospitals that adopt the Perimeter AI technology could serve patients better and stand to recover their costs while reducing overall patient costs on average.

Take-Away

There are many ways to uncover companies that are “on the move.” Reviewing those the FDA is likely to help along toward a full “go-ahead” is just one of them. For a more detailed look at Perimeter, their unique business model,  and technology, watch the 20-minute video below. For more on understanding the FDA Breakthrough Device Program in order to uncover companies that could change medicine, go to FDA.gov .

To evaluate small and growing companies, explore Channelchek beginning here.

Paul Hoffman

Managing Editor, Channelchek

Suggested Content


Understanding the FDA Medical Device Approval Pathways Helps Investors


The FDA’s CBD and CDP Data Acceleration Program


Perimeter Medical Imaging AI (PYNKF) NobleCon18 Presentation Replay


BioSig Technologies (BSGM) NobleCon18 Presentation Replay

Sources

https://pink.pharmaintelligence.informa.com/PS144170/Half-Of-US-FDAs-Breakthrough-Therapy-Designations-Have-Resulted-In-Approval

https://www.fda.gov/regulatory-information/search-fda-guidance-documents/breakthrough-devices-program

Stay up to date. Follow us:


Release – Tonix Pharmaceuticals Announces 1-for-32 Reverse Stock Split


Tonix Pharmaceuticals Announces 1-for-32 Reverse Stock Split

Research, News, and Market Data on Tonix Pharmaceuticals

CHATHAM, N.J., May 16, 2022 (GLOBE NEWSWIRE) — Tonix Pharmaceuticals Holding Corp. (Nasdaq: TNXP) (Tonix or the Company), a clinical-stage biopharmaceutical company, today announced that it will effect a 1-for-32 reverse stock split of its outstanding common stock. This will be effective for trading purposes as of the commencement of trading on May 17, 2022.

The reverse stock split was previously approved by the Board of Directors of Tonix in accordance with Nevada law, under which no stockholder approval is required, and is intended to increase the per share trading price of Tonix’s common stock to satisfy the $1.00 minimum bid price requirement for continued listing on The NASDAQ Capital Market (Rule 5550(a)(1)). Tonix’s common stock will continue to trade on the NASDAQ Capital Market under the symbol “TNXP” and under a new CUSIP number, 890260862. As a result of the reverse stock split, every thirty-two pre-split shares of common stock outstanding will become one share of common stock. The reverse stock split will also proportionately reduce the number of shares of authorized common stock from 1,600 million to 50 million shares. The reverse split will also apply to common stock issuable upon the exercise of Tonix’s outstanding warrants and stock options.

Tonix’s transfer agent, VStock Transfer LLC, which is also acting as the exchange agent for the reverse split, will provide instructions to shareholders regarding the process for exchanging share certificates. Any fractional shares of common stock resulting from the reverse stock split will be rounded up to the nearest whole post-split share and no shareholders will receive cash in lieu of fractional shares.

About Tonix
Pharmaceuticals Holding Corp.
1

Tonix is a clinical-stage biopharmaceutical company focused on discovering, licensing, acquiring and developing therapeutics to treat and prevent human disease and alleviate suffering. Tonix’s portfolio is composed of central nervous system (CNS), rare disease, immunology and infectious disease product candidates. Tonix’s CNS portfolio includes both small molecules and biologics to treat pain, neurologic, psychiatric and addiction conditions. Tonix’s lead CNS candidate, TNX-102 SL (cyclobenzaprine HCl sublingual tablet), is in mid-Phase 3 development for the management of fibromyalgia with a new Phase 3 study launched in the second quarter of 2022 and interim data expected in the first quarter of 2023. TNX-102 SL is also being developed to treat Long COVID, a chronic post-acute COVID-19 condition. Tonix expects to initiate a Phase 2 study in Long COVID in the second quarter of 2022. TNX-1300 (cocaine esterase) is a biologic designed to treat cocaine intoxication that is expected to start a Phase 2 trial in the second quarter of 2022. TNX-1300 has been granted Breakthrough Therapy Designation by the FDA. Finally, TNX-1900 (intranasal potentiated oxytocin), a small molecule in development for chronic migraine, is expected to enter the clinic with a Phase 2 study in the second half of 2022. Tonix’s rare disease portfolio includes TNX-2900 (intranasal potentiated oxytocin) for the treatment of Prader-Willi syndrome. TNX-2900 has been granted Orphan-Drug Designation by the FDA. Tonix’s immunology portfolio includes biologics to address organ transplant rejection, autoimmunity and cancer, including TNX-1500 which is a humanized monoclonal antibody targeting CD40-ligand being developed for the prevention of allograft and xenograft rejection and for the treatment of autoimmune diseases. A Phase 1 study of TNX-1500 is expected to be initiated in the second half of 2022. Tonix’s infectious disease pipeline consists of a vaccine in development to prevent smallpox and monkeypox called TNX-801, next-generation vaccines to prevent COVID-19, and a platform to make fully human monoclonal antibodies to treat COVID-19. Tonix’s lead vaccine candidates for COVID-19 are TNX-1840 and TNX-1850, which are live virus vaccines based on Tonix’s recombinant pox live virus vector vaccine platform.

1All of Tonix’s
product candidates are investigational new drugs or biologics and have not been
approved for any indication.

This press release and further information about Tonix can be found at www.tonixpharma.com.

Forward
Looking Statements

Certain statements in this press release are forward-looking within the meaning of the Private Securities Litigation Reform Act of 1995. These statements may be identified by the use of forward-looking words such as “anticipate,” “believe,” “forecast,” “estimate,” “expect,” and “intend,” among others. These forward-looking statements are based on Tonix’s current expectations and actual results could differ materially. There are a number of factors that could cause actual events to differ materially from those indicated by such forward-looking statements. These factors include, but are not limited to, risks related to the reverse stock split, failure to obtain FDA clearances or approvals and noncompliance with FDA regulations; delays and uncertainties caused by the global COVID-19 pandemic; risks related to the timing and progress of clinical development of our product candidates; our need for additional financing; uncertainties of patent protection and litigation; uncertainties of government or third party payor reimbursement; limited research and development efforts and dependence upon third parties; and substantial competition. As with any pharmaceutical under development, there are significant risks in the development, regulatory approval and commercialization of new products. Tonix does not undertake an obligation to update or revise any forward-looking statement. Investors should read the risk factors set forth in the Annual Report on Form 10-K for the year ended December 31, 2021, as filed with the Securities and Exchange Commission (the “SEC”) on March 14, 2022, and periodic reports filed with the SEC on or after the date thereof. All of Tonix’s forward-looking statements are expressly qualified by all such risk factors and other cautionary statements. The information set forth herein speaks only as of the date thereof.

Contacts

Jessica Morris
(corporate)

Tonix Pharmaceuticals
investor.relations@tonixpharma.com

(862) 799-8599

Olipriya Das,
Ph.D. (media)

Russo Partners
Olipriya.Das@russopartnersllc.com

(646) 942-5588

Peter Vozzo
(investors)

ICR Westwicke
peter.vozzo@westwicke.com

(443) 213-0505


Primary Logo

Source: Tonix Pharmaceuticals Holding Corp.


Redefining Power Plants that are Remaking the U.S. Power System


Image Credit: Robert Course-Baker (Flickr)


Meet the Power Plant of the Future: Solar + Battery Hybrids are Poised for Explosive Growth

America’s electric power system is undergoing radical change as it transitions from fossil fuels to renewable energy. While the first decade of the 2000s saw huge growth in natural gas generation, and the 2010s were the decade of wind and solar, early signs suggest the innovation of the 2020s may be a boom in “hybrid” power plants.

A typical hybrid power plant combines electricity generation with battery storage at the same location. That often means a solar or wind farm paired with large-scale batteries. Working together, solar panels and battery storage can generate renewable power when solar energy is at its peak during the day and then release it as needed after the sun goes down.

A look at the power and storage projects in the development pipeline offers a glimpse of hybrid power’s future.

This article was republished with permission from The Conversation, a news site dedicated to sharing ideas from academic experts. It was written by and represents the research-based opinions of Joachim Seel, Senior Scientific Engineering Associate, Lawrence Berkeley National Laboratory, Bentham Paulos, Affiliate, Electricity Markets & Policy Group, Lawrence Berkeley National Laboratory, and Will Gorman, Graduate Student Researcher in Electricity Markets and Policy, Lawrence Berkeley National Laboratory

Our team at Lawrence Berkeley National Laboratory found that a staggering 1,400 gigawatts of proposed generation and storage projects have applied to connect to the grid – more than all existing U.S. power plants combined. The largest group is now solar projects, and over a third of those projects involve hybrid solar plus battery storage.

While these power plants of the future offer many benefits, they also raise questions about how the electric grid should best be operated.


Why Hybrids are Hot

As wind and solar grow, they are starting to have big impacts on the grid.

Solar power already exceeds 25% of annual power generation in California and is spreading rapidly in other states such as Texas, Florida and Georgia. The “wind belt” states, from the Dakotas to Texas, have seen massive deployment of wind turbines, with Iowa now getting a majority of its power from the wind.

This high percentage of renewable power raises a question: How do we integrate renewable sources that produce large but varying amounts of power throughout the day?

That’s where storage comes in. Lithium-ion battery prices have rapidly fallen as production has scaled up for the electric vehicle market in recent years. While there are concerns about future supply chain challenges, battery design is also likely to evolve.

The combination of solar and batteries allows hybrid plant operators to provide power through the most valuable hours when demand is strongest, such as summer afternoons and evenings when air conditioners are running on high. Batteries also help smooth out production from wind and solar power, store excess power that would otherwise be curtailed, and reduce congestion on the grid.

Hybrids Dominate the Project Pipeline

At the end of 2020, there were 73 solar and 16 wind hybrid projects operating in the U.S., amounting to 2.5 gigawatts of generation and 0.45 gigawatts of storage.

Today, solar and hybrids dominate the development pipeline. By the end of 2021, more than 675 gigawatts of proposed solar plants had applied for grid connection approval, with over a third of them paired with storage. Another 247 gigawatts of wind farms were in line, with 19 gigawatts, or about 8% of those, as hybrids.


The amount of proposed solar, storage and wind power waiting to hook up to the grid has grown dramatically in recent years, while coal, gas and nuclear have faded. Lawrence Berkeley National Laboratory

Of course, applying for a connection is only one step in developing a power plant. A developer also needs land and community agreements, a sales contract, financing and permits. Only about one in four new plants proposed between 2010 and 2016 made it to commercial operation. But the depth of interest in hybrid plants portends strong growth.

In markets like California, batteries are essentially obligatory for new solar developers. Since solar often accounts for the majority of power in the daytime market, building more adds little value. Currently 95% of all proposed large-scale solar capacity in the California queue comes with batteries.

Five Lessons on Hybrids and Questions for the Future

The opportunity for growth in renewable hybrids is clearly large, but it raises some questions that our group at Berkeley Lab has been investigating.

Here are some of our top findings:

  • The investment pays off in many regions. We found that while adding batteries to a solar power plant increases the price, it also increases the value of the power. Putting generation and storage in the same location can capture benefits from tax credits, construction cost savings and operational flexibility. Looking at the revenue potential over recent years, and with the help of federal tax credits, the added value appears to justify the higher price.
  • Co-location also means tradeoffs. Wind and solar perform best where the wind and solar resources are strongest, but batteries provide the most value where they can deliver the greatest grid benefits, like relieving congestion. That means there are trade-offs when determining the best location with the highest value. Federal tax credits that can be earned only when batteries are co-located with solar may be encouraging suboptimal decisions in some cases.


Hybrid power has become standard in Hawaii as solar power saturates the grid. Dennis Schroeder/NREL

  • There is no one best combination. The value of a hybrid plant is determined in part by the configuration of the equipment. For example, the size of the battery relative to a solar generator can determine how late into the evening the plant can deliver power. But the value of nighttime power depends on local market conditions, which change throughout the year.
  • Power market rules need to evolve. Hybrids can participate in the power market as a single unit or as separate entities, with the solar and storage bidding independently. Hybrids can also be either sellers or buyers of power, or both. That can get complicated. Market participation rules for hybrids are still evolving, leaving plant operators to experiment with how they sell their services.
  • Small hybrids create new opportunities: Hybrid power plants can also be small, such as solar and batteries in a home or business. Such hybrids have become standard in Hawaii as solar power saturates the grid. In California, customers who are subject to power shutoffs to prevent wildfires are increasingly adding storage to their solar systems. These “behind-the-meter” hybrids raise questions about how they should be valued, and how they can contribute to grid operations.


Hybrids are just beginning, but a lot more are on the way. More research is needed on the technologies, market designs and regulations to ensure the grid and grid pricing evolve with them.

While questions remain, it’s clear that hybrids are redefining power plants. And they may remake the U.S. power system in the process.


Suggested Reading


The Good News and Bad News Surrounding US Uranium Self-Reliance


Has Uranium Demand Changed with Russia Ukraine War?


The Appeal of EVs with Bidirectional Charging


Clean vs Dirty Electrons on Power Grid


Stay up to date. Follow us:


Release – Motorsport Games Reports First Quarter 2022 Financial Results


Motorsport Games Reports First Quarter 2022 Financial Results

Research, News, and Market Data on Motorsport Games

MIAMI, May 16, 2022 (GLOBE NEWSWIRE) — Motorsport Games Inc. (NASDAQ: MSGM) (“Motorsport Games” or the “Company”) today reported financial results for its first quarter ended March 31, 2022 (“Q1 2022”). The Company has also posted to the Company’s investor relations 
website a Q1 2022 Quarter End Review video and a Q1 2022 earnings slide deck, which highlight certain key milestones that occurred in the period, as well as an updated Investor Presentation.

Dmitry Kozko, Chief Executive Officer of Motorsport Games, commented, “In Q1 2022, we continued our product and content releases. We brought the full release of our KartKraft karting simulation to PC, as well as a user experience update to our rFactor 2 racing simulation game that was positively received by our audience. In January 2022, our esports team delivered the sequel to the 24 Hours of Le Mans Virtual as a world-class event, and in February 2022 we held the inaugural 2022 INDYCAR Pro-Challenge. Games and esports initiatives were also bolstered by expanding our relationship with Formula E, and we were selected by Kindred Concepts to power their next generation racing simulation experience for Formula 1 using our rFactor 2 platform.”

Kozko added, “While we continue to explore multiple funding options to resolve our going concern qualifications, we remain confident in our ability to deliver against our product roadmap.”

First Quarter 2022
Business Update

  • Le
    Mans Virtual Series Grand Finale.
     The Company held the 2-day grand finale esports event for the 5-round 2021/22 Le Mans Virtual Series in January 2022, bringing together 50 cars with 200 drivers from 39 different countries. The series was followed by more than 81 million fans across live tv, digital streaming and social media platforms.

  • Official
    KartKraft Launch in January 2022.
     The Company officially launched its first KartKraft racing game in January 2022 after acquiring the intellectual property, assets and code from original developer, Black Delta, in March 2021.

  • rFactor
    2 User Interface Refresh and Content Updates.
     The Company released a new, easier to navigate User Interface for rFactor 2 in January 2022. Additionally, the Company began releasing a regular cadence of quarterly content updates to provide players with the most robust product offering for their virtual racing needs. The Company expects the updates to revamp and improve both its rFactor 2 platform and user experience.

  • INDYCAR
    2022 Esports Pro-Challenge.
     The Company held the inaugural 2022 INDYCAR Esports Pro-Challenge in February 2022, featuring current NTT INDYCAR SERIES drivers, including reigning champion Alex Palou, 4-time Indianapolis 500 champion Helio Castroneves and 2-time series champion Josef Newgarden, making it the first official INDYCAR-branded esports event since the Company entered into the long-term license in July 2021 to produce INDYCAR virtual racing series.

  • rFactor
    2 Racing Simulation Platform Selected To Power Next-Level Formula 1
    Competitive Socializing Experience.
     Adam Breeden, the pioneer of competitive socializing in the U.K., selected rFactor 2 as the racing simulation platform for the newly-formed Kindred Concepts – a groundbreaking, immersive, state of the art F1® racing simulation experience, gamified for a mass audience.

  • rFactor
    2 Became the Official SIM Racing Platform of Formula E.
     The Company implemented Formula E content, including its drivers and teams, into rFactor 2. rFactor 2 now features every season of Formula E since 2018 and enables racing on many high-fidelity circuits within the series. The Formula E content pack was updated in March 2022 and is available to purchase for all users of rFactor 2. In addition, Formula E launched its Accelerate Esports series powered by rFactor 2’s in-game competitions platform, and rFactor 2 will power the Formula E Gaming Arena at future esports races and events allowing players to experience the thrill of the ABB FIA Formula E World Championship in esports venues all around the world.

Financial Results for
the Three Months Ended March 31, 2022

Revenues for Q1 2022 were $3.3 million, as compared to $2.5 million for Q1 2021. The $0.8 million, or 34%, quarter-over-quarter increase reflects higher gaming sales of $0.5 million in Q1 2022, primarily from rFactor 2. Q1 2022 esports revenues increased by $0.3 million, primarily from the 24 Hours of Le Mans esports event held in January 2022.

Jon New, Chief Financial Officer of Motorsport Games, commented, “It is great to see both the growth of revenues in each of our Gaming and esports segments and the increased diversity of our revenue stream, with rFactor 2 and esports contributing 27% of total revenues for the quarter. Our business plan to increase and diversify our revenue stream is beginning to drive improved top-line financial performance.” 

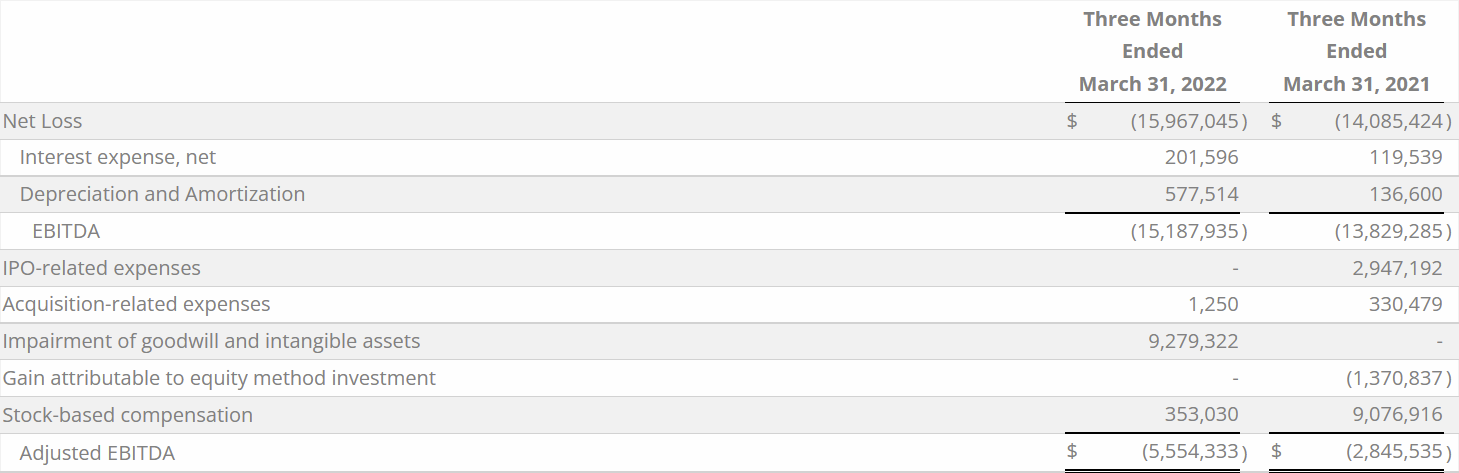
Q1 2022 net loss was $16.0 million, as compared to Q1 2021 net loss of $14.1 million. The $1.9 million increase in net loss was primarily due to a non-cash $9.3 million write-down of goodwill and intangible assets. This was primarily driven by revisions to the product roadmap during Q1 2022, resulting in changes to the scope and timing of new product releases, as well as changes in the value of the Company’s market capitalization during the first quarter of 2022. A $1.2 million increase in Q1 2022 development expenditures, and a $0.7 million increase in sales and marketing spend further contributed to the Q1 2022 increased net loss. The increases in expenses described above were partially offset by a $11.3 million reduction in general and administrative expenses and a $1.4 million reduction in gains from equity method investments.

The Q1 2022 decrease of $11.3 million in general and administrative expenses was primarily due to an $11.9 million reduction in non-recurring IPO expenses that were incurred in Q1 2021, including IPO bonuses and stock-based compensation.

Q1 2022 Adjusted EBITDA loss(1) was $5.6 million, as compared to Q1 2021 Adjusted EBITDA loss of $2.8 million. The $2.7 million increase in Q1 2022 Adjusted EBITDA loss(1) was primarily driven by the same factors as the increased Q1 2022 net loss, higher Q1 2022 interest and amortization and Q1 2021 had more non-operational add-backs with Q1 2021 IPO related expenses (including stock-based compensation).

The following table provides a reconciliation from net loss to Adjusted EBITDA(1) for Q1 2022 and Q1 2021, respectively:

Cash Flow and
Liquidity

For Q1 2022, the Company had negative cash flows from operations of approximately $5.6 million. The Company expects to continue to have negative operating cash flows for the foreseeable future, as it continues to incur expenses to develop new game franchises. The Company’s existing cash on hand will be insufficient to fund its minimum liquidity requirements for at least the next 12 months and will need to be supplemented with additional debt and/or equity financing, cash generated by cost control initiatives, and/or additional changes to its product roadmap to reduce working capital requirements.

The Company’s future liquidity and capital requirements include funds to support the planned costs to operate its business, including amounts required to fund working capital, support the development and introduction of new products, maintain existing game titles and certain capital expenditures. The adequacy of the Company’s available funds generally depends on many factors, including its ability to successfully develop consumer-preferred new products or enhancements to its existing products, continued development and expansion of the Company’s esports platform and its ability to collaborate with and/or acquire other companies or technologies to enhance or complement the Company’s product and service offerings.

The Company is currently seeking additional funds through a variety of arrangements discussed above, and through maintaining and enhancing strong cost controls. There can be no assurances that the sources of liquidity referred to above will provide the Company with sufficient liquidity to meet its ongoing cash requirements as, among other things, the Company’s liquidity can be impacted by a number of factors, including the Company’s level of sales and expenditures, as well as accounts receivable, sales allowances, prepaid manufacturing expenses and accrued expenses.

(1)Use of Non-GAAP Financial Measures

Adjusted EBITDA (the “Non-GAAP Measure”) is not a financial measure defined by U.S. generally accepted accounting principles (“U.S. GAAP”). See the reconciliations of the Non-GAAP Measure to its most directly comparable U.S. GAAP measure in the financial table above.

Adjusted EBITDA, a measure used by management to assess the Company’s operating performance, is defined as EBITDA, which is net loss plus interest (income) expense, depreciation and amortization, less income tax benefit (if any), adjusted to exclude: (i) IPO-related expenses; (ii) acquisition related expenses; (iii) gain attributable to equity method investment resulting from the acquisition of additional equity interest in Le Mans Esports Series Ltd.; (iv) stock-based compensation expenses; (v) impairment of goodwill and intangible assets, and (vi) other charges or gains resulting from non-recurring events. 

The Company uses the Non-GAAP Measure to manage its business and evaluate its financial performance, as Adjusted EBITDA eliminates items that affect comparability between periods that the Company believes are not representative of its core ongoing operating business. Additionally, management believes that using the Non-GAAP Measure is useful to its investors because it enhances investors’ understanding and assessment of the Company’s normalized operating performance and facilitates comparisons to prior periods and its competitors’ results (who may define Adjusted EBITDA differently).

The Non-GAAP Measure is not a recognized term under U.S. GAAP and does not purport to be an alternative to revenue, income/loss from operations, net (loss) income, or cash flows from operations or as a measure of liquidity or any other performance measure derived in accordance with U.S. GAAP. Additionally, the Non-GAAP Measure is not intended to be a measure of free cash flows available for management’s discretionary use, as it does not consider certain cash requirements, such as interest payments, tax payments, working capital requirements and debt service requirements. The Non-GAAP Measure has limitations as an analytical tool, and investors should not consider it in isolation or as a substitute for the Company’s results as reported under U.S. GAAP. Management compensates for the limitations of using non-GAAP financial measures by using them to supplement U.S. GAAP results to provide a more complete understanding of the factors and trends affecting the business than would be presented by using only measures in accordance with U.S. GAAP. Because not all companies use identical calculations, the Company’s measures may not be comparable to other similarly titled measures of other companies. Reconciliations of the Non-GAAP Measure to net loss, its most directly comparable financial measure, calculated and presented in accordance with U.S. GAAP, are presented in the table above.

Conference Call and
Webcast Details

The Company will host a conference call and webcast at 5:00 p.m. ET today, May 16, 2022, to discuss its financial results. The live conference call can be accessed by dialing 1-800-786-6104 from the U.S. or 1-416-981-9029. Alternatively, participants may access the live webcast on the Motorsport Games Investor Relations website at 
https://ir.motorsportgames.com under “Events.”

About Motorsport Games

Motorsport Games, a Motorsport Network company, combines innovative and engaging video games with exciting esports competitions and content for racing fans and gamers around the globe. The Company is the officially licensed video game developer and publisher for iconic motorsport racing series across PC, PlayStation, Xbox, Nintendo Switch and mobile, including NASCAR, INDYCAR, 24 Hours of Le Mans and the British Touring Car Championship (“BTCC”). Motorsport Games is an award-winning esports partner of choice for 24 Hours of Le Mans, Formula E, BTCC, the FIA World Rallycross Championship and the eNASCAR Heat Pro League, among others.

For more information about Motorsport Games visit: www.motorsportgames.com.

Forward-Looking Statements

Certain statements in this press release, the related conference call and webcast which are not historical facts are forward-looking statements within the meaning of Section 27A of the Securities Act of 1933, as amended, and Section 21E of the Securities Exchange Act of 1934, as amended, and are provided pursuant to the safe harbor provisions of the Private Securities Litigation Reform Act of 1995. Any statements in this press release, the related conference call and webcast that are not statements of historical fact may be deemed forward-looking statements. Words such as “continue,” “will,” “may,” “could,” “should,” “expect,” “expected,” “plans,” “intend,” “anticipate,” “believe,” “estimate,” “predict,” “potential,” and similar expressions are intended to identify such forward-looking statements. These forward-looking statements include, but are not limited to, statements concerning: (i) Motorsport Games’ future business, future results of operations and/or financial condition; (ii) the expected future impact of new or planned products or offerings and the timing of launching such products and offerings, including, without limitation our belief that we will deliver against our product roadmap, our expectations that our rFactor 2 updates will revamp and improve both our rFactor 2 platform and user experience and our expectations that rFactor 2 will power the Formula E Gaming Arena at future esports races and events and allow players to experience the thrill of the ABB FIA Formula E World Championship in esports venues all around the world; (iii) the expected future impact of implementing management strategies and the impact of other industry trends, including, without limitation our ability to execute a business continuity plan and adapt to developments real-time, as well as our business plan to increase and diversify our revenue stream; (iv) the ability of the Company to fund future development and operating expenses, including, without exception our expectation that the Company will continue to have negative operating cash flows for the foreseeable future, as we continue to incur expenses to develop new game franchises; and (v) our liquidity and capital requirements, including, without limitation, our ability to continue as a going concern, our belief that our existing cash on hand will not be sufficient to fund our liquidity requirements for at least the next 12 months, our belief that it will be necessary for us to secure additional funds to continue our existing business operations, including any references to our existing $12 million line of credit with our parent company, Motorsport Network, and to fund our obligations, including, without limitation, the Company’s expectation to supplement its liquidity through additional debt and/or equity financing, cash generated by cost control initiatives, and/or additional changes to our product roadmap to reduce working capital requirements, as well as statements regarding our cash flows and anticipated uses of cash. All forward-looking statements involve significant risks and uncertainties that could cause actual results to differ materially from those expressed or implied in the forward-looking statements, many of which are generally outside the control of Motorsport Games and are difficult to predict. Examples of such risks and uncertainties include, but are not limited to: (i) difficulties, delays or less than expected results in achieving the Company’s growth plans, objectives and expectations, such as due to a slower than anticipated economic recovery and/or the Company’s inability, in whole or in part, to continue to execute its business strategies and plans, such as due to less than anticipated customer acceptance of the Company’s new game titles, the Company’s experiencing difficulties or the inability to launch its games as planned, less than anticipated performance of the games impacting customer acceptance and sales and/or greater than anticipated costs and expenses to develop and launch its games, including, without limitation, higher than expected labor costs and, in addition to the factors set forth in (ii) through (iv) below, the Company’s continuing financial condition and ability to obtain additional debt or equity financing to meet its liquidity requirements, such as the going concern qualification on the Company’s annual audited financial statements posing difficulties in obtaining new financing on terms acceptable to the Company, or at all; (ii) difficulties, delays in or unanticipated events that may impact the timing and scope of new product launches, such as due to difficulties or delays in using its product development personnel in Russia due to the Russia invasion of Ukraine and the related sanctions and/or more restrictive sanctions rendering transacting in the region more difficult or costly and/or difficulties and/or delays arising out of any resurgence of the ongoing and prolonged COVID-19 pandemic; (iii) less than expected benefits from implementing the Company’s management strategies and/or adverse economic, market and geopolitical conditions that negatively impact industry trends, such as significant changes in the labor markets, an extended or higher than expected inflationary environment (such as the impact on consumer discretionary spending as a result of significant increases in energy and gas prices which have been increasing since early in 2020), a higher interest rate environment, tax increases impacting consumer discretionary spending and or quantitative easing that results in higher interest rates that negatively impact consumers’ discretionary spending, or adverse developments relating to the Russia invasion of Ukraine; and/or (iv) difficulties and/or delays in resolving our liquidity position, and other unanticipated difficulties in resolving our continuing financial condition and ability to obtain additional capital to meet our liquidity needs, including without limitation, difficulties in securing funding that is on commercially acceptable terms to us or at all, such as our inability to complete in whole or in part any potential debt and/or equity financing transactions, as well as any inability to achieve cost reductions and/or less than expected availability of funds under its $12 million line of credit from Motorsport Network. Factors other than those referred to above could also cause Motorsport Games’ results to differ materially from expected results. Additional examples of such risks and uncertainties include, but are not limited to: (i) delays and higher than anticipated expenses related to the ongoing and prolonged COVID-19 pandemic, any resurgence of COVID-19 and the Russia invasion of Ukraine; (ii) Motorsport Games’ ability (or inability) to maintain existing, and to secure additional, licenses and other agreements with various racing series; (iii) Motorsport Games’ ability to successfully manage and integrate any joint ventures, acquisitions of businesses, solutions or technologies; (iv) unanticipated operating costs, transaction costs and actual or contingent liabilities; (v) the ability to attract and retain qualified employees and key personnel; (vi) adverse effects of increased competition; (vii) changes in consumer behavior, including as a result of general economic factors, such as increased inflation, higher energy prices and higher interest rates; (viii) Motorsport Games’ ability to protect its intellectual property; and/or (ix) local, industry and general business and economic conditions. Additional factors that could cause actual results to differ materially from those expressed or implied in the forward-looking statements can be found in Motorsport Games’ filings with the SEC, including its Annual Report on Form 10-K for the fiscal year ended December 31, 2021, its Quarterly Reports on Form 10-Q filed with the SEC during 2022, as well as in its subsequent filings with the SEC. Motorsport Games anticipates that subsequent events and developments may cause its plans, intentions and expectations to change. Motorsport Games assumes no obligation, and it specifically disclaims any intention or obligation, to update any forward-looking statements, whether as a result of new information, future events or otherwise, except as expressly required by law. Forward-looking statements speak only as of the date they are made and should not be relied upon as representing Motorsport Games’ plans and expectations as of any subsequent date.

Website and Social
Media Disclosure

Investors and others should note that we announce material financial information to our investors using our investor relations website (ir.motorsportgames.com), SEC filings, press releases, public conference calls and webcasts. We use these channels, as well as social media and blogs, to communicate with our investors and the public about our company and our products. It is possible that the information we post on our websites, social media and blogs could be deemed to be material information. Therefore, we encourage investors, the media and others interested in our company to review the information we post on the websites, social media channels and blogs, including the following (which list we will update from time to time on our investor relations website):


Websites


Social Media

motorsportgames.com


Twitter: @msportgames &
@traxiongg


traxion.gg


Instagram: msportgames & traxiongg


motorsport.com


Facebook: Motorsport
Games
 & traxiongg


LinkedIn: Motorsport
Games


Twitch: traxiongg


Reddit: traxiongg

The contents of these websites and social media channels are not part of, nor will they be incorporated by reference into, this press release.

Contacts:

Investors:
Ashley DeSimone
Ashley.DeSimone@icrinc.com

Media:
ASTRSK PR
motorsportgames@astrskpr.com


Release – Ayala Pharmaceuticals Reports First Quarter 2022 Financial Results and Provides Corporate Update


Ayala Pharmaceuticals Reports First Quarter 2022 Financial Results and Provides Corporate Update

Research, News, and Market Data on Ayala Pharmaceuticals

Interim data from Part A of RINGSIDE study of AL102 expected
mid-2022

REHOVOT, Israel and WILMINGTON, Del., May 16, 2022 (GLOBE NEWSWIRE) — Ayala Pharmaceuticals, Inc. (Nasdaq: AYLA), a clinical-stage oncology company focused on developing and commercializing small molecule therapeutics for patients suffering from rare and aggressive cancers, primarily in genetically defined patient populations, today announced first-quarter 2022 financial results and provided a corporate update.

“We continued to execute on advancing our clinical programs during the first quarter of 2022,” said Roni Mamluk, Ph.D., Chief Executive Officer of Ayala. “Our highest immediate priority is completing Part A of the RINGSIDE study evaluating AL102 in desmoid tumors and we are on target to announce initial interim data around mid-year. This will be followed by initiation of Part B, the randomized portion of the study, immediately thereafter. We are very encouraged by the positive feedback received from investigators in the study and by early signs of anti-tumor activity. Other important milestones expected this year include clinical updates from the ongoing ACCURACY trial of AL101 in adenoid cystic carcinoma and the planned initiation of a Phase 2 trial of AL102 in T-ALL.”

First-quarter 2022 and Recent Business Highlights

  • Completed
    enrollment of Part A of the Phase 2/3 RINGSIDE study of AL102 in desmoid
    tumors:
     42 patients have been enrolled in Part A of the RINGSIDE study, which is evaluating the safety and tolerability of AL102, as well as tumor volume by MRI at 16 weeks. Three dosing regimens of AL102 are being tested to determine the optimal dose regimen to advance forward.

  • Initiated “Window
    of Opportunity” study of AL101 in adenoid cystic carcinoma (ACC): 
    The study, which is being conducted in collaboration with M.D. Anderson Cancer Center and the Adenoid Cystic Carcinoma (ACC) Research Foundation, is focused on determining the effects of AL101 for the treatment of ACC and other cancers. The goals of the study are to better understand the mechanism of AL101, determine the best treatment regimen and generate data for the future development strategy.

Upcoming Milestones

  • Initial interim
    data from pivotal Phase 2/3 RINGSIDE trial in desmoid tumors:
     Ayala expects to report an initial interim data read-out from Part A of Phase 2/3 RINGSIDE trial of AL102 in desmoid tumors around mid-2022. Part B of the study will be a double-blind placebo-controlled study enrolling up to 156 patients with progressive disease, randomized between AL102 or placebo. The study’s primary endpoint will be progression free survival with secondary endpoints including objective response rates, duration of response and patient reported quality of life measures.
  • Clinical data from
    Phase 2 ACCURACY trial of AL101 in ACC: 
    The Phase 2 ACCURACY clinical trial is an open-label, single-arm, multi-center study to assess the clinical activity of AL101 using radiographic assessments of patients with R/M ACC demonstrating disease progression within 6 months prior to dosing. A poster at the 2022 ASCO Annual Meeting is expected to feature safety, efficacy, pharmacokinetics, and pharmacodynamics data from the 6mg AL101 cohort in the trial.
  • Initiate Phase 2
    clinical trial evaluating AL102 in T-cell acute lymphoblastic leukemia
    (T-ALL): 
    Ayala plans to begin a Phase 2 clinical trial evaluating AL101 in R/R T-ALL in the second half of 2022.

First-Quarter 2022
Financial Results

Cash Position: Cash and cash equivalents were $27.4 million as of March 31, 2021, as compared to $37.3 million at December 31, 2021.

Collaboration Revenue: Collaboration revenue was $0.4 million for the first quarter of 2022, as compared to $1.0 million for the corresponding quarter in 2021.

R&D Expenses: Research and development expenses were $7.5 million for the first quarter of 2022, compared to $6.9 million for the corresponding quarter in 2021.

G&A Expenses: General and administrative expenses were $2.4 million for the first quarter of 2022, compared to $2.3 million for the first quarter of 2021.

Net Loss: Net loss was $10.0 million for the first quarter ended March 31, 2022, resulting in basic and diluted net loss per share of $0.66. This compares with a net loss of $9.6 million for the first quarter ended March 31, 2021, or basic and diluted net loss per share of $0.74.

For further details on the company’s financial results, refer to form Quarterly Report on Form 10-Q for the three months ended March 31, 2022, filed with the SEC on May 16, 2022.

About Ayala
Pharmaceuticals

Ayala Pharmaceuticals, Inc. is a clinical-stage oncology company focused on developing and commercializing small molecule therapeutics for patients suffering from rare and aggressive cancers, primarily in genetically defined patient populations. Ayala’s approach is focused on predicating, identifying and addressing tumorigenic drivers of cancer through a combination of its bioinformatics platform and next-generation sequencing to deliver targeted therapies to underserved patient populations. The company has two product candidates under development, AL101 and AL102, targeting the aberrant activation of the Notch pathway with gamma secretase inhibitors to treat a variety of tumors including Adenoid Cystic Carcinoma, T-cell Acute Lymphoblastic Leukemia (T-ALL), Desmoid Tumors and Multiple Myeloma (MM) (in collaboration with Novartis). AL101, has received Fast Track Designation and Orphan Drug Designation from the U.S. FDA and is currently in a Phase 2 clinical trial for patients with ACC (ACCURACY) bearing Notch activating mutations. AL102 is currently in a Pivotal Phase 2/3 clinical trials for patients with desmoid tumors (RINGSIDE) and is being evaluated in a Phase 1 clinical trial in combination with Novartis’ BMCA targeting agent, WVT078, in Patients with relapsed/refractory Multiple Myeloma. For more information, visit www.ayalapharma.com.

Contacts:

Investors:
Joyce Allaire
LifeSci Advisors LLC
+1-617-435-6602

jallaire@lifesciadvisors.com

Ayala Pharmaceuticals:
+1-857-444-0553

info@ayalapharma.com

Forward-Looking
Statements

This press release contains forward-looking statements within the meaning of the Private Securities Litigation Reform Act of 1995. All statements contained in this press release that do not relate to matters of historical fact should be considered forward-looking statements, including statements relating to our development of AL101 and AL102, the promise and potential impact of our preclinical or clinical trial data, the timing of and plans to initiate additional clinical trials of AL101 and AL102, the timing and results of any clinical trials or readouts, our participation at scientific or medical conferences, including the 2022 ASCO Annual Meeting, the sufficiency of cash to fund operations, and the anticipated impact of COVID-19, on our business. These forward-looking statements are based on management’s current expectations. The words ”may,” “will,” “should,” “expect,” “plan,” “anticipate,” “could,” “intend,” “target,” “project,” “estimate,” “believe,” “predict,” “potential” or “continue” or the negative of these terms or other similar expressions are intended to identify forward-looking statements, although not all forward-looking statements contain these identifying words.

These statements are neither promises nor guarantees, but involve known and unknown risks, uncertainties and other important factors that may cause our actual results, performance or achievements to be materially different from any future results, performance or achievements expressed or implied by the forward-looking statements, including, but not limited to, the following: we have incurred significant losses since inception and anticipate that we will continue to incur losses for the foreseeable future. We are not currently profitable, and we may never achieve or sustain profitability; we will require additional capital to fund our operations, and if we fail to obtain necessary financing, we may not be able to complete the development and commercialization of AL101 and AL102; we have identified conditions and events that raise substantial doubt about our ability to continue as a going concern; we have a limited operating history and no history of commercializing pharmaceutical products, which may make it difficult to evaluate the prospects for our future viability; we are heavily dependent on the success of AL101 and AL102, our most advanced product candidates, which are still under clinical development, and if either AL101 or AL102 does not receive regulatory approval or is not successfully commercialized, our business may be harmed; due to our limited resources and access to capital, we must prioritize development of certain programs and product candidates; these decisions may prove to be wrong and may adversely affect our business; the outbreak of COVID-19, may adversely affect our business, including our clinical trials; our ability to use our net operating loss carry forwards to offset future taxable income may be subject to certain limitations; our product candidates are designed for patients with genetically defined cancers, which is a rapidly evolving area of science, and the approach we are taking to discover and develop product candidates is novel and may never lead to marketable products; we were not involved in the early development of our lead product candidates; therefore, we are dependent on third parties having accurately generated, collected and interpreted data from certain preclinical studies and clinical trials for our product candidates; enrollment and retention of patients in clinical trials is an expensive and time-consuming process and could be made more difficult or rendered impossible by multiple factors outside our control; if we do not achieve our projected development and commercialization goals in the timeframes we announce and expect, the commercialization of our product candidates may be delayed and our business will be harmed; our product candidates may cause serious adverse events or undesirable side effects, which may delay or prevent marketing approval, or, if approved, require them to be taken off the market, require them to include safety warnings or otherwise limit their sales; the market opportunities for AL101 and AL102, if approved, may be smaller than we anticipate; we may not be successful in developing, or collaborating with others to develop, diagnostic tests to identify patients with Notch-activating mutations; we have never obtained marketing approval for a product candidate and we may be unable to obtain, or may be delayed in obtaining, marketing approval for any of our product candidates; even if we obtain FDA approval for our product candidates in the United States, we may never obtain approval for or commercialize them in any other jurisdiction, which would limit our ability to realize their full market potential; we have been granted Orphan Drug Designation for AL101 for the treatment of ACC and may seek Orphan Drug Designation for other indications or product candidates, and we may be unable to maintain the benefits associated with Orphan Drug Designation, including the potential for market exclusivity, and may not receive Orphan Drug Designation for other indications or for our other product candidates; although we have received Fast Track designation for AL101, and may seek Fast Track designation for our other product candidates, such designations may not actually lead to a faster development timeline, regulatory review or approval process; we face significant competition from other biotechnology and pharmaceutical companies and our operating results will suffer if we fail to compete effectively; we are dependent on a small number of suppliers for some of the materials used to manufacture our product candidates, and on one company for the manufacture of the active pharmaceutical ingredient for each of our product candidates; our existing collaboration with Novartis is, and any future collaborations will be, important to our business. If we are unable to maintain our existing collaboration or enter into new collaborations, or if these collaborations are not successful, our business could be adversely affected; enacted and future healthcare legislation may increase the difficulty and cost for us to obtain marketing approval of and commercialize our product candidates, if approved, and may affect the prices we may set; if we are unable to obtain, maintain, protect and enforce patent and other intellectual property protection for our technology and products or if the scope of the patent or other intellectual property protection obtained is not sufficiently broad, our competitors could develop and commercialize products and technology similar or identical to ours, and we may not be able to compete effectively in our markets; we may engage in acquisitions or in-licensing transactions that could disrupt our business, cause dilution to our stockholders or reduce our financial resources; and risks related to our operations in Israel could materially adversely impact our business, financial condition and results of operations.

These and other important factors discussed under the caption “Risk Factors” in our Quarterly Report on Form 10-Q for the three months ended March 31, 2022 filed with the U.S. Securities and Exchange Commission (SEC) on May 16, 2022 and our other filings with the SEC, could cause actual results to differ materially from those indicated by the forward-looking statements made in this press release. Any such forward-looking statements represent management’s estimates as of the date of this press release. New risk factors and uncertainties may emerge from time to time, and it is not possible to predict all risk factors and uncertainties. While we may elect to update such forward-looking statements at some point in the future, except as required by law, we disclaim any obligation to do so, even if subsequent events cause our views to change. Although we believe the expectations reflected in such forward-looking statements are reasonable, we can give no assurance that such expectations will prove to be correct. These forward-looking statements should not be relied upon as representing our views as of any date subsequent to the date of this press release.

AYALA
PHARMACEUTICALS, INC.

CONDENSED CONSOLIDATED BALANCE SHEETS
(Unaudited)
(In thousands, except share and per share amounts)


March 31


December 31


2022


2021


(Unaudited)


CURRENT
ASSETS:


Cash and Cash Equivalents


$

27,050


$

36,982


Short-term Restricted Bank Deposits


122


122


Trade Receivables


638


Prepaid Expenses and other Current Assets


1,492


2,636


Total Current Assets


29,302


39,740


LONG-TERM
ASSETS:


Other Assets


$

255


$

267


Property and Equipment, Net


1,090


1,120


Total Long-Term Assets


1,345


1,387


Total Assets


$

30,647


$

41,127


LIABILITIES AND STOCKHOLDERS’
EQUITY:


CURRENT
LIABILITIES:


Trade Payables


$

2,564


$

3,214


Other Accounts Payables


2,793


3,258


Total Current Liabilities


5,357


6,472


LONG
TERM LIABILITIES:


Long-term Rent Liability


472


497


Total Long-Term Liabilities


$

472


$

497


STOCKHOLDERS’ STOCKHOLDERS’ EQUITY:


Common Stock of $0.01 par value per share; 200,000,000 shares authorized at December 31, 2021 and March 31, 2022; 14,085,283 and 14,080,383 shares issued at March 31, 2022 and December 31, 2021, respectively; 13,972,778 and 13,956,035 shares outstanding at March 31, 2022 and December 31, 2021, respectively


$

139


$

139


Additional Paid-in Capital


145,847


145,160


Accumulated Deficit


(121,168

)


(111,141

)

Total Stockholders’ Equity


24,818


34,158


Total Liabilities and Stockholders’ Equity


$

30,647


$

41,127


AYALA
PHARMACEUTICALS, INC.

CONDENSED CONSOLIDATED STATEMENTS OF OPERATIONS
(Unaudited)

(In thousands, except share & per share amounts)


For the
three months
Ended


March 31,


2022


2021


Revenues from licensing agreement and others


$

368


$

974


Cost of services


(368

)


(974

)

Gross profit


Operating expenses:


Research and development


7,503


6,925


General and administrative


2,441


2,303


Total operating expenses


9,944


9,228


Operating loss


(9,944

)


(9,228

)

Other income


90


Financial Income (Loss), net


16


(92

)


Loss before income tax


(9,838

)


(9,320

)

Taxes on income


(189

)


(248

)

Net loss attributable to common stockholders


(10,027

)


(9,568

)

Net Loss per share attributable to common stockholders, basic and diluted


$

(0.66

)


$

(0.74

)

Weighted average common shares outstanding, basic and diluted


15,301,065


12,888,340


Release – Euroseas Ltd. Signs Contract for the Construction of Two Additional Fuel Efficient 2,800 teu Feeder Containerships Increasing its Newbuilding Program to Nine Vessels


Euroseas Ltd. Signs Contract for the Construction of Two Additional Fuel Efficient 2,800 teu Feeder Containerships Increasing its Newbuilding Program to Nine Vessels

Research, News, and Market Data on Euroseas Ltd

ATHENS, Greece, May 16, 2022 (GLOBE NEWSWIRE) — Euroseas Ltd. (NASDAQ:ESEA), an owner and operator of container vessels and provider of seaborne transportation for containerized cargoes, announced today that it has exercised its option to proceed with the construction of two additional eco design fuel efficient containerships. The vessels will have a carrying capacity of about 2,800 teu each and will be built at Hyundai Mipo Dockyard Co. in South Korea. The two newbuildings are scheduled to be delivered during the fourth quarter of 2024. The total consideration for these two newbuilding contracts is approximately $86 million and will be financed with a combination of debt and equity. The vessels are sisterships of four other vessels ordered by Euroseas Ltd. in June 2021 and January 2022; Euroseas Ltd. has also ordered, and previously announced, three 1,800 teu vessels at the same shipyard.

The Company also announced that it intends to upgrade the engines of all of its six 2,800 teu vessels ordered to Tier III type (from Tier II) and have the ships be LNG-ready where possible for a total incremental cost for all vessels of about $11 million. Tier III type engine achieve lower NOx emissions. The three 1,800 teu vessels were ordered with Tier III type engines and are LNG-ready.

Aristides Pittas,
Chairman and CEO of Euroseas commented: 
“We are pleased to announce the ordering of two additional modern eco-design 2,800 teu vessels in one of the top quality shipbuilders in the world. The current contracts along with the orders we placed previously bring our newbuilding program to nine vessels and solidify our presence in the large feeder containership sector. It further highlights our commitment for an environmentally friendly fleet. With our earnings visibility well into 2025, we believe that investing in modern new vessels makes good use of the cash flow that our existing vessels generate and positions Euroseas to benefit from upcoming market developments, especially, as related to new environmental regulations for the benefit of our shareholders.”

Fleet Profile:
After the acquisition of M/V “Seaspan Melbourne” and M/V “Seaspan Manila”, the Euroseas Ltd. fleet and employment profile will be as follows:

Vessels
under construction

Type

Dwt

TEU

To be delivered

H4201

Feeder

37,237

2,800

Q1 2023

H4202

Feeder

37,237

2,800

Q2 2023

H4236

Feeder

37,237

2,800

Q4 2023

H4237

Feeder

37,237

2,800

Q1 2024

H4248

Feeder

22,262

1,800

Q1 2024

H4249

Feeder

22,262

1,800

Q2 2024

H4250

Feeder

22,262

1,800

Q2 2024

H# (to be assigned))

Feeder

37,237

2,800

Q4 2024

H# (to be assigned))

Feeder

37,237

2,800

Q4 2024

Total
under construction

9

290,208

22,200


Notes:  
(*)/(+)        TC denotes time charter. Charter duration indicates the earliest redelivery date unless the contract rate is lower than the current market rate in which cases the latest redelivery date is shown and marked by (+).
(**)         CONTEX stands for the Container Ship Time Charter Assessment Index.
(***)         Rate is net of commissions (commissions are typically 5-6.25%).

About Euroseas Ltd.
Euroseas Ltd. was formed on May 5, 2005 under the laws of the Republic of the Marshall Islands to consolidate the ship owning interests of the Pittas family of Athens, Greece, which has been in the shipping business over the past 140 years. Euroseas trades on the NASDAQ Capital Market under the ticker ESEA.

Euroseas operates in the container shipping market. Euroseas’ operations are managed by Eurobulk Ltd., an ISO 9001:2008 and ISO 14001:2004 certified affiliated ship management company, which is responsible for the day-to-day commercial and technical management and operations of the vessels. Euroseas employs its vessels on spot and period charters and through pool arrangements.

After the delivery of its recent acquisition of 2 Intermediate containerships, the Company will have a fleet of 18 vessels comprising of 10 Feeder and 8 Intermediate containerships. Euroseas 18 containerships have a cargo capacity of 58,871 teu. On a fully-delivered basis, the Company’s fleet will increase to 27 containerships with a cargo capacity of about 81,071 teu.

Forward Looking Statement
This press release contains forward-looking statements (as defined in Section 27A of the Securities Act of 1933, as amended, and Section 21E of the Securities Exchange Act of 1934, as amended) concerning future events and the Company’s growth strategy and measures to implement such strategy; including expected vessel acquisitions and entering into further time charters. Words such as “expects,” “intends,” “plans,” “believes,” “anticipates,” “hopes,” “estimates,” and variations of such words and similar expressions are intended to identify forward-looking statements. Although the Company believes that the expectations reflected in such forward-looking statements are reasonable, no assurance can be given that such expectations will prove to have been correct. These statements involve known and unknown risks and are based upon a number of assumptions and estimates that are inherently subject to significant uncertainties and contingencies, many of which are beyond the control of the Company. Actual results may differ materially from those expressed or implied by such forward-looking statements. Factors that could cause actual results to differ materially include, but are not limited to changes in the demand for containerships, competitive factors in the market in which the Company operates; risks associated with operations outside the United States; and other factors listed from time to time in the Company’s filings with the Securities and Exchange Commission. The Company expressly disclaims any obligations or undertaking to release publicly any updates or revisions to any forward-looking statements contained herein to reflect any change in the Company’s expectations with respect thereto or any change in events, conditions or circumstances on which any statement is based.

Visit the Company’s website www.euroseas.gr


Release – Schwazze Announces First Quarter Results


Schwazze Announces First Quarter Results

Research, News, and Market Data on Schwazze

Conference
Call & Webcast Scheduled for Today – 4:30 pm EDT

DENVER, May 16, 2022 /CNW/ – Schwazze, (OTCQX: SHWZ) (NEO: SHWZ) (“Schwazze” or the “Company”), today announced financial results for the first quarter ended March 31, 2022 (“Q1 2022”).

Q1 2022 Financial Summary:

  • Revenues of $31.8 million grew 64% compared to $19.3 million in first quarter ended March 31, 2021 (Q1 2021)
  • Retail sales were $26.5 million up 124% when compared to Q1 2021
  • Gross Margin of $10.9 million was up 34.4% compared to $7.3 million in Q1 2021, both first quarters were affected by purchase accounting
  • Net Loss was ($26.8) million compared to a Net Loss of ($3.6) million for the same period last year
  • Adjusted EBITDA of $7.9 million was 25% of revenue, compared to $5.8 million for the same period last year
  • Colorado two year stacked IDs for Q1 2022 compared to Q1 2021 and 2020 for same store sales(1) were 22.7% and one year IDs(1) were (8.1%) comparing Q1 2022 to Q1 2021
    • Average basket size (1) for Q1 2022 was $59.21 down 1.7% compared to Q1 2021
    • Recorded customer visits (1) for Q1 2022 totaled 415,308 down 6.4%, compared to Q1 2021
  • New Mexico two year stacked IDs for Q1 2022 compared to Q1 2021 and Q1 2020 for same store sales(1) were 37.3% and one year IDs(1) were (1.9%) comparing Q1 2022 to Q1 2021
    • Average basket size (1) for Q1 2022 was $59.94 down 1.6% compared to Q1 2021
    • Recorded customer visits (1) for Q1 2022 totaled 122,913 down slightly at 0.3%, compared to Q1 2021

Accomplishments for Q1 2022
Since December 2021, Schwazze has closed acquisitions adding 14 cannabis dispensaries, 10 in New Mexico and four in Colorado as well as four cultivation facilities in New Mexico and one in Colorado and one manufacturing asset in New Mexico.

Q1 2022

  • Listed Common Stock on the NEO Exchange
  • Signed Definitive Agreement to Acquire Assets of Urban Health & Wellness
  • Closed Acquisition of Brow 2 LLC Assets
  • Closed Acquisition of Emerald Fields
  • Added President of New Mexico Division
  • Closed New Mexico Acquisition, Becoming a Regionally Focused MSO
  • Added to Key Senior Leadership Team
  • Closed Acquisition of Drift Assets

Justin Dye, Chairman and CEO of Schwazze stated
, “as we continued our successful transformation into a Regional
MSO in the first quarter of 2022, we met certain challenges, including the
comparison cycling of an inflated Q1 2021, which was aided by stimulus checks
and COVID lockdowns.  Colorado’s high COVID rates during Q1 2022 also
impacted sales and internal staff. The devastating Marshall Fires in and around
Boulder in January of this year, caused one store to temporarily close and the
store has been further impacted due to a displaced population in and around
Boulder County. Also, overall sales and a decrease in wholesale revenue was
largely impacted by wholesale distillate pricing pressure and over-supply in
the state of Colorado.”

Justin continued, “however, we
remain optimistic regarding our continued growth for the remainder of the year
as we believe that Colorado’s first quarter was impacted by macro events. 
We are starting to see more positive results entering the second quarter. We
are pleased to report that the sales trends in New Mexico, which recently
commenced selling recreational-use cannabis on April 1, have seen positive
results, and we remain confident in the future growth of this market.  Our
revenue continues to grow with a 64% increase overall when comparing Q1 2022 to
Q1 2021, with retail sales growing to $26.5 million for the quarter, a 124%
increase compared to Q1 2021. While basket sales and customer visits for both
Colorado and New Mexico were down quarter over-quarter, attributed to macro
events and previous stimulus spending, we once again outpaced the industry
performance in the state of Colorado for the quarter by 10.2%.  At this
time, we do not have a service that publishes comparable market stats in New
Mexico, therefore we will be working on how to compare our performance in the
near future.”

Q1 2022 Revenue
Revenues for Q1 2022, totaled $31.8 million including (i) retail sales of $26.5 million (ii) wholesale sales of $5.2 million and (iii) other operating revenues of $0.04 million, compared to revenues of $19.3 million including (i) retail sales of $11.8 million (ii) wholesale of $7.4 million, and (iii) other operating revenues of $0.08 million during Q1 2021 and represented an increase of $12.4 million or 64%. Increased sales are due in large part to additional dispensary sales.  In Q1 2022, we acquired fourteen new retail dispensaries. The decrease in wholesale revenue in 2022 was largely due to wholesale distillate pricing pressure and over-supply in the state of Colorado.

Cost of goods and services for Q1 2022, totaled $20.8 million compared to cost of goods and services of $12.1 million during Q1 2021, representing an increase of $8.7 million or 72%. This increase was due to increased sales and growth through acquisition. The cost of goods and services increased at a higher rate than revenue due to the impact of purchase accounting on retail acquisitions made in the each of the first quarters. Q1 2022 had $6.3 million in additional cost of goods and services due to purchase accounting while Q1 2021 had $2.2 million of additional cost of goods and services due to purchase accounting.

Gross profit increased to $10.9 million for Q 1 2022 compared to $7.3 million during the same period in 2021. Gross profit margin declined as a percentage of revenue from 37.5% to 34.4%, although net of purchase accounting, the gross margin increased from 48.7% to 54.1%.  This positive result, net of purchase accounting continues to reflect our consolidated purchasing approach, the implementation of our retail playbook, and vertical product sales in New Mexico.

Operating expenses for Q1 2022, totaled $15.7 million, compared to operating expenses of $8.7 million during Q1 2021, representing an increase of $7 million or 80%. This increase was due to increased selling, general and administrative expenses including acquisition costs, professional service fees related to acquisitions, salaries, benefits and related employment costs mostly related to the increased number of dispensaries.

Other expense, net for Q1 2022, totaled $20.7 million, compared to $1.7 million during Q1 2021. The increase in other expense, net was due to an increase in interest payments due to various loans and by the non-cash loss on derivative liability related to our 13% senior secured convertible notes due 2026.

As a result of the factors discussed above, a net loss was generated for the Q1 2022 of $26.8 million, compared to net loss of $3.6 million during Q1 2021.  This loss includes non-cash charges totaling $16.9 million; this includes derivative liability of $13.4 million, depreciation and amortization of $2.5 million and non-cash compensations of $1.0 million as well as acquisition and capital raise costs associated with the closing of recent acquisitions of $9.1 million, including $6.3 million of purchase accounting costs and $2.8 million of additional related costs.

Adjusted EBITDA for Q1 2022 was $7.9 million representing 25% of revenue, compared to $5.8 million for the same period last year. This is derived from Operating Income and adjusting one-time expenses, merger and acquisition and capital raising costs, non-cash related compensation costs, and depreciation and amortization. See the financial table for Adjusted EBITDA below adjustment for details. 

For Q1 2022, the Company generated net cash provided from operations of $5.8 million compared to $1.7 million for the same period in 2021.  The Company has cash and cash equivalents of $47.1 million at the end of Q1 2022. 

Nancy Huber, CFO for Schwazze commented, “Q1
2022 included four acquisitions in January and February expanding the company
in all areas.  We also found ourselves cycling large numbers from the
previous year and were impacted by COVID as many businesses in Colorado were
similarly affected in January. As we move forward in quarters not complicated
by acquisitions costs, we are targeting to have positive operating
income.  We remain focused on continuing to drive our operating playbook
through all our businesses and plan to outperform the market.  We
delivered positive operating cash flow despite a challenging quarter.  We
will continue to invest that cashflow in growth opportunities both organically
and through acquisitions.”

2022 Guidance
The Company’s guidance, issued for 2022 remains unchanged.  Guidance has been issued for a fourth-quarter 2022 (Q4 2022) annualized run rate, which excludes transactions that are announced but not closed.  Q4 2022 revenue annualized run rate is projected to be approximately $220 Million to $260 Million, and the projected Q4 2022 adjusted EBITDA annualized run rate is projected to be from $70 million to $82 million.  

NOTES:

(1)  Schwazze
did not own all the assets and entities in part of 2021, 2020 and 2019 and is
using unaudited numbers for this comparison.


Adjusted EBITDA represents income (loss) from operations, as reported, before
tax, adjusted to exclude non-recurring items, other non-cash items, including
stock-based compensation expense, depreciation, and amortization, and further
adjusted to remove acquisition and capital raise related costs, and other
one-time expenses, such as severance, retention, and employee relocation. The
Company uses adjusted EBITDA as it believes it better explains the results of
its core business. The Company has not reconciled guidance for adjusted EBITDA
to the corresponding GAAP financial measure because it cannot provide guidance
for the various reconciling items. The Company is unable to provide guidance
for these reconciling items because it cannot determine their probable
significance, as certain items are outside of its control and cannot be
reasonably predicted. Accordingly, a reconciliation to the corresponding GAAP
financial measure is not available without unreasonable effort.

Webcast – May 16, 2022 – 4:30 EDT
Investors and stakeholders may participate in the conference call by dialing 416-764-8650 or by dialing North American toll free 888-664-6383 or listen to the webcast from the Company’s website at https://ir.schwazze.com . The webcast will be available on the Company’s website and on replay until May 23, 2022, and may be accessed by dialing 888-390-0541 / 117902#.

Following their prepared remarks, Chief Executive Officer, Justin Dye and Chief Financial Officer, Nancy Huber will answer investor questions. Investors may submit questions in advance or during the conference call itself through the weblink: https://produceredition.webcasts.com/starthere.jsp?ei=1548621&tp_key=88d9ed2417  This weblink has been posted to the Company’s website and will be archived on the website. All Company SEC filings can also be accessed on the Company website at https://ir.schwazze.com/sec-filings  and on SEDAR at www.sedar.com  

About Schwazze
Schwazze (OTCQX: SHWZ) is building a premier vertically integrated regional cannabis company with assets in Colorado and New Mexico and will continue to take its operating system to other states where it can develop a differentiated regional leadership position. Schwazze is the parent company of a portfolio of leading cannabis businesses and brands spanning seed to sale. The Company is committed to unlocking the full potential of the cannabis plant to improve the human condition. Schwazze is anchored by a high- performance culture that combines customer-centric thinking and data science to test, measure, and drive decisions and outcomes. The Company’s leadership team has deep expertise in retailing, wholesaling, and building consumer brands at Fortune 500 companies as well as in the cannabis sector. Schwazze is passionate about making a difference in our communities, promoting diversity and inclusion, and doing our part to incorporate climate-conscious practices. Medicine Man Technologies, Inc. was Schwazze’s former operating trade name. The corporate entity continues to be named Medicine Man Technologies, Inc. Schwazze derives its name from the pruning technique of a cannabis plant to enhance plant structure and promote healthy growth.

Forward-Looking Statements
This press release contains “forward-looking statements.” Such statements may be preceded by the words “plan,” “will,” “may,” “continue,” “predicts,” “targeting” or similar words. Forward-looking statements include the guidance provided regarding the Company’s Q4 2022 performance and annual capital spending. Forward-looking statements are not guarantees of future events or performance, are based on certain assumptions, and are subject to various known and unknown risks and uncertainties, many of which are beyond the Company’s control and cannot be predicted or quantified. Consequently, actual events and results may differ materially from those expressed or implied by such forward-looking statements. Such risks and uncertainties include, without limitation, risks and uncertainties associated with (i) our inability to manufacture our products and product candidates on a commercial scale on our own or in collaboration with third parties; (ii) difficulties in obtaining financing on commercially reasonable terms; (iii) changes in the size and nature of our competition; (iv) loss of one or more key executives or scientists; (v) difficulties in securing regulatory approval to market our products and product candidates; (vi) our ability to successfully execute our growth strategy in Colorado and New Mexico and outside the states, (vii) our ability to identify and consummate future acquisitions that meet our criteria, (viii) our ability to successfully integrate acquired businesses and realize synergies therefrom, (ix) the ongoing COVID-19 pandemic, (x) the timing and extent of governmental stimulus programs, (xi) the uncertainty in the application of federal, state and local laws to our business, and any changes in such laws, and (xii) our ability to achieve the target metrics, including our annualized revenue and EBIDTA run rates set out in our Q4 2022 guidance. More detailed information about the Company and the risk factors that may affect the realization of forward-looking statements is set forth in the Company’s filings with the Securities and Exchange Commission (SEC), including the Company’s Annual Report on Form 10-K and its Quarterly Reports on Form 10-Q. Investors and security holders are urged to read these documents free of charge on the SEC’s website at http://www.sec.gov. The Company assumes no obligation to publicly update or revise its forward-looking statements as a result of new information, future events or otherwise except as required by law.

MEDICINE MAN
TECHNOLOGIES, INC.
CONSOLIDATED BALANCE SHEETS
For the Three Months
ended March 31, 2022 and 2021
Expressed in U.S. Dollars

March 31,

December 31,

2022

2021

ASSETS

(Unaudited)

(Audited)

Current assets

Cash and cash equivalents

$

47,688,094

$

106,400,216

Accounts receivable, net of allowance for doubtful accounts

4,196,533

3,866,828

Inventory

16,380,765

11,121,997

Note receivable – current, net

107,500

Prepaid expenses and other current assets

3,008,326

2,523,214

Total current assets

71,381,218

123,912,255

Non-current assets

Fixed assets, net accumulated depreciation of $2,390,922 and $1,988,973, respectively

16,601,696

10,253,226

Goodwill

118,698,717

43,316,267

Intangible assets, net of accumulated amortization of $9,791,597 and $7,652,750, respectively

95,443,483

97,582,330

Marketable securities, net of unrealized loss of $8,549 and gain of $216,771, respectively

485,004

493,553

Note receivable – noncurrent, net

143,333

Accounts receivable – litigation

290,648

303,086

Other noncurrent assets

1,384,863

514,962

Operating lease right of use assets

13,721,007

8,511,780

Total non-current assets

246,625,418

161,118,537

Total assets

$

318,006,636

$

285,030,792

LIABILITIES AND
STOCKHOLDERS’ DEFICIT

Current liabilities

Accounts payable

$

3,106,503

$

2,548,885

Accounts payable – related party

100,128

36,820

Accrued expenses

15,308,676

5,592,222

Derivative liabilities

48,340,485

34,923,013

Notes payable – related party

134,498

134,498

Income taxes payable

3,287,635

2,027,741

Total current liabilities

70,277,925

45,263,179

Long term debt

117,863,486

97,482,468

Lease liabilities

14,082,673

8,715,480

Total long-term liabilities

131,946,159

106,197,948

Total liabilities

202,224,084

151,461,127

Stockholders’ equity

Common stock, $0.001 par value. 250,000,000 shares authorized; 53,484,820 shares issued and 52,746,376 shares outstanding at March 31, 2022 and 45,455,490 shares issued and 44,717,046 shares outstanding as of December 31, 2021.

53,486

45,485

Preferred stock, $0.001 par value. 10,000,000 shares authorized; 86,994 shares issued and 82,594 outstanding at March 31, 2022 and December 31, 2021 and 10,000,000 shares authorized.

87

87

Additional paid-in capital

171,798,685

162,815,097

Accumulated deficit

(54,552,670)

(27,773,968)

Common stock held in treasury, at cost, 517,044 shares held as of March 31, 2022 and December 31, 2021.

(1,517,036)

(1,517,036)

Total stockholders’ equity

115,782,552

133,569,665

Total liabilities and stockholders’ equity

$

318,006,636

$

285,030,792


See accompanying notes to the financial statements


MEDICINE MAN
TECHNOLOGIES, INC.
CONSOLDIATED STATEMENT OF OPERATIONS AND COMPREHENSIVE LOSS (UNAUDITED)
For the Three Months
ended March 31, 2022 and 2021
Expressed in U.S. Dollars

For the Three Months
Ended

March 31,

2022

2021

(Unaudited)

(Unaudited)

Operating revenues

Retail

$

26,525,716

$

11,816,200

Wholesale

5,207,388

7,446,265

Other

44,450

77,650

Total revenue

31,777,554

19,340,115

Cost of goods and services

Cost of goods and services

20,840,051

12,087,111

Total cost of goods and services

20,840,051

12,087,111

Gross profit

10,937,503

7,253,004

Operating expenses

Selling, general and administrative expenses

6,855,711

3,189,638

Professional services

2,584,472

2,195,108

Salaries

5,296,777

1,869,358

Stock based compensation

991,083

1,483,806

Total operating expenses

15,728,043

8,737,910

Loss from operations

(4,790,540)

(1,484,906)

Other income (expense)

Interest expense, net

(7,302,254)

(961,282)

Unrealized loss on derivative liabilities

(13,417,472)

(1,253,814)

Other expense

7

Gain (loss) on sale of assets

292,479

Unrealized gain on investments

(8,549)

214,630

Total other expense

(20,728,268)

(1,707,987)

Provision for income taxes

1,259,894

456,614

Net loss

$

(26,778,702)

$

(3,649,507)

Less: Accumulated preferred stock dividends for the period

(1,743,444)

Net loss attributable to common stockholders

$

(28,522,146)

$

(3,649,507)

Earnings (loss) per share attributable to common stockholders

Basic earnings (loss) per share

$

(0.61)

$

(0.09)

Weighted average number of shares outstanding – basic

46,841,971

42,616,309

Comprehensive loss

$

(26,778,702)

$

(3,649,507)


See accompanying notes to the financial statements


MEDICINE MAN
TECHNOLOGIES, INC.
STATEMENT OF CASH FLOWS (UNAUDITED)
For the Three Months
ended March 31, 2022, and 2021
Expressed in U.S. Dollars

For the Three Months Ended

March 31,

2022

2021

Cash flows from operating activities

Net income (loss) for the period

(26,778,702)

(3,649,507)

Adjustments to reconcile net income to cash used in operating activities

Depreciation and amortization

2,540,796

1,790,568

Loss on change in derivative liabilities

13,417,472

1,253,814

(Gain) loss on investment, net

8,549

(214,630)

Stock based compensation

991,083

1,483,806

Changes in operating assets and liabilities (net of acquired amounts):

Accounts receivable

(120,388)

(1,014,189)

Inventory

6,628,634

225,878

Prepaid expenses and other current assets

104,888

(12,816)

Other assets

(867,401)

(371,831)

Operating leases right of use assets and liabilities

157,966

33,334

Accounts payable and other liabilities

8,488,283

2,224,092

Deferred revenue

(50,000)

Income taxes payable

1,259,894

Net cash provided by operating activities

5,831,074

1,698,519

Cash flows from investing activities:

Cash consideration for acquisition of business

(90,317,153)

(65,109,039)

Purchase of fixed assets

(2,607,567)

(633,114)

Issuance of notes receivable

141,680

Net cash used in investing activities

(92,924,719)

(65,600,473)

Cash flows from financing activities:

Proceeds from issuance of debt

18,203,332

39,748,852

Debt issuance and discount costs

2,177,685

599,389

Repayment of notes payable

(5,000,000)

Proceeds from issuance of common stock, net of issuance costs

8,000,506

50,282,798

Net cash provided by financing activities

28,381,522

85,631,039

Net (decrease) increase in cash and cash equivalents

(58,712,122)

21,729,085

Cash and cash equivalents at beginning of period

106,400,216

1,231,235

Cash and cash
equivalents at end of period

$

47,688,094

$

22,960,320

Supplemental disclosure of cash flow information:

Cash paid for interest

$

4,722,639

$

897,247

Issuance of stock as payment for acquisitions

8,000,506

20,239,980


See accompanying notes to the financial statements


MEDICINE MAN
TECHNOLOGIES, INC.
Adjusted EBITDA Reconciliation
Non-GAAP measurement
(UNAUDITED)

Three Months Ended

March 31,

2022

2021

Net income (loss)

$ (26,778,702)

$   (3,649,507)

Interest (income) expense, net

7,302,254

961,282

Provision for income taxes (benefit)

1,259,894

456,614

Other (income) expense

13,426,014

746,705

Depreciation and amortization

2,540,796

1,790,568

Earnings before
interest, taxes, depreciation and

amortization (EBITDA)
(non-GAAP measure)

$   (2,249,744)

$       
305,662

Non-Cash Stock Compensation

991,083

1,483,806

Deal Related Expenses

2,256,934

745,944

Capital Raise Related Expenses

564,320

951,119

Inventory Adjustment to fair market value for purchase accounting

6,260,434

2,164,686

Severance

4,565

16,266

Retention Program Expenses

29,688

Employee Relocation Expenses

18,778

20,000

Other non-recurring items

17,911

127,167

Adjusted EBITDA (non-GAAP measure)

$     7,864,281

$     5,844,338

7,864,281

5,844,338

Revenue

31,777,554

19,340,115

   
 aEBITDA Percent

24.7%

30.2%


Cision View original content to download multimedia:https://www.prnewswire.com/news-releases/schwazze-announces-first-quarter-results-301548165.html

SOURCE Schwazze

Released May 16, 2022

Avivagen Inc. (VIVXF) – The China Road Is Now Open

Friday, May 13, 2022

Avivagen Inc. (VIVXF)
The China Road Is Now Open

Avivagen is a life sciences corporation focused on developing and commercializing products for livestock, companion animal and human applications that, by safely supporting immune function, promote general health and performance. It is a public corporation traded on the TSX Venture Exchange under the symbol VIV and is headquartered in Ottawa, Canada, based in partnership facilities of the National Research Council of Canada. For more information, visit www.avivagen.com. The contents of the website are expressly not incorporated by reference in this press release.

Joe Gomes, Senior Research Analyst, Noble Capital Markets, Inc.

Joshua Zoepfel, Research Associate, Noble Capital Markets, Inc.

Refer to the full report for the price target, fundamental analysis, and rating.

China Approval. Avivagen’s oxidized carotenoid-based feed additive, OxC-beta, has received approval for use in China. This is a significant accomplishment for Avivagen and should have a positive impact on operating results going forward. China marks the second key market, along with Vietnam, in which OxC-beta has received approval this year. With China and Vietnam approvals and the land-mark eight-year deal with AB Vista for exclusive distribution of OxC-beta for use with poultry, swine, ruminants (dairy and beef), and aquaculture in the U.S., Brazil, and Thailand, we believe Avivagen is on the cusp of significant revenue growth.

Number 1. China is the world’s largest feed market. According to Alltech Agri-Food Outlook, the country will produce over 261 million metric tons of feed in 2022. In addition, the country also experienced the largest increase in feed production by tonnage during 2021, as the country’s feed industry continues to consolidate and modernize. China has been a leader in efforts to reduce antibiotic use with livestock nationwide, in an effort to reduce antimicrobial-resistance in the region, which plays directly into OxC-beta’s strengths….

This Company Sponsored Research is provided by Noble Capital Markets, Inc., a FINRA and S.E.C. registered broker-dealer (B/D).

*Analyst certification and important disclosures included in the full report. NOTE: investment decisions should not be based upon the content of this research summary. Proper due diligence is required before making any investment decision. 

Harte Hanks (HHS) – A Great Start To The Year

Friday, May 13, 2022

Harte Hanks (HHS)
A Great Start To The Year

Harte Hanks (NASDAQ: HHS) is a leading global customer experience company whose mission is to partner with clients to provide them with CX strategy, data-driven analytics and actionable insights combined with seamless program execution to better understand, attract, and engage their customers. Using its unparalleled resources and award-winning talent in the areas of Customer Care, Fulfillment and Logistics, and Marketing Services, Harte Hanks has a proven track record of driving results for some of the world’s premier brands including Bank of America, GlaxoSmithKline, Unilever, Pfizer, HBOMax, Volvo, Ford, FedEx, Midea, Sony, and IBM among others. Headquartered in Chelmsford, Massachusetts , Harte Hanks has over 2,500 employees in offices across the Americas, Europe and Asia Pacific .

Michael Kupinski, Director of Research, Noble Capital Markets, Inc.

Patrick McCann, Research Associate, Noble Capital Markets, Inc.

Refer to the full report for the price target, fundamental analysis, and rating.

Q1 beats expectations. The company reported Q1 revenue of $49.1 million, a 12.1% increase over the prior year quarter and a solid 7.1% above our estimate of $45.8 million. Adj. EBITDA of $4.8 million, which increased 114% above the prior year quarter, beat our estimate of $2.3 million by 108%.

Fulfillment & Logistics booming. A key driver of the company’s strong quarter was its Fulfillment & Logistics Services segment, which increased revenue 28.4%, a sequential improvement from Q4 at 24.5%. Fulfillment & Logistics will likely be a key revenue driver for the company in 2022, in addition to improving revenue trends in its Marketing Services segment.

This Company Sponsored Research is provided by Noble Capital Markets, Inc., a FINRA and S.E.C. registered broker-dealer (B/D).

*Analyst certification and important disclosures included in the full report. NOTE: investment decisions should not be based upon the content of this research summary. Proper due diligence is required before making any investment decision. 

Sierra Metals (SMTS) – On the Road to Recovery

Friday, May 13, 2022

Sierra Metals (SMTS)
On the Road to Recovery

Sierra Metals Inc. is a diversified Canadian mining company with Green Metal exposure including increasing copper production and base metal production with precious metals byproduct credits, focused on the production and development of its Yauricocha Mine in Peru, and Bolivar and Cusi Mines in Mexico. The Company is focused on increasing production volume and growing mineral resources. Sierra Metals has recently had several new key discoveries and still has many more exciting brownfield exploration opportunities at all three Mines in Peru and Mexico that are within close proximity to the existing mines. Additionally, the Company also has large land packages at all three mines with several prospective regional targets providing longer-term exploration upside and mineral resource growth potential.

Mark Reichman, Senior Research Analyst, Natural Resources, Noble Capital Markets, Inc.

Refer to the full report for the price target, fundamental analysis, and rating.

First quarter earnings exceed expectations. Sierra Metals reported first quarter adjusted net income of $5.9 million, or $0.04 per share, compared with $4.7 million, or $0.03 per share, during the prior year period and our estimate of $5.5 million, or $0.03 per share. Adjusted EBITDA amounted to $16.0 million compared to $27.9 million during the prior year period. The company appears well on its way toward achieving its 2022 production guidance in the range of 79.5 million to 89.7 million pounds of copper equivalent.

Updating estimates. We have increased our 2022 EPS and EBITDA estimates to $0.23 and $101.9 from $0.21 and $100.8 million, respectively. We expect steady growth in EBITDA throughout the year as Bolivar ramps up production and the company makes up for lost first quarter production at Yauricocha during the remainder of the year. While Yauricocha and Bolivar cash and all in sustaining costs per copper equivalent pound remained elevated during the first quarter, management expects achieve its 2022 cost guidance based on higher levels of production during the balance of the year….

This Company Sponsored Research is provided by Noble Capital Markets, Inc., a FINRA and S.E.C. registered broker-dealer (B/D).

*Analyst certification and important disclosures included in the full report. NOTE: investment decisions should not be based upon the content of this research summary. Proper due diligence is required before making any investment decision. 

Kelly Services (KELYA) – A Productive Start to the Year

Friday, May 13, 2022

Kelly Services (KELYA)
A Productive Start to the Year

Kelly (Nasdaq: KELYA, KELYB) connects talented people to companies in need of their skills in areas including Science, Engineering, Education, Office, Contact Center, Light Industrial, and more. We’re always thinking about what’s next in the evolving world of work, and we help people ditch the script on old ways of thinking and embrace the value of all workstyles in the workplace. We directly employ nearly 350,000 people around the world and connect thousands more with work through our global network of talent suppliers and partners in our outsourcing and consulting practice. Revenue in 2021 was $4.9 billion. Visit kellyservices.com and let us help with what’s next for you.

Joe Gomes, Senior Research Analyst, Noble Capital Markets, Inc.

Joshua Zoepfel, Research Associate, Noble Capital Markets, Inc.

Refer to the full report for the price target, fundamental analysis, and rating.

1Q22. Revenue of $1.296 billion was up 7.5% year-over-year (9% in constant currency). Consensus was $1.26 billion and we were also at $1.26 billion. Kelly reported operating earnings of $23.4 million, compared to $10.6 million a year ago. We were at $11.0 million. GAAP loss per share was $1.23 compared to GAAP net income of $0.64/sh. Adjusted EPS for the first quarter was $0.46 versus $0.12 last year. We had projected adjusted EPS of $0.23.

GP Rate Continues to Improve. Management has done a masterful job of increasing gross profit rate over the years, even in the face of the recent economic hardships, including COVID. GP rate for the quarter was 19.9%, up 220 basis points y-o-y. The improvement has come from a combination of steps to improve organic GP and the addition of higher margin specialty business through recent acquisitions. We believe GP rate can continue to increase….

This Company Sponsored Research is provided by Noble Capital Markets, Inc., a FINRA and S.E.C. registered broker-dealer (B/D).

*Analyst certification and important disclosures included in the full report. NOTE: investment decisions should not be based upon the content of this research summary. Proper due diligence is required before making any investment decision. 

Lineage Cell Therapeutics (LCTX) – 1Q22 Reported With Clinical Program Review

Friday, May 13, 2022

Lineage Cell Therapeutics (LCTX)
1Q22 Reported With Clinical Program Review

Lineage Cell Therapeutics is a clinical-stage biotechnology company developing novel cell therapies for unmet medical needs. Lineage’s programs are based on its robust proprietary cell-based therapy platform and associated in-house development and manufacturing capabilities. With this platform Lineage develops and manufactures specialized, terminally differentiated human cells from its pluripotent and progenitor cell starting materials. These differentiated cells are developed to either replace or support cells that are dysfunctional or absent due to degenerative disease or traumatic injury or administered as a means of helping the body mount an effective immune response to cancer. Lineage’s clinical programs are in markets with billion dollar opportunities and include five allogeneic (“off-the-shelf”) product candidates: (i) OpRegen, a retinal pigment epithelial cell therapy in Phase 1/2a development for the treatment of geographic atrophy secondary to age-related macular degeneration; (ii) OPC1, an oligodendrocyte progenitor cell therapy in Phase 1/2a development for the treatment of acute spinal cord injuries; (iii) VAC2, a dendritic cell therapy produced from Lineage’s VAC technology platform for immuno-oncology and infectious disease, currently in Phase 1 clinical development for the treatment of non-small cell lung cancer (iv) ANP1, an auditory neuronal progenitor cell therapy for the potential treatment of auditory neuropathy, and (v) PNC1, a photoreceptor neural cell therapy for the treatment of vision loss due to photoreceptor dysfunction or damage. For more information, please visit www.lineagecell.com or follow the company on Twitter @LineageCell.

Robert LeBoyer, Vice President, Research Analyst, Life Sciences , Noble Capital Markets, Inc.

Refer to the full report for the price target, fundamental analysis, and rating.

Lineage Reported 1Q22.  Lineage Cell Therapies reported a loss of $7.1 million or $(0.04) per share.  Revenues included recognition of a portion of the payment from the Roche/Genentech collaboration, with revenue to be recognized each quarter as obligations under the agreement are completed. Total Operating Expenses included a $3.5 million accrual for a legal settlement.  Cash at the end of the quarter was $78.1 million.

Payment Under The OpRegen Collaboration Will Be Amortized Over The Course Of The Agreement.  In December 2021, Lineage made a collaborative agreement with Roche/Genentech for development and commercialization of OpRegen, its RPE cell transplant for age-related macular degeneration (dry AMD).  Lineage received $50 million in signing fees in January, with a portion going to its early collaborators and licensors.  Lineage will be recognizing the fee as revenue as its obligations under the agreement are met.  We expect uneven, milestone-driven recognition over the next several quarters….

This Company Sponsored Research is provided by Noble Capital Markets, Inc., a FINRA and S.E.C. registered broker-dealer (B/D).

*Analyst certification and important disclosures included in the full report. NOTE: investment decisions should not be based upon the content of this research summary. Proper due diligence is required before making any investment decision. 

Release – Endeavour Silver Announces 2022 Annual General Meeting Voting Results


Endeavour Silver Announces 2022 Annual General Meeting Voting Results

Research, News, and Market Data on Endeavour Silver

VANCOUVER, British Columbia, May 13, 2022 (GLOBE NEWSWIRE)
— Endeavour Silver Corp. (“Endeavour” or the “Company”) (NYSE: EXK; TSX: EDR)
is pleased to announce that at the Company’s 2022 Annual General Meeting (“AGM”) held on May 12, 2022 in Vancouver, shareholders voted in favour of all items of business. A total of 74,416,771 votes were cast or represented by proxy at the AGM, representing 43.57% of the outstanding common shares as of the record date. The following is a tabulation of the votes submitted by proxy:

DIRECTORS

NUMBER OF SHARES

PERCENTAGE OF VOTES
CAST

FOR

WITHHELD/
ABSTAIN

FOR

WITHHELD

Margaret M. Beck

44,199,571

1,947,032

95.78%

4.22%

Ricardo M. Campoy

44,287,849

1,858,754

95.97%

4.03%

Bradford J. Cooke

42,952,074

3,194,529

93.08%

6.92%

Daniel Dickson

45,220,569

926,034

97.99%

2.01%

Amy Jacobsen

45,163,634

982,969

97.87%

2.13%

Rex J. McLennan

42,409,137

3,737,465

91.90%

8.10%

Kenneth Pickering

44,867,006

1,279,596

97.23%

2.77%

Mario D. Szotlender

44,085,535

2,061,067

95.53%

4.47%

All director nominees were re-elected.

On a vote by show of hands, shareholders voted in favour of re-appointing KPMG LLP as auditor of the Company and authorized the Board to fix the auditor’s remuneration for the ensuing year.

About Endeavour Silver – Endeavour Silver Corp. is a mid-tier precious metals mining company that operates two high-grade underground silver-gold mines in Mexico. Endeavour is currently advancing the Terronera mine project towards a development decision, pending financing and final permits and exploring its portfolio of exploration and development projects in Mexico, Chile and the United States to facilitate its goal to become a premier senior silver producer.  Our philosophy of corporate social integrity creates value for all stakeholders.

SOURCE Endeavour Silver Corp.

Contact Information
Trish Moran
Interim Head of Investor Relations
Tel: (416) 564-4290
Email: pmoran@edrsilver.com
Website: www.edrsilver.com