|
|
|
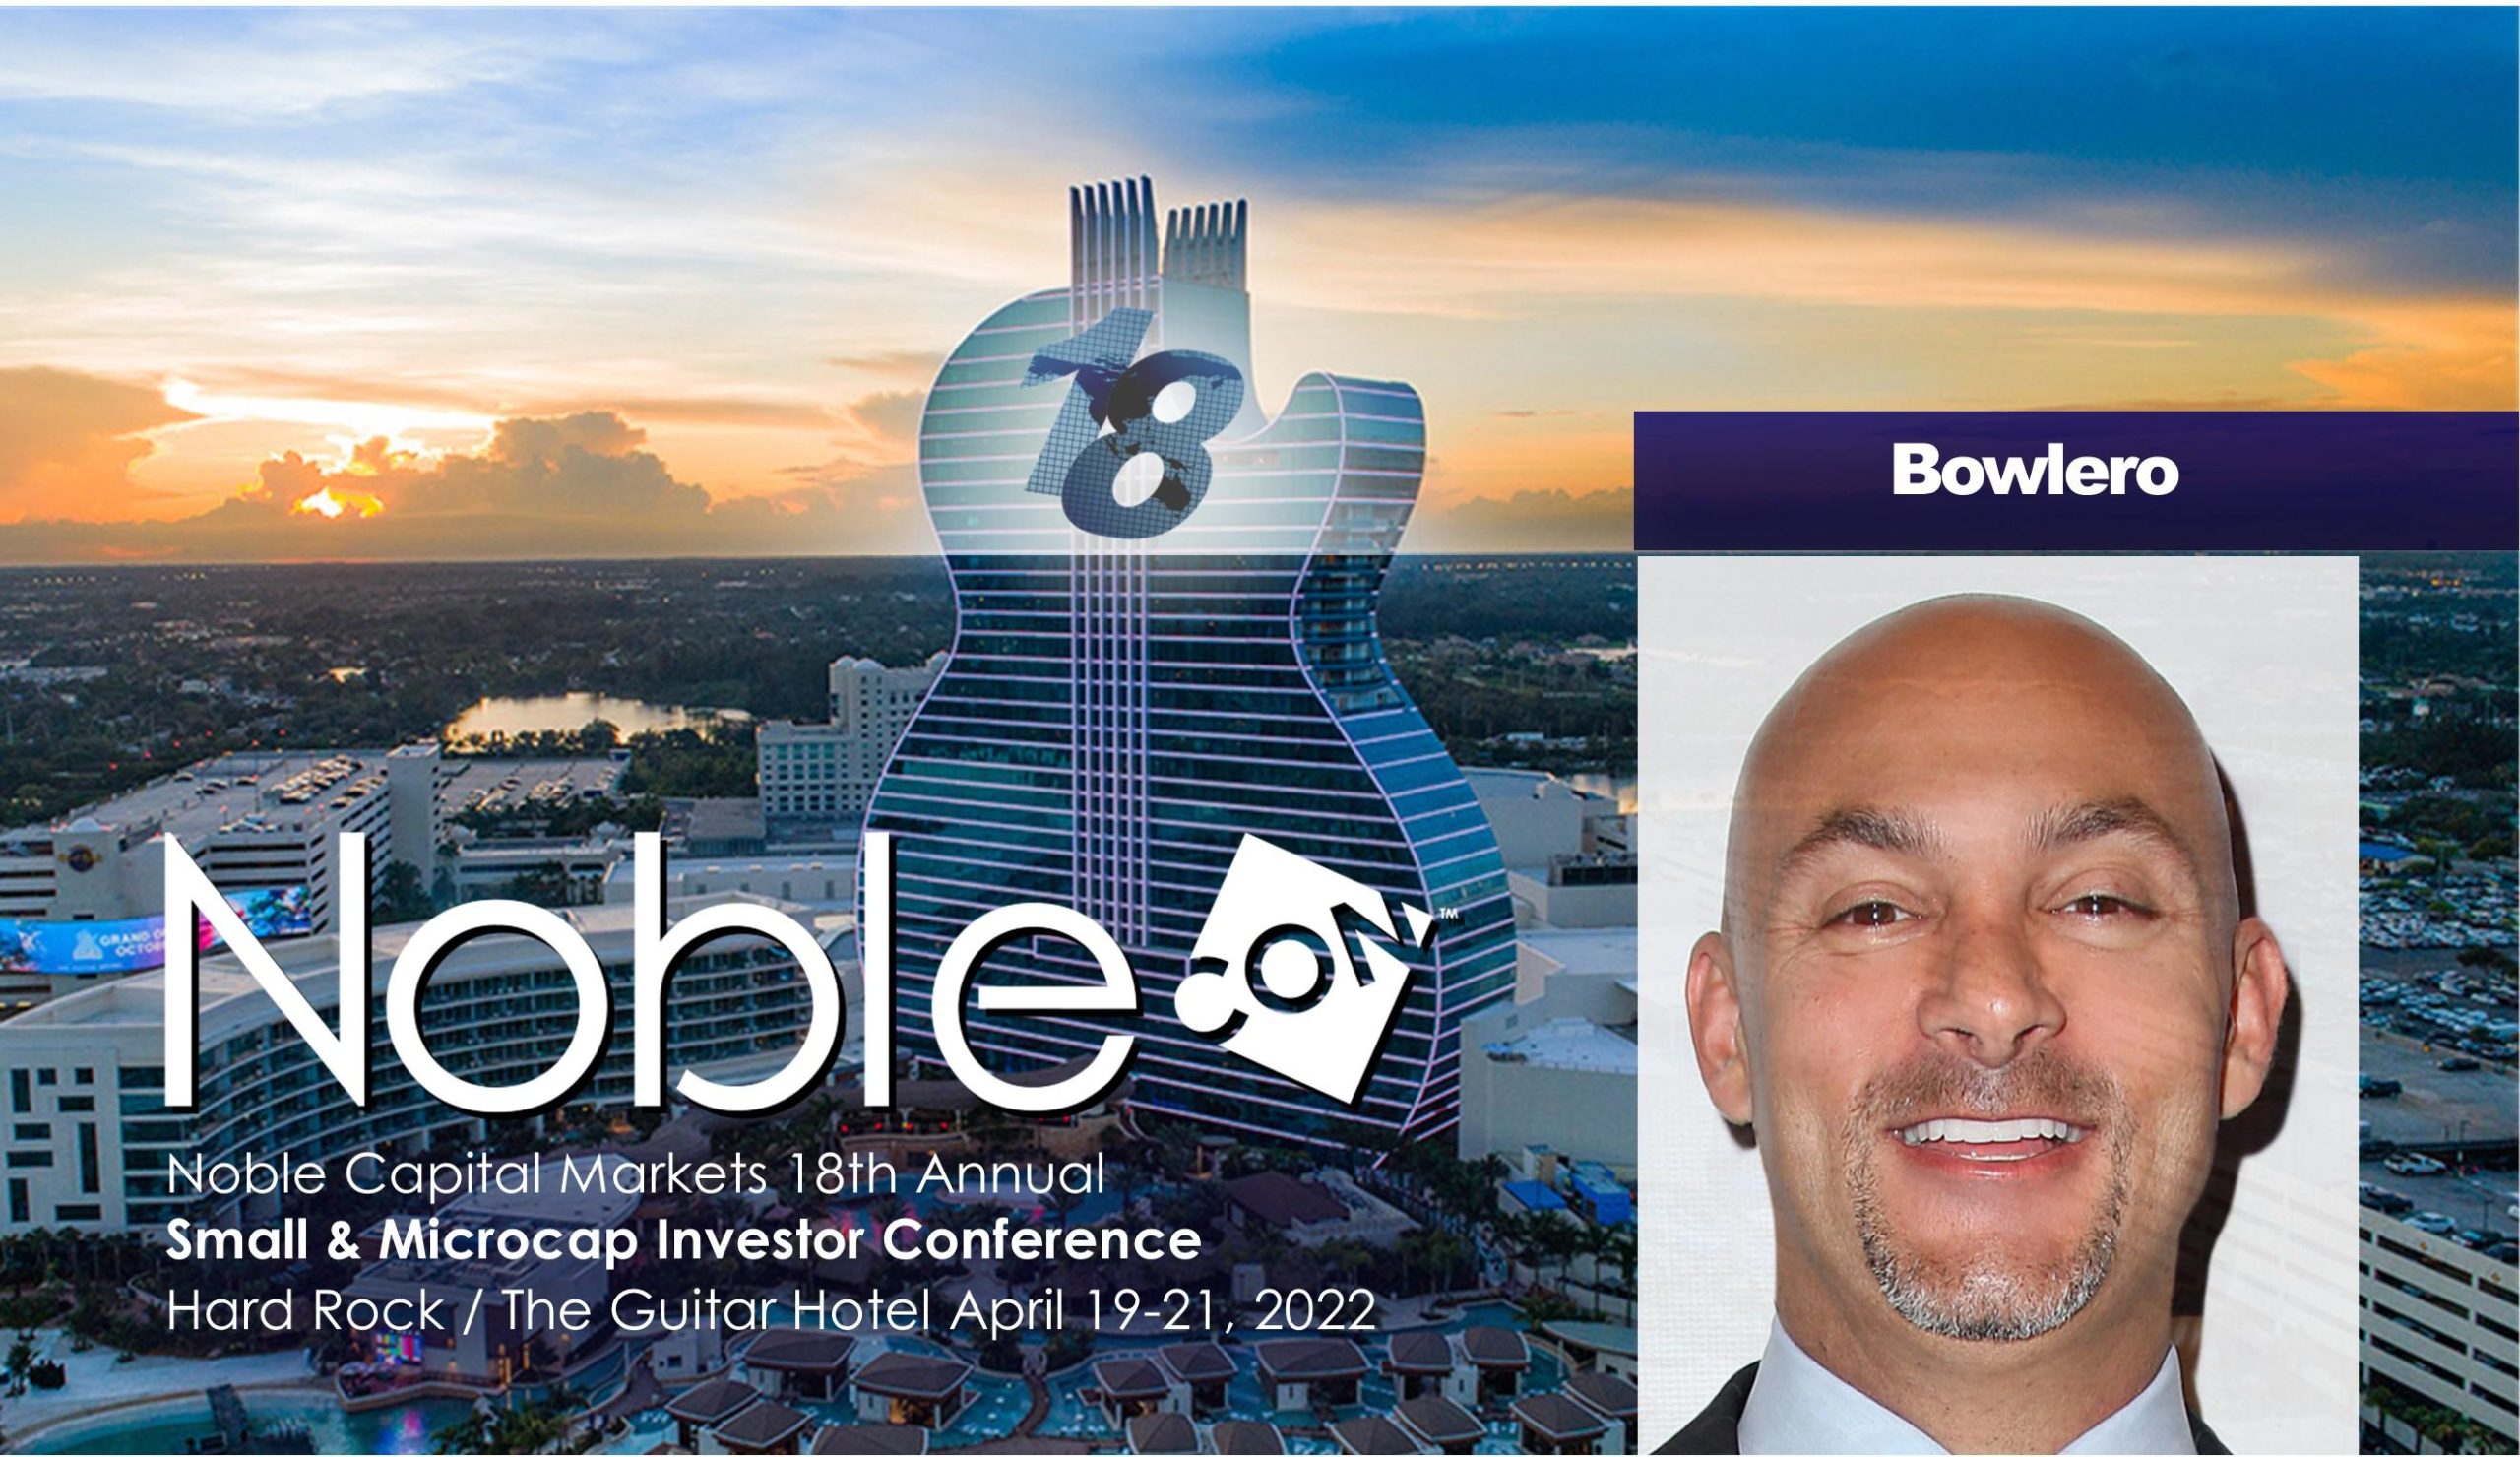
Bowlero provides a preview of their upcoming presentation at NobleCon18 NobleCon18 – Noble Capital Markets 18th Annual Small and Microcap Investor Conference – April 19-21, 2022 – Hard Rock, Hollywood, FL 100+ Public Company Presentations | Scheduled Breakouts | Panel Presentations | High-Profile Keynotes | Educational Sessions | Receptions & Networking Events Free Registration Available – More InfoResearch News and Advanced Market Data on BOWLNobleCon18 Presenting Companies
About Bowlero Bowlero Corp. is the worldwide leader in bowling entertainment. With more than 300 bowling centers across North America, Bowlero Corp. serves more than 26 million guests each year through a family of brands that includes Bowlero, Bowlmor Lanes, and AMF. Bowlero Corp. is also home to the Professional Bowlers Association, which it acquired in 2019 and which boasts thousands of members and millions of fans across the globe. For more information on Bowlero Corp., please visit BowleroCorp.com. |
Category:
GABY (GABLF) Scheduled to Present at NobleCon18 Investor Conference
|
|
|
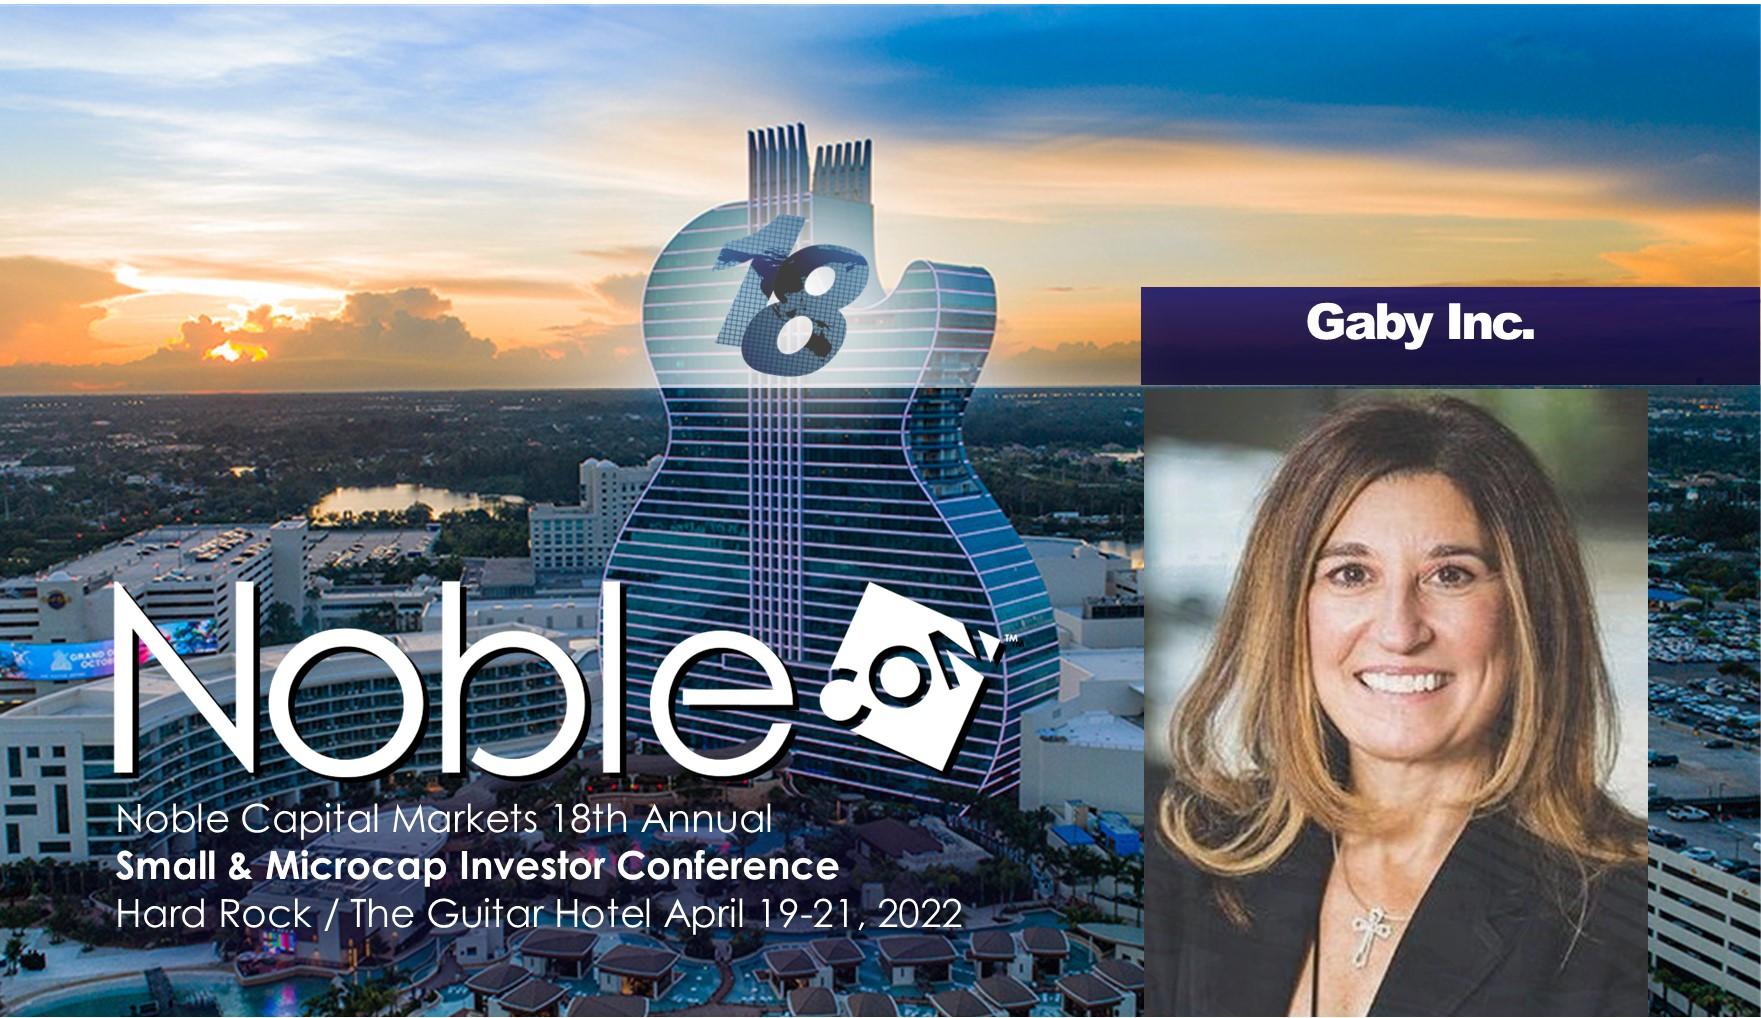
GABY Founder & CEO Margot Micallef provides a preview of their upcoming presentation at NobleCon18 NobleCon18 – Noble Capital Markets 18th Annual Small and Microcap Investor Conference – April 19-21, 2022 – Hard Rock, Hollywood, FL 100+ Public Company Presentations | Scheduled Breakouts | Panel Presentations | High-Profile Keynotes | Educational Sessions | Receptions & Networking Events Free Registration Available – More InfoResearch News and Advanced Market Data on GABLFNobleCon18 Presenting Companies
About GABY GABY Inc. is a California-focused retail consolidator and the owner of Mankind Dispensary, one of the oldest licensed dispensaries in California. Mankind is a well-known, and highly respected dispensary with deep roots in the California cannabis community operating in San Diego, California. GABY curates and sells a diverse portfolio of products, including its own proprietary brands, Lulu’s™ and Kind Republic™ through Mankind, manufactures Kind Republic, and distributes all its proprietary brands through its wholly owned subsidiary, GABY Manufacturing. A pioneer in the industry with a multi-vertical retail foundation, and a strong management team with experience in retail, consolidation, and cannabis, GABY is poised to grow its retail operations both organically and through acquisition. GABY’s shares trade on the Canadian Securities Exchange (“CSE”) under the symbol “GABY” and on the OTCQB under the symbol “GABLF”. For more information on GABY, visit GABYInc.com. |
Comstock Mining (LODE) Scheduled to Present at NobleCon18 Investor Conference
|
|
|
|
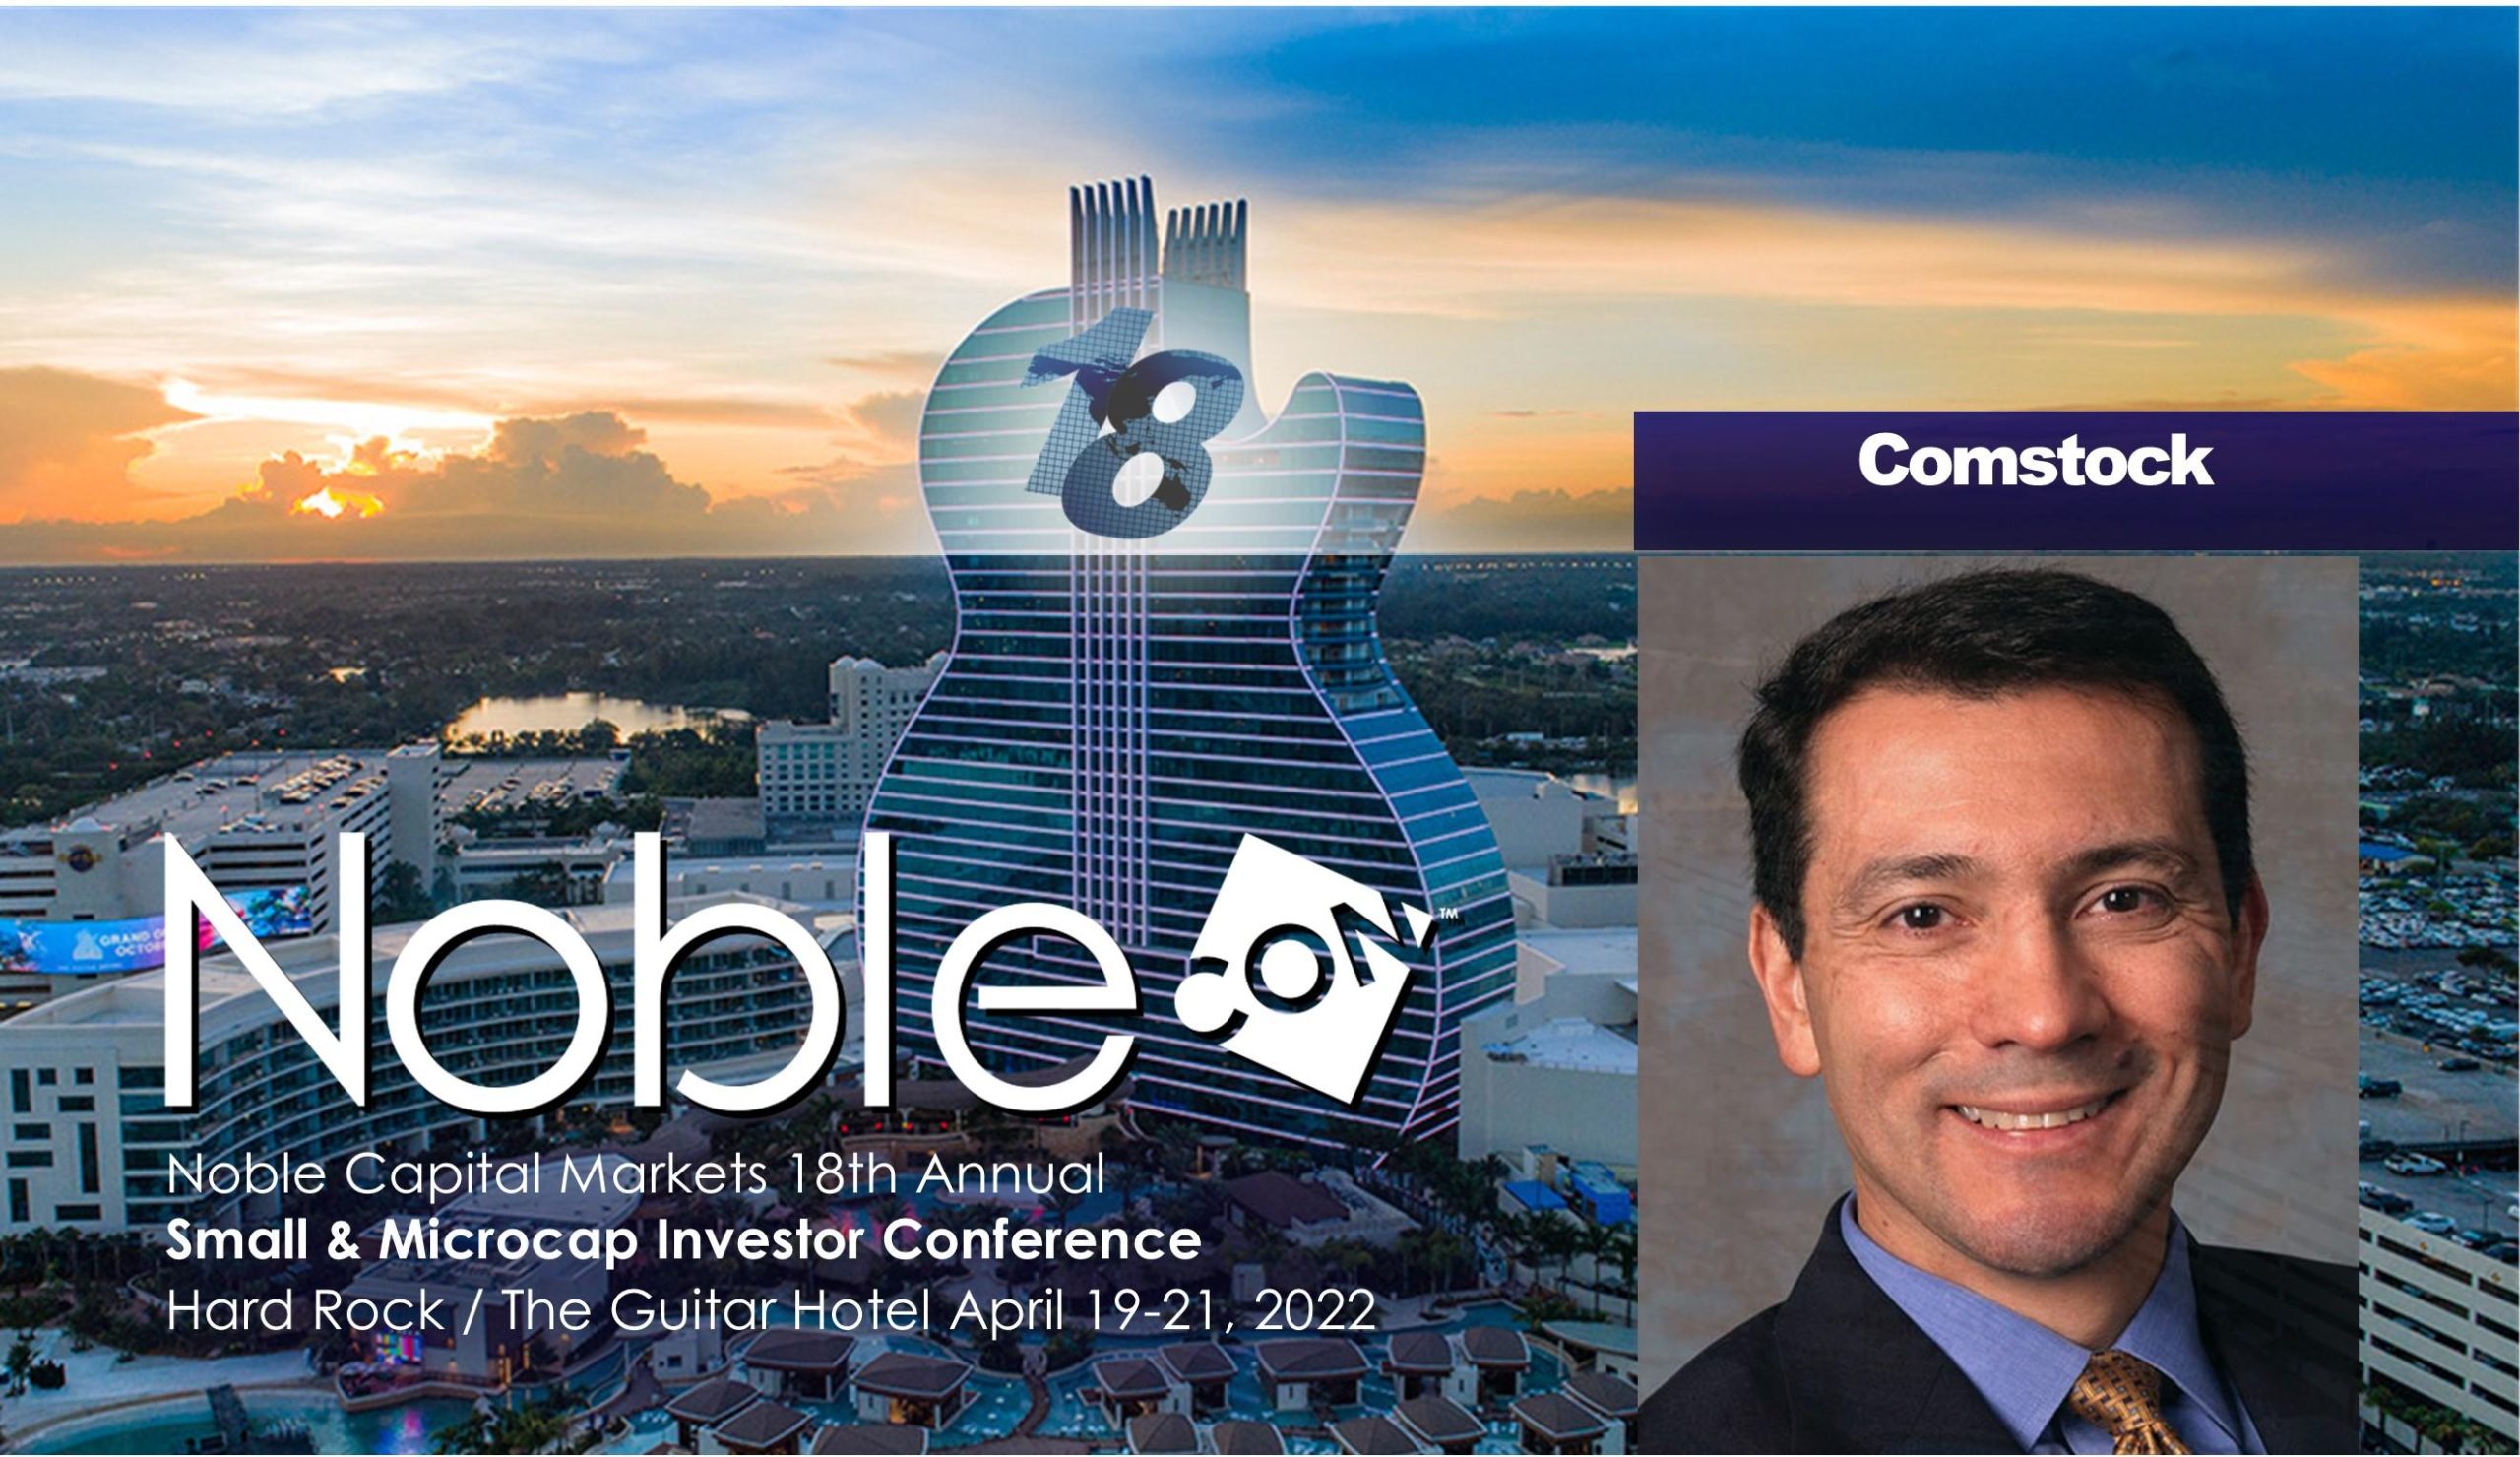
Comstock Chairman & CEO Corrado De Gasperis provides a preview of their upcoming presentation at NobleCon18 NobleCon18 – Noble Capital Markets 18th Annual Small and Microcap Investor Conference – April 19-21, 2022 – Hard Rock, Hollywood, FL 100+ Public Company Presentations | Scheduled Breakouts | Panel Presentations | High-Profile Keynotes | Educational Sessions | Receptions & Networking Events Free Registration Available – More InfoResearch News and Advanced Market Data on LODENobleCon18 Presenting Companies
About Comstock Comstock Mining Inc. (NYSE: LODE) innovates technologies that contribute to global decarbonization and circularity by efficiently converting massive supplies of under-utilized natural resources into renewable fuels and electrification products that contribute to balancing global uses and emissions of carbon. The Company intends to achieve exponential growth and extraordinary financial, natural, and social gains by building, owning, and operating a fleet of advanced carbon neutral extraction and refining facilities, by selling an array of complimentary process solutions and related services, and by licensing selected technologies to qualified strategic partners. To learn more, please visit www.comstock.inc. |


|
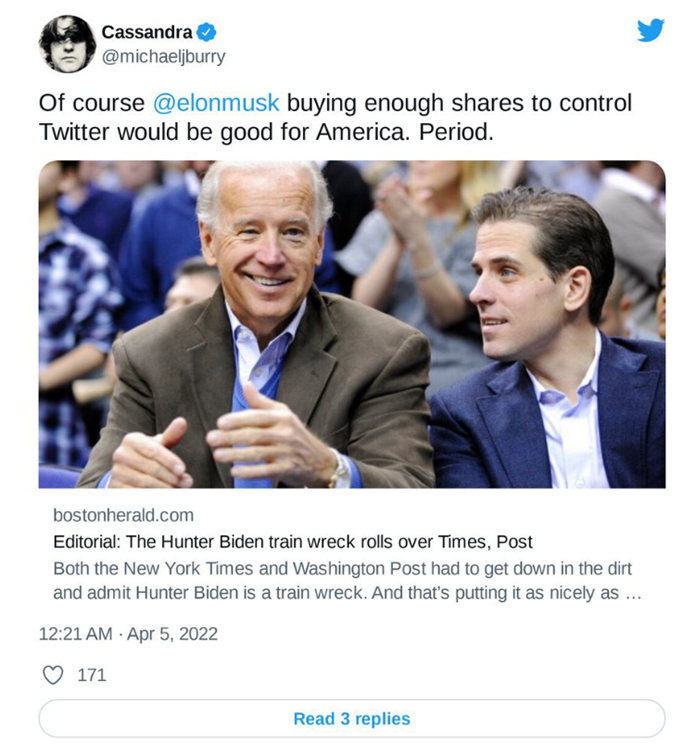
| Excerpt from Boston Herald, April 3, 2022 |
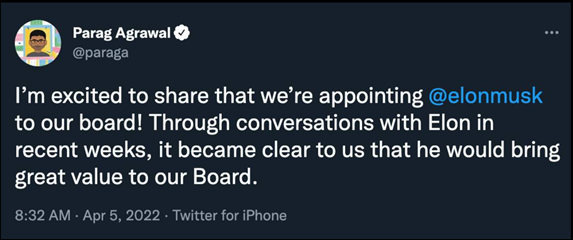
As the Boston Globe editorial points out, the Washington Post and New York Times are now admitting the laptop hard drive was genuine (18 months later). The feeling Burry seems to be expressing is that a more open social media platform would not have censored this story, and less censorship is positive for the country.
Dr. Burry seems to believe that Elon Musk will help steer the company toward a freer exchange of ideas and information.
Managing Editor, Channelchek
Suggested Reading
 Michael Burry Adjusts Tesla Position
|
 Why Michael Burry has Better Opportunity Than Cathie Wood
|
 Is the Index Bubble Michael Burry Warned About Still Looming?
|
 Twitter Gets a New Board Member Who Instantly Causes Stock to Rocket
|
Sources
https://nypost.com/2022/04/06/big-short-investor-elon-musks-twitter-buy-good-for-america/
https://twitter.com/michaeljburry/status/1511136888664510464
https://twitter.com/elonmusk/status/1460370293978013699
https://nypost.com/2022/03/30/washington-post-admits-hunter-biden-laptop-is-real/
Stay up to date. Follow us:

|
Release – PDS Biotechnology Reports Inducement Grants Under Nasdaq Listing Rule 5635(c)(4)
![]()
PDS Biotechnology Reports Inducement Grants Under Nasdaq Listing Rule 5635(c)(4)
Research, News, and Market Data on PDS Biotech
FLORHAM PARK, N.J., April 08, 2022 (GLOBE NEWSWIRE) — PDS Biotechnology Corporation (Nasdaq: PDSB), a clinical-stage immunotherapy company developing a growing pipeline of molecularly targeted cancer immunotherapies and infectious disease vaccines based on the Company’s proprietary Versamune® and Infectimune™ T-cell activating technologies, today announced that on April 6, 2022 PDS Biotech granted nonstatutory stock options to (a) Robert Imani, M.D., PhD, PDS Biotech’s Vice President Medical Director to purchase 70,000 shares of PDS Biotech common stock, and (b) Paul Ivany, PDS Biotech’s Senior Director Manufacturing Operations, to purchase 50,000 shares of PDS Biotech’s common stock, in each case, as a material inducement to their employment with PDS Biotech and in accordance with Nasdaq Listing Rule 5635(c)(4) and PDS Biotech’s 2019 Inducement Plan, as amended, which was adopted on June 17, 2019 and provides for the granting of equity awards to new employees of PDS Biotech.
Each stock option has an exercise price of $6.09, the closing price of PDS Biotech’s common stock on April 6, 2022. Each stock option vests over a four-year period, with one-quarter of the shares vesting on the first anniversary of the grant date and the remaining shares vesting monthly over the 36-month period thereafter, subject to continued employment with the company through the applicable vesting dates.
About PDS Biotechnology
PDS Biotech is a clinical-stage immunotherapy company developing a growing pipeline of molecularly targeted cancer and infectious disease immunotherapies based on the Company’s proprietary Versamune® and Infectimune™ T-cell activating technology platforms. Our Versamune®-based products have demonstrated the potential to overcome the limitations of current immunotherapy by inducing in vivo, large quantities of high-quality, highly potent polyfunctional tumor specific CD4+ helper and CD8+ killer T-cells. PDS Biotech has developed multiple therapies, based on combinations of Versamune® and disease-specific antigens, designed to train the immune system to better recognize diseased cells and effectively attack and destroy them. The Company’s pipeline products address various cancers including HPV16-associated cancers (anal, cervical, head and neck, penile, vaginal, vulvar) and breast, colon, lung, prostate and ovarian cancers.
Our Infectimune™ -based vaccines have demonstrated the potential to induce not only robust and durable neutralizing antibody responses, but also powerful T-cell responses including long-lasting memory T-cell responses. To learn more, please visit www.pdsbiotech.com or follow us on Twitter at @PDSBiotech.
Forward Looking Statements
This communication contains forward-looking statements (including within the meaning of Section 21E of the United States Securities Exchange Act of 1934, as amended, and Section 27A of the United States Securities Act of 1933, as amended) concerning PDS Biotechnology Corporation (the “Company”) and other matters. These statements may discuss goals, intentions and expectations as to future plans, trends, events, results of operations or financial condition, or otherwise, based on current beliefs of the Company’s management, as well as assumptions made by, and information currently available to, management. Forward-looking statements generally include statements that are predictive in nature and depend upon or refer to future events or conditions, and include words such as “may,” “will,” “should,” “would,” “expect,” “anticipate,” “plan,” “likely,” “believe,” “estimate,” “project,” “intend,” “forecast,” “guidance”, “outlook” and other similar expressions among others. Forward-looking statements are based on current beliefs and assumptions that are subject to risks and uncertainties and are not guarantees of future performance. Actual results could differ materially from those contained in any forward-looking statement as a result of various factors, including, without limitation: the Company’s ability to protect its intellectual property rights; the Company’s anticipated capital requirements, including the Company’s anticipated cash runway and the Company’s current expectations regarding its plans for future equity financings; the Company’s dependence on additional financing to fund its operations and complete the development and commercialization of its product candidates, and the risks that raising such additional capital may restrict the Company’s operations or require the Company to relinquish rights to the Company’s technologies or product candidates; the Company’s limited operating history in the Company’s current line of business, which makes it difficult to evaluate the Company’s prospects, the Company’s business plan or the likelihood of the Company’s successful implementation of such business plan; the timing for the Company or its partners to initiate the planned clinical trials for PDS0101, PDS0203 and other Versamune® and Infectimune™-based product candidates; the future success of such trials; the successful implementation of the Company’s research and development programs and collaborations, including any collaboration studies concerning PDS0101, PDS0203 and other Versamune® and Infectimune™-based product candidates and the Company’s interpretation of the results and findings of such programs and collaborations and whether such results are sufficient to support the future success of the Company’s product candidates; the success, timing and cost of the Company’s ongoing clinical trials and anticipated clinical trials for the Company’s current product candidates, including statements regarding the timing of initiation, pace of enrollment and completion of the trials (including the Company’s ability to fully fund its disclosed clinical trials, which assumes no material changes to our currently projected expenses), futility analyses, presentations at conferences and data reported in an abstract, and receipt of interim results (including, without limitation, any preclinical results or data), which are not necessarily indicative of the final results of the Company’s ongoing clinical trials; any Company statements about its understanding of product candidates mechanisms of action and interpretation of preclinical and early clinical results from its clinical development programs and any collaboration studies; and other factors, including legislative, regulatory, political and economic developments not within the Company’s control, including unforeseen circumstances or other disruptions to normal business operations arising from or related to COVID-19. The foregoing review of important factors that could cause actual events to differ from expectations should not be construed as exhaustive and should be read in conjunction with statements that are included herein and elsewhere, including the risk factors included in the Company’s annual and periodic reports filed with the SEC. The forward-looking statements are made only as of the date of this press release and, except as required by applicable law, the Company undertakes no obligation to revise or update any forward-looking statement, or to make any other forward-looking statements, whether as a result of new information, future events or otherwise.
Versamune® is a registered trademark and Infectimune™ is a trademark of PDS Biotechnology.
Investor Contact:
Rich Cockrell
CG Capital
Phone: +1 (404) 736-3838
Email: pdsb@cg.capital
Release – Eagle Bulk Shipping Inc. to Issue First Quarter 2022 Results and Hold Investor Conference Call
![]()
Eagle Bulk Shipping Inc. to Issue First Quarter 2022 Results and Hold Investor Conference Call
Research, News, and Market Data on Eagle Bulk Shipping
To participate in the teleconference, investors and analysts are invited to call +1 844-282-4411 in the
A replay will be available following the call from 11:00 AM ET on May 6, 2022 until 11:00 AM ET on May 16, 2022. To access the replay, call +1 855-859-2056 in the
About Eagle Bulk Shipping Inc.
Company Contact
investor@eagleships.com
+1 203-276-8100
Media Contact
+1 212-359-2228
Source:
Morningstar Analyst Peeks Behind AARK Curtain and Calls Fund Wretched
Morningstar Analyst Cites Many Reasons to Downgrade Cathie Wood’s Flagship Fund
When it rains, it pours on ARK Invest. Morningstar has dropped Cathie Wood’s flagship Fund, the ARK Innovation ETF (AARK), to the lowest level on its analyst scale. The influential research firm’s analyst has a long list of reasons to be so hard on the “disruptive” tech fund. He also directs advice specifically at Cathie Wood as manager of the firm she founded.
|
| Source: Morningstar |
Morningstar Actions
In a research note released earlier this week, fund analyst Robby Greengold, CFA, downgraded ARKK to Negative from Neutral. He simultaneously dropped the fund’s People and Parent ratings to Below Average from Average. He explains in a laundry list of issues the reasons for the downgrades. Many of them describe a seat-of-the-pants, lack of benchmarking strategy, that he says is employed by the chief investment officer, Cathie Wood.
Fund Downgrade
In his write-up titled Why We’ve Downgraded ARK
Innovation, Greenwold is critical right from his first sentence, he writes, “ARK Innovation ETF (ARKK) shows few signs of improving its risk management or ability to successfully navigate the challenging territory it explores.”
He goes on to find risk in the funds diversification, AARK holds only 35 stocks (down from 60 last year). The holdings are all companies of Wood’s highest conviction ideas. Part of the issue here is that many of these companies have highly correlated stock prices, and several of them are unprofitable.
Other criticisms explained with the fund downgrade include:
“Manager Cathie Wood has since doubled down on her perilous approach in hopes of a repeat of 2020, when highly volatile growth stocks were in favor.”
“Since its meteoric rise in 2020, the strategy’s exchange-traded fund has been one of the worst-performing U.S.-sold funds, as the aggressive-growth stocks it held fell back to earth.”
“She has saddled the portfolio with greater risk by slashing its number of stocks to 35 from 60 less than a year ago–thereby amplifying stock-specific risk.”
“Rather than gauge the portfolio’s aggregate risk exposures and simulate their effects during a variety of market conditions, the firm uses its past as a guide to the future…”
People and Parent Downgrade
As part of the ratings downgrade for People and Parent of the ETF, Robby Greenwold discusses the lack of depth and succession planning:
“ARK has in place a poor succession plan for the 66-year-old Wood, who is essential as the firm’s majority owner and lone portfolio manager. Director of research Brett Winton would succeed her if needed, but his 15 years of industry experience include none as a manager. Exacerbating that key-person risk is the firm’s inability to develop and retain talent: Many of its analysts have come and gone, and most of the nine remaining lack deep industry experience.”
Philosophical Differences
The Morningstar analyst seems to be at disagreement with the philosophy that investors in funds choose the sector or sub-sector and leave the investing in the hands of a fund manager they deem capable. And, if the manager is not fully invested, they are interfering with the investor’s allocation strategy. Under this philosophy, any diversification away from a sector is for the investor. Instead, Greenwold says, “Wood has suggested that risk management lies not with her but with those who invest in ARK’s funds.” He believes that a fund manager should be the one calling the market, and not just looking for long-term winners within the confines of the prospectus. Greenwold writes, “ARK could do more to avert severe drawdowns of wealth, and its carelessness on the topic has hurt many investors of late. It could hurt more in the future.”
Managing Editor, Channelchek
Suggested Reading
 SPACs, Equity Research, and Bowling
|
 SPAC Supply Provides Rare Opportunity
|
 The Appeal of EVs with Bidirectional Charging
|
 Are Small-cap Stocks Smart Investments?
|
Sources
https://www.morningstar.com/articles/1086987/why-weve-downgraded-ark-innovation
Stay up to date. Follow us:
|
|