Release – Direct Digital Holdings to Report First Quarter 2022 Financial Results


Direct Digital Holdings to Report First Quarter 2022 Financial Results

Research, News, and Market Data on Direct Digital Holdings

HOUSTON, May 11, 2022 /PRNewswire/ — Direct Digital Holdings (Nasdaq: DRCT) (“Direct Digital”), a leading advertising and marketing technology holding group, will report financial results for the first quarter ended March 31, 2022, on Thursday, May 12, 2022 after the U.S. stock market closes. Management will host a conference call and webcast on the same day at 5:00 p.m. ET to discuss the results.

The live webcast and replay can be accessed at https://ir.directdigitalholdings.com/

About Direct Digital
Holdings
Direct Digital Holdings (Nasdaq: DRCT) brings state-of-the-art supply- and demand-side advertising platforms together under one umbrella company. The holding group’s supply-side platform Colossus SSP offers advertisers of all sizes extensive reach within general market and multicultural media properties. Its operating companies Huddled Masses and Orange142 deliver significant ROI for middle market advertisers by providing data-optimized programmatic solutions at scale for businesses in sectors that range from energy to healthcare and travel to financial services. Direct Digital Holdings’ sell- and buy-side solutions manage 17,500 clients daily, generating over 30 billion impressions per month across display, CTV, in-app, and other media channels.

Cision View original content to download multimedia:https://www.prnewswire.com/news-releases/reminder-direct-digital-holdings-to-report-first-quarter-2022-financial-results-301545448.html

SOURCE Direct Digital Holdings

Released May 11, 2022

Release – Bowlero Corp. Announces Outstanding Results for the Third Quarter of Fiscal Year 2022


Bowlero Corp. Announces Outstanding Results for the Third Quarter of Fiscal Year 2022

Research, News, and Market Data on Bowlero


  • Revenue totaled
    nearly $258 million, growing $145.6 million or 129.8% year over year,
    $52.8 million or 25.8% relative to pre-pandemic performance, and $24.1
    million or 12.2% on a same-store basis vs. pre-pandemic.
     1 Revenue trends
    accelerated through the week ended April 24, 2022 (see chart below).

  • Net Loss for the
    quarter of $18.0 million was driven primarily by $66.6 million of non-cash
    expenses related to the increase in the value of earnouts and warrants, as
    well as $3.4 million of transactional expenses related to the business
    combination. Net Income for the quarter, adjusted for these items was
    $52.0 million vs. a net loss of $23.1 million in the prior year.
     2

  • Adjusted EBITDA
    of $108.4 million increased $81.0 million or 295.7% vs. prior year’s
    quarter, and grew $41.0 million or 60.9% relative to pre-pandemic
    performance.
     2

  • Trailing twelve
    month (“TTM”) Net Loss of $50.3 million was driven primarily by
    expenses related to the successful de-SPAC transaction, which include
    $42.2 million in share based compensation and $32.5 million in transactional
    expenses, as well as $44.1 million of non-cash expenses related to the
    increase in the value of earnouts and warrants. TTM Net Income, adjusted
    for these items was $68.5 million.
     2

  • TTM
    Adjusted EBITDA of $276.3 million exceeded pre-pandemic performance by
    58.9%.
     2

  • Repurchased 109,754 shares of
    Class A common stock and 2,690,272 warrants.

  • Announced the redemption of all
    outstanding publicly traded and privately held warrants, which is planned
    to be completed on May 16, 2022.

RICHMOND, Va., May 11, 2022 (GLOBE NEWSWIRE) — Bowlero Corp. (NYSE: BOWL) (“Bowlero” or the “Company”), the world’s largest owner and operator of bowling centers, today provided financial results for the 2022 fiscal year third quarter, which ended on March 27, 2022. Bowlero announced that it grew revenue in the quarter to nearly $258 million, driven by strong growth in both walk in retail and event revenue. Total revenue grew by 25.8% compared to pre-pandemic performance and by 129.8% on a year-over-year basis. Same-store sales rose by 12.2% relative to pre-pandemic.1  

“We are extremely pleased with our performance in the quarter. As our record quarterly generation of Revenue and Adjusted EBITDA demonstrate, Bowlero has never been stronger than it is today. We are more committed than ever to executing our growth strategy, and we are thrilled to continue to welcome our guests to a delightful experience,” said Tom Shannon, Founder and Chief Executive Officer.

Financial
Summary

  • Significant growth in Revenue during the quarter, totaling nearly $258 million, up 25.8% relative to pre-pandemic performance and 129.8% on a year-over-year basis; 12.2% on a same-store basis vs. pre-pandemic performance.1
  • Net Loss for the quarter of $18.0 million was driven primarily by $66.6 million of non-cash expenses related to the increase in the value of earnouts and warrants, as well as $3.4 million in transactional expenses related to the business combination. Net Income, adjusted for these items was $52.0 million vs. a net loss of $23.1 million in the prior year.2
  • Adjusted EBITDA for the quarter grew to $108.4 million, up 60.9% relative to pre-pandemic performance and 295.7% vs. prior year.2
  • TTM Adjusted EBITDA of $276.3 million exceeded pre-pandemic performance by 58.9%.
    2
  • TTM Net Loss of $50.3 million was driven primarily by expenses related to the successful de-SPAC transaction, which include $42.2 million in share based compensation and $32.5 million in transactional expenses, as well as $44.1 million of non-cash expenses related to the increase in the value of earnouts and warrants. TTM Net Income, adjusted for these items was $68.5 million.
    2
  • Cash generated from Operations during the quarter was $83.6 million.

“We saw an acceleration of growth as the quarter progressed, driven by the waning impact of Omicron and COVID restrictions being eased,” said Brett Parker, President and CFO of Bowlero Corp. “In addition to continued strong growth in walk in retail revenue, we also saw growth in total event revenue for the first quarter since the onset of COVID. While growing revenue, we also expanded Adjusted EBITDA margin from the pre-COVID levels by 918 basis points. As a result, we posted our highest Revenue and Adjusted EBITDA generated in any quarter, as well as any nine month or TTM period in our history.”

Total
Bowling Center Revenue Performance Trend
 3

Chart for Bowlero Corporation Revenue Performance Summary vs. Pre-COVID Performance:
https://www.globenewswire.com/NewsRoom/AttachmentNg/3c14a746-9fd9-430a-ae09-5fc850a77e9b

* The revenue performance for the week ended 10/31/21 was negatively impacted by Halloween falling on the weekend.
* The revenue performance for the week ended 12/26/21 was negatively impacted by Christmas Day falling on the weekend.
* The revenue performance for the week ended 2/13/22 was negatively impacted by the shift in Super Bowl Sunday.      

____________
1
 Same-store sales are measured by comparing revenues for centers open for the entire duration of both the current and comparable measurement periods. The pre-pandemic comparable period for current quarter is the quarter ended March 31, 2019.
2 “GAAP” stands for Generally Accepted Accounting Principles in the U.S. Please see the sections of this document titled “GAAP Financial Information” and “GAAP to non-GAAP Reconciliations” for more information on the Company’s GAAP and non-GAAP measures. Certain figures in the tables throughout this document may not foot due to rounding.
3 Total Bowling Center Revenue excludes closed bowling center activity and media revenue, which is also a component of our bowling operations. For weeks between 9/5/21 and 12/26/21 and between 3/6/22 and 4/17/22, the percentages above are calculated by comparing each week to the comparable week in 2019. For weeks between 1/2/22 and 2/27/22, the percentages above are calculated by comparing each week to the comparable week in 2020. Data for all weeks following the close of the quarter ended on 3/27/22 are preliminary.

Investor
Webcast Information

Listeners may access an investor webcast hosted by Bowlero. The webcast and results presentation will be accessible at 5:30 PM ET on May 11, 2022 in the Events & Presentations section of the Bowlero Investor Relations website at 
https://ir.bowlerocorp.com/overview/default.aspx.

About
Bowlero Corp.

Bowlero Corp. is the worldwide leader in bowling entertainment. With more than 300 bowling centers across North America, Bowlero Corp. serves more than 26 million guests each year through a family of brands that includes Bowlero, Bowlmor Lanes, and AMF. Bowlero Corp. is also home to the Professional Bowlers Association, which it acquired in 2019 and which boasts thousands of members and millions of fans across the globe. For more information on Bowlero Corp., please visit BowleroCorp.com.

Forward
Looking Statements

Some of the statements contained in this press release are forward-looking statements within the meaning of Section 27A of the Securities Act of 1933, as amended, and Section 21E of the Securities Exchange Act of 1934, as amended. These forward-looking statements are generally identified by the use of words such as “anticipate,” “believe,” “could,” “estimate,” “expect,” “intend,” “may,” “plan,” “potential,” “predict,” “project,” “should,” “target,” “will,” “would” and, in each case, their negative or other various or comparable terminology and include preliminary results. These forward-looking statements reflect our views with respect to future events as of the date of this release and are based on our management’s current expectations, estimates, forecasts, projections, assumptions, beliefs and information. Although management believes that the expectations reflected in these forward-looking statements are reasonable, it can give no assurance that these expectations will prove to have been correct. All such forward-looking statements are subject to risks and uncertainties, many of which are outside of our control, and could cause future events or results to be materially different from those stated or implied in this document. It is not possible to predict or identify all such risks. These risks include, but are not limited to: the impact of COVID-19 or other adverse public health developments on our business; our ability to grow and manage growth profitably, maintain relationships with customers, compete within our industry and retain our key employees; changes in consumer preferences and buying patterns; the possibility that we may be adversely affected by other economic, business, and/or competitive factors; the risk that the market for our entertainment offerings may not develop on the timeframe or in the manner that we currently anticipate; general economic conditions and uncertainties affecting markets in which we operate and economic volatility that could adversely impact our business, including the COVID-19 pandemic and other factors described under the section titled “Risk Factors” in the registration statement on Form S-1 filed with the U.S. Securities and Exchange Commission (the “SEC”) by the Company, as well as other filings that the Company will make, or has made, with the SEC, such as Annual Reports on Form 10-K, Quarterly Reports on Form 10-Q and Current Reports on Form 8-K. These factors should not be construed as exhaustive and should be read in conjunction with the other cautionary statements that are included in this press release and in other filings. We expressly disclaim any obligation to publicly update or review any forward-looking statements, whether as a result of new information, future developments or otherwise, except as required by applicable law.

Read the full release for financials

Information Services Group (III) – An Exceeding First Quarter

Tuesday, May 10, 2022

Information Services Group (III)
An Exceeding First Quarter

ISG (Information Services Group) (Nasdaq: III) is a leading global technology research and advisory firm. A trusted business partner to more than 700 clients, including more than 75 of the world’s top 100 enterprises, ISG is committed to helping corporations, public sector organizations, and service and technology providers achieve operational excellence and faster growth. The firm specializes in digital transformation services, including automation, cloud and data analytics; sourcing advisory; managed governance and risk services; network carrier services; strategy and operations design; change management; market intelligence and technology research and analysis. Founded in 2006, and based in Stamford, Conn., ISG employs more than 1,300 digital-ready professionals operating in more than 20 countries—a global team known for its innovative thinking, market influence, deep industry and technology expertise, and world-class research and analytical capabilities based on the industry’s most comprehensive marketplace data. For additional information, visit www.ISG-One.com

Joe Gomes, Senior Research Analyst, Noble Capital Markets, Inc.

Joshua Zoepfel, Research Associate, Noble Capital Markets, Inc.

Refer to the full report for the price target, fundamental analysis, and rating.

Going Past Expectations. ISG announced record revenue of $72.6 million, continuing the trend of record revenue, an increase of 12% in constant currency and exceeding our estimate of $70 million. The quarter had record net income of $4.9 million, or $0.10 fully diluted EPS, versus $3.4 million and $0.07 the previous year. Adjusted EBITDA also was a record at $10.6 million, a 23% increase year-over-year. We forecasted net income of $4.65 million, $0.09 fully diluted EPS, and adjusted EBITDA of $9 million.

Still Having Momentum. The Company is continuing to see a favorable environment with companies investing in technology to power through market headwinds. ISG experienced double digit growth in recurring revenues, especially on its subscription research and platform businesses, and management sees market momentum continuing in 2022. This momentum is continued with the expansion of the Company’s ISG GovernX platform with the Agreemint acquisition, which we believe will be additive to the segment top-line growth….

This Company Sponsored Research is provided by Noble Capital Markets, Inc., a FINRA and S.E.C. registered broker-dealer (B/D).

*Analyst certification and important disclosures included in the full report. NOTE: investment decisions should not be based upon the content of this research summary. Proper due diligence is required before making any investment decision. 

Kandi Technologies Group, Inc. (KNDI) – First quarter results reflect shift in business line

Tuesday, May 10, 2022

Kandi Technologies Group, Inc. (KNDI)
First quarter results reflect shift in business line

Kandi Technologies Group, Inc. (KNDI), headquartered in Jinhua Economic Development Zone, Zhejiang Province, is engaged in the research, development, manufacturing, and sales of various vehicular products. Kandi conducts its primary business operations through its wholly-owned subsidiary, Zhejiang Kandi Technologies Group Co., Ltd. (“Zhejiang Kandi Technologies”), formerly, Zhejiang Kandi Vehicles Co., Ltd.) and its subsidiaries including Zhejiang Kandi Smart Battery Swap Technology Co., Ltd, and SC Autosports, LLC (d/b/a Kandi America), the wholly-owned subsidiary of Kandi in the United States, and its wholly-owned subsidiary, Kandi America Investment, LLC. Zhejiang Kandi Technologies has established itself as one of China’s leading manufacturers of pure electric vehicle parts and off-road vehicles.

Michael Heim, CFA, Senior Research Analyst, Noble Capital Markets, Inc.

Refer to the full report for the price target, fundamental analysis, and rating.

Off-road vehicle sales rose 90% year over year. Off-road electric vehicles sales, primarily golf carts, were $10.7 million surpassing our expectations for sales of $8 million. The segment has been hot every since the beginning of COVID and continues to grow in importance to the company. The company formed a new company to produce electric golf carts. The company recently signed a memorandum of understanding to sell $29 million (5,000 units), virtually doubling the division’s sales. We expect strong growth from the division.

Battery sales have been strong and now represent the second largest operating division. Battery sales were $8.0 million up from a negligible amount last year. The company acquired Jiangxi Huiyi New Energy Co. in October 2021. The division has synergistic benefits with Kandi’s other operating divisions and appears to be a profitable business on its own….

This Company Sponsored Research is provided by Noble Capital Markets, Inc., a FINRA and S.E.C. registered broker-dealer (B/D).

*Analyst certification and important disclosures included in the full report. NOTE: investment decisions should not be based upon the content of this research summary. Proper due diligence is required before making any investment decision. 

RCI Hospitality Holdings (RICK) – Momentum Continues to Build

Tuesday, May 10, 2022

RCI Hospitality Holdings (RICK)
Momentum Continues to Build

With more than 50 units, RCI Hospitality Holdings, Inc., through its subsidiaries, is the country’s leading company in gentlemen’s clubs and sports bars/restaurants. Clubs in New York City, Chicago, Dallas-Fort Worth, Houston, Miami, Minneapolis, Denver, St. Louis, Charlotte, Pittsburgh, Raleigh, Louisville, and other markets operate under brand names such as Rick’s Cabaret, XTC, Club Onyx, Vivid Cabaret, Jaguars Club, Tootsie’s Cabaret, and Scarlett’s Cabaret. Sports bars/restaurants operate under the brand name Bombshells Restaurant & Bar.

Joe Gomes, Senior Research Analyst, Noble Capital Markets, Inc.

Joshua Zoepfel, Research Associate, Noble Capital Markets, Inc.

Refer to the full report for the price target, fundamental analysis, and rating.

2Q22 Results. Revenue hit a record $63.7 million, up 3.0% sequentially and up 44.6% y-o-y. Omicron cut quarterly revenue by an estimated $2 million. We had projected $65.3 million of revenue. Net income was $11.0 million, or $1.15 per share, compared to $6.1 million, or $0.68 per share last year. We were at $11.6 million, or $1.22 per share.

Club Acquisitions and Growth. RCI just acquired another South Florida club for $16 million, or 4.1x club EBITDA and is under contract to purchase a club in Ft. Worth, TX. In addition, the rebranded Louisiana club was opened in March and the reformatted San Antonio club will open in the third quarter.  …

This Company Sponsored Research is provided by Noble Capital Markets, Inc., a FINRA and S.E.C. registered broker-dealer (B/D).

*Analyst certification and important disclosures included in the full report. NOTE: investment decisions should not be based upon the content of this research summary. Proper due diligence is required before making any investment decision. 

Tonix Pharmaceuticals (TNXP) – 1Q22 Reported With Clinical Milestones Review

Tuesday, May 10, 2022

Tonix Pharmaceuticals (TNXP)
1Q22 Reported With Clinical Milestones Review

Tonix is a clinical-stage biopharmaceutical company focused on discovering, licensing, acquiring and developing therapeutics and diagnostics to treat and prevent human disease and alleviate suffering. Tonix’s portfolio is composed of immunology, rare disease, infectious disease, and central nervous system (CNS) product candidates. Tonix’s immunology portfolio includes biologics to address organ transplant rejection, autoimmunity and cancer, including TNX-15001 which is a humanized monoclonal antibody targeting CD40-ligand being developed for the prevention of allograft and xenograft rejection and for the treatment of autoimmune diseases. A Phase 1 study of TNX-1500 is expected to be initiated in the second half of 2022. Tonix’s rare disease portfolio includes TNX-29002 for the treatment of Prader-Willi syndrome. TNX-2900 has been granted Orphan-Drug Designation by the FDA. Tonix’s infectious disease pipeline includes a vaccine in development to prevent smallpox and monkeypox called TNX-8013, next-generation vaccines to prevent COVID-19, and an antiviral to treat COVID-19. Tonix’s lead vaccine candidates for COVID-19 are TNX-1840 and TNX-18504, which are live virus vaccines based on Tonix’s recombinant pox vaccine (RPV) platform. TNX-35005 (sangivamycin, i.v. solution) is a small molecule antiviral drug to treat acute COVID-19 and is in the pre-IND stage of development. TNX-102 SL6, (cyclobenzaprine HCl sublingual tablets), is a small molecule drug being developed to treat Long COVID, a chronic post-acute COVID-19 condition. Tonix expects to initiate a Phase 2 study in Long COVID in the second quarter of 2022. The Company’s CNS portfolio includes both small molecules and biologics to treat pain, neurologic, psychiatric and addiction conditions. Tonix’s lead CNS candidate, TNX-102 SL, is in mid-Phase 3 development for the management of fibromyalgia with a new Phase 3 study launched in the second quarter of 2022. Finally, TNX-13007 is a biologic designed to treat cocaine intoxication that is expected to start a Phase 2 trial in the second quarter of 2022. TNX-1300 has been granted Breakthrough Therapy Designation by the FDA.

Robert LeBoyer, Vice President, Research Analyst, Life Sciences , Noble Capital Markets, Inc.

Refer to the full report for the price target, fundamental analysis, and rating.

Tonix Reported 1Q22.  Tonix reported a loss of $26.4 million or $(0.05) per share for 1Q22 and gave several development updates.  The Phase 2 trial testing TNX-102 SL in Long COVID is expected to begin in 2Q22, and the Phase 3 RESILIENT study in fibromyalgia has begun enrollment.  The company also reiterated plans to start three new Phase 2 trials from its CNS platform by YE2022. The cash balance at the end of the quarter was $140.4 million.

The Product Pipeline Continues To Make Progress.  Tonix has begun patient enrollment in the Phase 3 RESILIENT study testing TNX-102 SL in fibromyalgia.  This study has a target enrollment of 470 patients with an interim analysis expected in 1Q23.  If successful, the study would provide data for an application for FDA approval.  Separately, the IND to begin a Phase 2 study testing TNX-102 SL in Long COVID became effective, with enrollment expected to begin during 2Q22.

This Company Sponsored Research is provided by Noble Capital Markets, Inc., a FINRA and S.E.C. registered broker-dealer (B/D).

*Analyst certification and important disclosures included in the full report. NOTE: investment decisions should not be based upon the content of this research summary. Proper due diligence is required before making any investment decision. 

Gevo (GEVO) – First quarter results meet expectations, but real story is plant progression

Tuesday, May 10, 2022

Gevo (GEVO)
First quarter results meet expectations, but real story is plant progression

Gevo’s mission is to transform renewable energy and carbon into energy-dense liquid hydrocarbons. These liquid hydrocarbons can be used for drop-in transportation fuels such as gasoline, jet fuel, and diesel fuel, that when burned have potential to yield net-zero greenhouse gas emissions when measured across the full lifecycle of the products. Gevo uses low-carbon renewable resource-based carbohydrates as raw materials, and is in an advanced state of developing renewable electricity and renewable natural gas for use in production processes, resulting in low-carbon fuels with substantially reduced carbon intensity (the level of greenhouse gas emissions compared to standard petroleum fossil-based fuels across their lifecycle). Gevo’s products perform as well or better than traditional fossil-based fuels in infrastructure and engines, but with substantially reduced greenhouse gas emissions. In addition to addressing the problems of fuels, Gevo’s technology also enables certain plastics, such as polyester, to be made with more sustainable ingredients. Gevo’s ability to penetrate the growing low-carbon fuels market depends on the price of oil and the value of abating carbon emissions that would otherwise increase greenhouse gas emissions. Gevo believes that its proven, patented, technology enabling the use of a variety of low-carbon sustainable feedstocks to produce price-competitive low carbon products such as gasoline components, jet fuel, and diesel fuel yields the potential to generate project and corporate returns that justify the build-out of a multi-billion-dollar business.

Michael Heim, CFA, Senior Research Analyst, Noble Capital Markets, Inc.

Refer to the full report for the price target, fundamental analysis, and rating.

Gevo reported revenues of $0.2m versus $0.1m, operating income of ($16.0m) versus ($9.9m) and net income of ($15.7m) versus ($10.1m). Results were in line with our expectations. The company’s cash position is solid at $413 million, and the company is already planning out its financing for plant development. Plans call for the combined use of nonrecourse project financing, corporate debt and shareholder investments.

Projects are moving forward. In January, Gevo announced it had begun the process of bringing its dairy manure-based project online in order to apply for credits. The credits could contribute $16-$20 million annually, and management is prepared for timing issues between production and receipt of credits. In March, it signed several “take-or-pay” agreements with airlines to provide jet fuel made from ethanol at its Net Zero One plant. In total, Gevo has contracts for 200m gallons of fuel annually and has stated a goal of delivering 1 billion gallons of fuel by 2030. Plant operations are on track, although management indicated it has used up some of the slack assumed in its timeline. …

This Company Sponsored Research is provided by Noble Capital Markets, Inc., a FINRA and S.E.C. registered broker-dealer (B/D).

*Analyst certification and important disclosures included in the full report. NOTE: investment decisions should not be based upon the content of this research summary. Proper due diligence is required before making any investment decision. 

Release – Comtech Appoints Ken Peterman to Board of Directors


Comtech Appoints Ken Peterman to Board of Directors

Research, News, and Market Data on Comtech Telecommunications

Defense Industry Veteran Peterman Adds Deep Satellite and US
Government Experience

MELVILLE, N.Y.–(BUSINESS WIRE)–May 10, 2022– May 10, 2022–Comtech Telecommunications Corp. (NASDAQ: CMTL), a leading global provider of next-generation 911 emergency systems and secure wireless communications technologies, announced today that it had appointed seasoned satellite executive Ken Peterman to Comtech’s Board of Directors. Ken will join the Board’s Science and Technology Committee.

“This is a significant and pivotal time for Comtech, as we strive to be the global leader in Failsafe Communications. Ken’s expertise in satellite technology and decades of experience with U.S. government contracting speaks for itself, providing an impeccable foundation from a strategic, executive leadership and governance perspective. He is a remarkable individual with a unique skillset, and I am delighted to welcome him to our Board,” said Michael Porcelain, President and CEO of Comtech.

An award-winning global executive leader, Peterman’s accomplished career spans over forty years in the defense segment, accumulating credentials across a wide array of markets and both commercial and government satellite systems. He has augmented a strategic landscape in tactical and satellite communications, cybersecurity, and C4 defense technology sectors through tenures at the President/CEO and VP/GM level of top defense companies including Viasat, ITT/Exelis, Collins Aerospace, Raytheon and SpyGlass Group. Most recently, as President at Viasat Government Systems, Peterman led a world-class satellite communications, mobile networking and cybersecurity portfolio. At Raytheon, he developed a $1B/year Tactical Defense Electronics Systems Division with market-leading performance. While at ITT/Exelis, he led major restructuring actions across twelve states plus the U.K. (with sales of ~$1.3B/yr), improving resource utilization and reducing infrastructure to align with emerging market and budget realities while creating double-digit growth.

“This is a key time for Comtech, and I am deeply focused on helping the Company grow and compete in the global marketplace. I am thrilled to join the Board and help steer Comtech into a new era of commercial success and shareholder value,” commented Ken Peterman.

About Comtech
Comtech Telecommunications Corp. is a leading global provider of next-generation 911 emergency systems and secure wireless communications technologies to commercial and government customers around the world. Headquartered in Melville, New York and with a passion for customer success, Comtech designs, produces and markets advanced and secure wireless solutions. For more information, please visit www.comtechtel.com (and preview its new website at www.comtech.com).

Forward-Looking
Statements

Certain information in this press release contains statements that are forward-looking in nature and involve certain significant risks and uncertainties. Actual results could differ materially from such forward-looking information. The Company’s Securities and Exchange Commission filings identify many such risks and uncertainties. Any forward-looking information in this press release is qualified in its entirety by the risks and uncertainties described in such Securities and Exchange Commission filings.

PCMTL

View source version on businesswire.comhttps://www.businesswire.com/news/home/20220509006118/en/

Comtech
Investor Relations
Robert Samuels
robert.samuels@comtech.com
(631) 962-7102

Source: Comtech Telecommunications Corp.

Asset Classes that Perform Best and Worst with Negative Real Interest Rates


Image Credit: Kim Alaniz (Flickr)


With Negative Real Rates, What Sectors Have Historically Outperformed?

The “real interest rate,” is defined as the net amount earned less inflation on an interest bearing security. Real rates are now at a low the country hasn’t experienced since just after World War II. In fact, with the recent Consumer Price Index (CPI) spike to 8.5% from a year earlier, inflation is 6% to 7% higher than one year US treasury levels. This means the real return is a negative 6% to 7%.

When the more conservative investor using interest-bearing securities begins to see inflation outpacing their investments, as they are now (in most cases), they recognize their assets are losing buying power. Their investments are not paying enough to keep up with price rises and certainly not growing so they can be able to buy more later with their savings. These simpler investors, by holding on to treasury securities, CDs, or corporate bonds, are losing ground, this loss of usable wealth begins to cause investors to move down the risk curve.

Putting on Risk

Dr. Horstmeyer is a professor of finance at George Mason University’s Business School in Fairfax, Va. He and his team decided to collect hard data on this phenomenon and see how different asset classes perform when real interest rates turn negative and stay negative for a while.

What they found with their look back is that when real interest rates turn negative, the asset classes considered riskiest (emerging-markets stocks, small-caps, etc.) had done extremely well in the first half of the inflation/interest rate cycle. During this period, they outperform what’s considered safer assets by over 1.5 percentage points a month. Stretched out over several months with compounding, the investors have done well.

The performance benefit reverses to a degree for those invested in these assets into the second half of the cycle. On average, the riskier assets have underperformed by over a percentage point (monthly) in the second half of a negative-real-rate cycle. This does not suggest the investors fared worse by adding risk to their portfolio; it may indicate that many investors were prudent and did not let greed keep them in the riskier securities. The later investors exiting lost ground from earlier gains.

The Research

To investigate what happened in the past, Professor Horstmeyer and his research assistants Jaehee Lee and Natalia Palacios gathered interest-rate data (based on T-bills), inflation data, and mutual-fund-return statistics for various asset classes over the past 50 years. They examined periods since 1971 when real interest rates turned negative and stayed negative for more than a month.

The group identified seven periods like this – the average period length is 2.5 years. For each period, they labeled the first half and the second half. The researchers then compared performance; first half compared to second.


What Investors Should Note

They reported two findings that investors should be aware of. First, during the first half of a negative-rate cycle, the riskiest mutual funds performed best. Emerging-markets funds, US small-cap funds and international-stock funds averaged 1.96%, 1.13%, and 1.03% returns a month, respectively. This average monthly return is far superior to all other equities and far better than the average bond fund, which had average returns of 0.35% a month during this period.

Half-Way Point

The additional performance reversed as the cycles matured. In the second halves, the riskiest funds underperformed. For example, emerging-markets funds lost an average of 1.13% a month. So while investors were seeking risk in the first half, it appears they eventually faded away from it the longer as the US remained with a negative real interest-rate environment.

Where are We Now

According to their findings which is based on historical averages, the current negative-rate cycle began in the second quarter of 2020. This could mean, if the 50 year pattern holds true, many investors have shifted over to riskier assets already. Since we are still sitting with negative real rates in the cycle, approaching the third year, it’s impossible to know yet where the first half ends and the second begins. Thus, even if we haven’t fully hit the point where investors move out of riskier positions, judging by historical length and data, we’re likely close.

Paul Hoffman

Managing Editor, Channelchek

Suggested Content


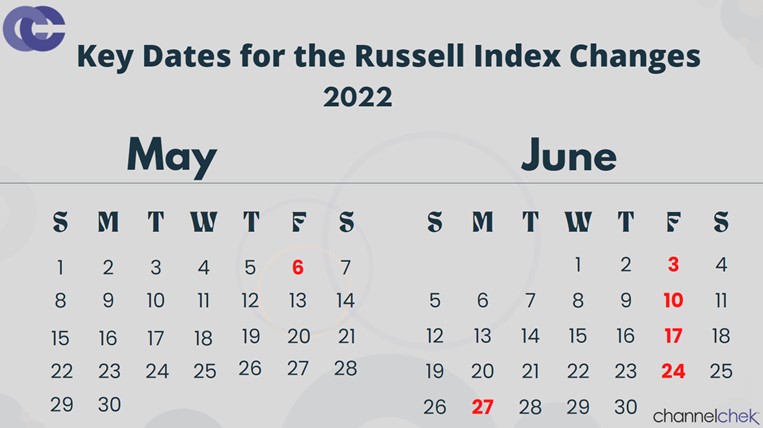
Russell Reconstitution 2022, What Investors Should Know


Is the Index Bubble Michael Burry Warned About Still Looming?


Leveraged and Inverse ETFs Contain Extra Costs for Buy-and-Hold Investors


In Nine Years, Nearly All Boomers Will Have Retired, Is This Good for Stock Pickers?

Sources

https://www.bls.gov/cpi/#:~:text=CPI%20for%20all%20items%20rises,12%20months%2C%20not%20seasonally%20adjusted

https://www.wsj.com/articles/investment-negative-interest-rates-11651781476?mod=hp_jr_pos1


Stay up to date. Follow us:


Release – QuoteMedia Q1 2022 Financial Results and Investors’ Conference Call May 13, 2022


QuoteMedia Q1 2022 Financial Results and Investors’ Conference Call May 13, 2022

Research, News, and Market Data on QuoteMedia

PHOENIX, May 10, 2022 (GLOBE NEWSWIRE) — QuoteMedia, Inc. (OTCQB: QMCI), a leading provider of market data and financial applications, today announced that its earnings for its quarter ended March 31, 2022 will be released the morning of May 13, 2022. That same day, the company will host a conference call at 2:00 PM Eastern time to discuss the financial results and provide a business update.

Conference Call Details:

Date: May 13, 2022

Time: 2:00 PM Eastern

Dial-in numbers: 866-342-8591

Conference ID: QUOTEMEDIA

An audio rebroadcast of the call will be available later at: www.quotemedia.com

About QuoteMedia

QuoteMedia is a leading software developer and cloud-based syndicator of financial market information and streaming financial data solutions to media, corporations, online brokerages, and financial services companies. The Company licenses interactive stock research tools such as streaming real-time quotes, market research, news, charting, option chains, filings, corporate financials, insider reports, market indices, portfolio management systems, and data feeds. QuoteMedia provides industry leading market data solutions and financial services for companies such as the Nasdaq Stock Exchange, TMX Group (TSX Stock Exchange), Canadian Securities Exchange (CSE), London Stock Exchange Group, FIS, U.S. Bank, Broadridge Financial Systems, JPMorgan Chase, CI Financial, Canaccord Genuity Corp., Hilltop Securities, HD Vest, Stockhouse, Zacks Investment Research, General Electric, Boeing, Bombardier, Telus International, Business Wire, PR Newswire, FolioFN, Regal Securities, ChoiceTrade, Cetera Financial Group, Dynamic Trend, Inc., Qtrade Financial, CNW Group, IA Private Wealth, Ally Invest, Inc., Suncor, Virtual Brokers, Leede Jones Gable, Firstrade Securities, Charles Schwab, First Financial, Cirano, Equisolve, Stock-Trak, Mergent, Cision, Day Trade Dash, LLC and others. Quotestream®, QModTM and Quotestream ConnectTM are trademarks of QuoteMedia. For more information, please visit www.quotemedia.com.

QuoteMedia Investor
Relations

Brendan Hopkins
Email: 
investors@quotemedia.com
Call: (407) 645-5295

Coinbase’s Armstrong and ARK Invest’s Wood Talk Crypto


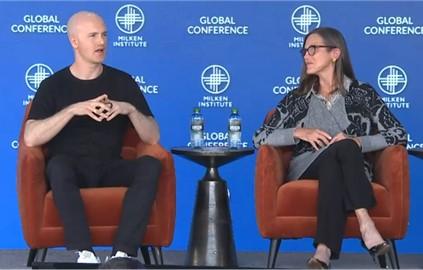
Image: Brian Armstrong, Cathie Wood (Milken Institute)


ARK’s Cathie Wood and Coinbase’s Brian Armstrong Talk About Crypto’s Outlook

ARK Invest’s founder and CEO took part in a panel discussion titled, Conversations with Crypto Pioneers. The discussion was held at the Milken Institute’s 2022 Global Conference and included Brian Armstrong who is the CEO and co-founder of Coinbase (COIN). When it comes to Bitcoin and other cryptos, both CEOs are strong advocates. What Ms. Wood and Mr. Armstrong had to share ought to be of great interest to investors whose wallets have shrunk with the recent weakness in this asset class.

According to Armstrong one billion people around the world will use cryptocurrency technology in one way or another by the end of the 2020s. Crypto has started to enter the mainstream over the past few years. Armstrong said, about 200 million people worldwide have used crypto. Institutional investors are increasingly embracing digital currencies in their portfolios, and some retirement savers may soon see Bitcoin as an option in their 401(k) plans.

Wood believes the rate of crypto adoption in the U.S. is slow because of regulatory uncertainty; she said, “I would’ve expected more clarity,” and added. “Basically we’ve come at this from a negative point of view, and I’ve seen other countries come at it from a positive point of view. If we’re not lucky, regulatory arbitrage is going to take the market away from us.”

“This is a new asset class, and you have to have a point of view,” Wood said.

Armstrong seems at odds with the official point of view of regulators and others in Washington. He’s not overly optimistic, noting a recent executive order from President Biden that calls for protections from the crypto industry’s potential innovations. And last month, the White House outlined a national policy to address the risks and benefits of digital assets and their underlying technology.

Securities and Exchange Commission (SEC) Chairman Gary Gensler has been cautious when it comes to regulating cryptos. He has said that many tokens traded on crypto exchanges are likely securities. As securities, they would require more disclosures from both the tokens as well as the platforms that are not now registered security exchanges. Coinbase is a cryptocurrency exchange.

“I think this is a very bipartisan issue,” said Armstrong, “The majority of people I met with in Congress, 50% or more, are now pro-crypto, they believe that this is a net good for society.” About one in five Americans have now used crypto or tried it in some way, Armstrong said, and the number is growing quickly. “That’s a massive voting group. It’s quickly becoming very politically unpopular to be anti-crypto,” according to Armstrong.

Both CEOs noted the application of blockchain technology in everyday life goes well beyond digital coins.

The Coinbase CEO sees use cases for the technology in social media. He was asked about his view on Elon Musk’s takeover of Twitter, to which he said the company has a huge opportunity to become a leader in decentralized social media, where users’ online identity and content aren’t owned by one particular platform, but by users themselves through a decentralized ledger. It would mean anyone could use all the information on Twitter and display it in various ways. “Essentially, it democratized access to [social-media content], and I think that’s one of the directions Twitter could go,” Armstrong said. “I imagine that there are a number of startups and other companies that will be building competing decentralized social media products if [Twitter doesn’t.]”

Both Armstrong and Wood agree crypto and blockchain technology could spur growth around the world over the next decade. The world will see a substantial portion of GDP coming from the crypto economy in 10 to 20 years, similar to e-commerce, the two agreed. “People think they might have missed the opportunity when they see Bitcoin at $70,000, but we are in fairly early days,” Wood advised.

With recent moves in financial assets, particularly crypto, those that held since last year are hurting. Bitcoin prices are down 20% year to date and 40% below their peak reached in November 2021. ARK Invest’s CEO who’s funds own crypto and crypto-related assets, was an early investor in digital assets and blockchain technology. Coinbase is the fifth-largest holding of the ARK Innovation exchange-traded fund (ARKK), the company’s flagship product.

Paul Hoffman

Managing Editor, Channelchek

Suggested Content


The Sources of Deflationary Pressure According to Cathie Wood


Why Michael Burry has Better Opportunity Than Cathie Wood


Metaverse: Is The Future Real? – Panel Presentation from NobleCon18


Voyager Digital (VYGVF) NobleCon18 Presentation Replay

Sources

https://milkeninstitute.org/video/crypto-pioneers-conversations

https://milkeninstitute.org/events/global-conference-2022/overview

https://www.youtube.com/watch?v=vSo5r4y8Gpo

https://www.barrons.com/articles/bitcoin-crypto-adoption-global-gdp-coinbase-ark-51651619611?mod=grayscale

Stay up to date. Follow us:


Release – Salem Media Group, Inc. Announces First Quarter 2022 Total Revenue of $62.6 Million


Salem Media Group, Inc. Announces First Quarter 2022 Total Revenue of $62.6 Million

Research, News, and Market Data on Salem Media

IRVING, Texas–(BUSINESS WIRE)– Salem Media Group, Inc. (NASDAQ: SALM) released its results for the three months ended March 31, 2022.

First Quarter 2022 Results

For the quarter ended March 31, 2022 compared to the quarter ended March 31, 2021:

Consolidated

  • Total revenue increased 5.5% to $62.6 million from $59.4 million;
  • Total operating expenses increased 4.8% to $57.6 million from $55.0 million;
  • Operating expenses, excluding gains or losses on the disposition of assets, stock-based compensation expense, changes in the estimated fair value of contingent earn-out consideration, impairments, depreciation expense and amortization expense (1) increased 8.4% to $55.8 million from $51.4 million;
  • Operating income increased 14.2% to $5.0 million from $4.4 million;
  • Net income increased 438.4% to $1.7 million, or $0.06 net income per diluted share from $0.3 million, or $0.01 net income diluted per share;
  • EBITDA (1) increased 8.6% to $8.2 million from $7.5 million;
  • Adjusted EBITDA (1) decreased 13.6% to $6.8 million from $7.9 million; and
  • Net cash used by operating activities decreased 53.1% to $4.3 million from $9.2 million.

Broadcast

  • Net broadcast revenue increased 10.0% to $48.4 million from $44.0 million;
  • Station Operating Income (“SOI”) (1) decreased 3.7% to $10.3 million from $10.7 million;
  • Same Station (1) net broadcast revenue increased 9.4% to $48.1 million from $44.0 million; and
  • Same Station SOI (1) decreased 5.0% to $10.3 million from $10.9 million.

Digital Media

  • Digital media revenue increased 7.1% to $10.3 million from $9.6 million; and
  • Digital Media Operating Income (1) increased 93.1% to $1.8 million from $0.9 million.

Publishing

  • Publishing revenue decreased 31.8% to $3.9 million from $5.7 million; and
  • Publishing Operating Loss (1) was $0.6 million compared to Publishing Operating Income (1) of $0.5 million.

Included in the results for the quarter ended March 31, 2022 are:

  • A $1.7 million ($1.3 million, net of tax, or $0.05 per diluted share) net gain on the disposition of assets relates primarily to the gain on sale of land in Phoenix, Arizona offset by various fixed asset disposals; and
  • A $0.2 million ($0.2 million, net of tax, or $0.01 per share) charge for debt modification costs; and
  • A $0.1 million non-cash compensation charge ($0.1 million, net of tax) related to the expensing of stock options.

Included in the results for the quarter ended March 31, 2021 are:

  • A $0.3 million ($0.2 million, net of tax, or $0.01 per share) net loss on the disposition of assets recorded upon the closing of the sale of radio station WKAT-AM and an FM translator in Miami, Florida; and
  • A $0.1 million non-cash compensation charge ($0.1 million, net of tax) related to the expensing of stock options.

Per share numbers are calculated based on 27,610,407 diluted weighted average shares for the quarter ended March 31, 2022, and 27,138,773 diluted weighted average shares for the quarter ended March 31, 2021.

Balance Sheet

As of March 31, 2022, the company had $114.7 million outstanding on the 7.125% senior secured notes due 2028 (“2028 Notes”), $57.7 million outstanding on 6.75% senior secured notes due 2024 (“2024 Notes”), and no outstanding balance on the ABL Facility.

Acquisitions and Divestitures

The following transactions were completed since January 1, 2022:

  • On May 2, 2022, the company acquired websites and related assets of Retirement Media for $0.2 million in cash.
  • The company invested $3.5 million, for a total investment to date of $4.5 million, in a Limited Liability Company “LLC” that will own, distribute, and market a motion picture.
  • On February 15, 2022, the company closed on the acquisition of radio station WLCC-AM and an FM translator in the Tampa, Florida market for $0.6 million of cash.
  • On January 10, 2022, the company closed on the sale of 4.5 acres of land in Phoenix, Arizona for $2.0 million in cash.

Pending transactions:

  • On August 31, 2021, the company entered into an agreement to sell 9.3 acres of land in the Denver area for $8.2 million. The company expects to close this sale in the second quarter of 2022 and plans to continue broadcasting both KRKS-AM and KBJD-AM from this site.
  • On June 2, 2021, the company entered into an agreement to acquire radio station KKOL-AM in Seattle, Washington for $0.5 million. The company paid $0.1 million in cash into an escrow account and began operating the station under a Local Marketing Agreement on June 7, 2021. The company expects the transaction to close in the latter half of 2022.
  • On February 5, 2020, the company entered into an Asset Purchase Agreement with Word Broadcasting to sell radio stations WFIA-AM, WFIA-FM and WGTK-AM in Louisville, Kentucky for $4.0 million with credits applied from amounts previously paid, including a portion of the monthly fees paid under a Time Brokerage Agreement (“TBA”). Due to changes in debt markets, the transaction was not funded, and it is uncertain when, or if, the transaction will close. Word Broadcasting continues to program the stations under a TBA that began in January 2017.

Conference Call Information

Salem will host a teleconference to discuss its results on May 10, 2022 at 3:00 p.m. Central Time. To access the teleconference, please dial (877) 524-8416, and then ask to be joined into the Salem Media Group First Quarter 2022 call or listen via the investor relations portion of the company’s website, located at investor.salemmedia.com. A replay of the teleconference will be available through May 24, 2022 and can be heard by dialing (877) 660-6853, passcode 13727921 or on the investor relations portion of the company’s website, located at investor.salemmedia.com.

Follow us on Twitter @SalemMediaGrp.

Second Quarter 2022 Outlook

For the second quarter of 2022, the company is projecting total revenue to increase between 6% and 8% from second quarter 2021 total revenue of $63.8 million. The company is also projecting operating expenses before gains or losses on the sale or disposal of assets, stock-based compensation expense, changes in the estimated fair value of contingent earn-out consideration, impairments, depreciation expense and amortization expense to increase between 7% and 10% compared to the second quarter of 2021 non-GAAP operating expenses of $55.0 million.

A reconciliation of non-GAAP operating expenses, excluding gains
or losses on the disposition of assets, stock-based compensation expense,
changes in the estimated fair value of contingent earn-out consideration,
impairments, depreciation expense and amortization expense to the most directly
comparable GAAP measure is not available without unreasonable efforts on a
forward-looking basis due to the potential high variability, complexity and low
visibility with respect to the charges excluded from this non-GAAP financial
measure, in particular, the change in the estimated fair value of earn-out
consideration, impairments and gains or losses from the disposition of fixed
assets. The company expects the variability of the above charges may have a
significant, and potentially unpredictable, impact on its future GAAP financial
results.

About Salem Media Group, Inc.

Salem Media Group is America’s leading multimedia company specializing in Christian and conservative content, with media properties comprising radio, digital media and book and newsletter publishing. Each day Salem serves a loyal and dedicated audience of listeners and readers numbering in the millions nationally. With its unique programming focus, Salem provides compelling content, fresh commentary and relevant information from some of the most respected figures across the Christian and conservative media landscape. Learn more about Salem Media Group, Inc. at www.salemmedia.comFacebook and Twitter.

Forward-Looking Statements

Statements used in this press release that relate to future plans, events, financial results, prospects or performance are forward-looking statements as defined under the Private Securities Litigation Reform Act of 1995. Actual results may differ materially from those anticipated as a result of certain risks and uncertainties, including but not limited to the ability of Salem to close and integrate announced transactions, market acceptance of Salem’s radio station formats, competition from new technologies, adverse economic conditions, and other risks and uncertainties detailed from time to time in Salem’s reports on Forms 10-K, 10-Q, 8-K and other filings filed with or furnished to the Securities and Exchange Commission. Readers are cautioned not to place undue reliance on these forward-looking statements, which speak only as of the date hereof. Salem undertakes no obligation to update or revise any forward-looking statements to reflect new information, changed circumstances or unanticipated events.

(1) Regulation G

Management uses certain non-GAAP financial measures defined
below in communications with investors, analysts, rating agencies, banks and
others to assist such parties in understanding the impact of various items on
its financial statements. The company uses these non-GAAP financial measures to
evaluate financial results, develop budgets, manage expenditures and as a
measure of performance under compensation programs.

The company’s presentation of these non-GAAP financial measures
should not be considered as a substitute for or superior to the most directly
comparable financial measures as reported in accordance with GAAP.

Regulation G defines and prescribes the conditions under which
certain non-GAAP financial information may be presented in this earnings
release. The company closely monitors EBITDA, Adjusted EBITDA, Station
Operating Income (“SOI”), Same Station net broadcast revenue, Same Station
broadcast operating expenses, Same Station Operating Income, Digital Media
Operating Income, Publishing Operating Income (Loss), and operating expenses
excluding gains or losses on the disposition of assets, stock-based
compensation, changes in the estimated fair value of contingent earn-out
consideration, impairments, depreciation and amortization, all of which are
non-GAAP financial measures. The company believes that these non-GAAP financial
measures provide useful information about its core operating results, and thus,
are appropriate to enhance the overall understanding of its financial performance.
These non-GAAP financial measures are intended to provide management and
investors a more complete understanding of its underlying operational results,
trends and performance.

The company defines Station Operating Income (“SOI”) as net
broadcast revenue minus broadcast operating expenses. The company defines
Digital Media Operating Income as net Digital Media Revenue minus Digital Media
Operating Expenses. The company defines Publishing Operating Income (Loss) as
net Publishing Revenue minus Publishing Operating Expenses. The company defines
EBITDA as net income before interest, taxes, depreciation, and amortization.
The company defines Adjusted EBITDA as EBITDA before gains or losses on the
disposition of assets, before changes in the estimated fair value of contingent
earn-out consideration, before impairments, before net miscellaneous income and
expenses, before gain on bargain purchase, before (gain) loss on early
retirement of long-term debt and before non-cash compensation expense. SOI,
Digital Media Operating Income, Publishing Operating Income (Loss), EBITDA and
Adjusted EBITDA are commonly used by the broadcast and media industry as
important measures of performance and are used by investors and analysts who
report on the industry to provide meaningful comparisons between broadcasters.
SOI, Digital Media Operating Income, Publishing Operating Income (Loss), EBITDA
and Adjusted EBITDA are not measures of liquidity or of performance in
accordance with GAAP and should be viewed as a supplement to and not a
substitute for or superior to its results of operations and financial condition
presented in accordance with GAAP. The company’s definitions of SOI, Digital
Media Operating Income, Publishing Operating Income (Loss), EBITDA and Adjusted
EBITDA are not necessarily comparable to similarly titled measures reported by
other companies.

The company defines Adjusted Free Cash Flow as Adjusted EBITDA
less cash paid for capital expenditures, less cash paid for income taxes, and
less cash paid for interest. The company considers Adjusted Free Cash Flow to
be a liquidity measure that provides useful information to management and
investors about the amount of cash generated by its operations after cash paid
for capital expenditures, cash paid for income taxes and cash paid for
interest. A limitation of Adjusted Free Cash Flow as a measure of liquidity is
that it does not represent the total increase or decrease in its cash balance
for the period. The company uses Adjusted Free Cash Flow, a non-GAAP liquidity
measure, both in presenting its results to stockholders and the investment
community, and in its internal evaluation and management of the business. The
company’s presentation of Adjusted Free Cash Flow is not intended to be
considered in isolation or as a substitute for the financial information
prepared and presented in accordance with GAAP. The company’s definition of
Adjusted Free Cash Flow is not necessarily comparable to similarly titled
measures reported by other companies.

The company defines Same Station net broadcast revenue as
broadcast revenue from its radio stations and networks that the company owns or
operates in the same format on the first and last day of each quarter, as well
as the corresponding quarter of the prior year. The company defines Same
Station broadcast operating expenses as broadcast operating expenses from its
radio stations and networks that the company owns or operates in the same
format on the first and last day of each quarter, as well as the corresponding
quarter of the prior year. The company defines Same Station SOI as Same Station
net broadcast revenue less Same Station broadcast operating expenses. Same
Station operating results include those stations that the company owns or
operates in the same format on the first and last day of each quarter, as well
as the corresponding quarter of the prior year. Same Station operating results
for a full calendar year are calculated as the sum of the Same Station-results
for each of the four quarters of that year. The company uses Same Station
operating results, a non-GAAP financial measure, both in presenting its results
to stockholders and the investment community, and in its internal evaluations
and management of the business. The company believes that Same Station
operating results provide a meaningful comparison of period over period
performance of its core broadcast operations as this measure excludes the
impact of new stations, the impact of stations the company no longer owns or
operates, and the impact of stations operating under a new programming format.
The company’s presentation of Same Station operating results are not intended
to be considered in isolation or as a substitute for the financial information
prepared and presented in accordance with GAAP. The company’s definition of
Same Station operating results is not necessarily comparable to similarly
titled measures reported by other companies.

For all non-GAAP financial measures, investors should consider
the limitations associated with these metrics, including the potential lack of
comparability of these measures from one company to another.

The Supplemental Information tables that follow the condensed
consolidated financial statements provide reconciliations of the non-GAAP
financial measures that the company uses in this earnings release to the most
directly comparable measures calculated in accordance with GAAP. The company
uses non-GAAP financial measures to evaluate financial performance, develop
budgets, manage expenditures, and determine employee compensation. The company’s
presentation of this additional information is not to be considered as a
substitute for or superior to the directly comparable measures as reported in
accordance with GAAP.

Salem Media Group, Inc.

Condensed Consolidated Statements of
Operations

(in thousands, except share and per share
data)


Three Months Ended


March 31,


2021


2022


(Unaudited)

Net broadcast revenue


$

44,048


$

48,432


Net digital media revenue


9,619


10,300


Net publishing revenue


5,686


3,877


Total revenue


59,353


62,609


Operating expenses:


Broadcast operating expenses


33,343


38,121


Digital media operating expenses


8,673


8,473


Publishing operating expenses


5,205


4,467


Unallocated corporate expenses


4,288


4,810


Change in the estimated fair value of contingent earn-out consideration


(5

)

Debt modification costs


228


Depreciation and amortization


3,170


3,276


Net (gain) loss on the disposition of assets


318


(1,735

)

Total operating expenses


54,997


57,635


Operating income


4,356


4,974


Other income (expense):


Interest income


1


Interest expense


(3,926

)


(3,394

)

Loss on early retirement of long-term debt


(53

)

Net miscellaneous income and (expenses)


22


1


Net income before income taxes


453


1,528


Provision for (benefit from) income taxes


130


(211

)

Net income


$

323


$

1,739


Basic earnings per share Class A and Class B common stock


$

0.01


$

0.06


Diluted earnings per share Class A and Class B common stock


$

0.01


$

0.06


Basic weighted average Class A and Class B common stock shares outstanding


26,736,639


27,177,375


Diluted weighted average Class A and Class B common stock shares outstanding


27,138,773


27,610,407


Salem Media Group, Inc.

Condensed Consolidated Balance Sheets

(in thousands)


December 31, 2021


March 31, 2022


(Unaudited)

Assets


Cash


$

1,785


$

Accounts receivable, net


25,663


28,000

Other current assets


14,066


15,330

Property and equipment, net


79,339


80,262

Operating and financing lease right-of-use assets


43,665


45,985

Intangible assets, net


346,438


346,294

Deferred financing costs


843


793

Other assets


4,313


6,994

Total assets


$

516,112


$

523,658


Liabilities and
Stockholders’ Equity


Current liabilities


$

51,455


$

57,031

Long-term debt


170,581


168,300

Operating and financing lease liabilities, less current portion


42,273


44,777

Deferred income taxes


67,012


67,007

Other liabilities


6,580


6,393

Stockholders’ Equity


178,211


180,150

Total liabilities
and stockholders’ equity


$

516,112


$

523,658


SALEM MEDIA GROUP, INC.

CONDENSED CONSOLIDATED STATEMENTS OF
STOCKHOLDERS’ EQUITY

(Dollars in thousands, except share and per
share data
)


Class A


Class B


Common Stock


Common Stock


Additional


Paid-In


Accumulated


Treasury


Shares


Amount


Shares


Amount


Capital


Deficit


Stock


Total

Stockholders’
equity, December 31, 2020

23,447,317


$

227


5,553,696


$

56


$

247,025


$

(78,023

)


$

(34,006

)


$

135,279

Stock-based compensation


78


78

Options exercised

185,782


2


390


392

Net income


323


323

Stockholders’
equity,

March 31, 2021

23,633,099


$

229


5,553,696


$

56


$

247,493


$

(77,700

)


$

(34,006

)


$

136,072


Class A


Class B


Common Stock


Common Stock


Additional


Paid-In


Accumulated


Treasury


Shares


Amount


Shares


Amount


Capital


Deficit


Stock


Total

Stockholders’
equity, December 31, 2021

23,922,974


$

232


5,553,696


$

56


$

248,438


$

(36,509

)


$

(34,006

)


$

178,211

Stock-based compensation


106


106

Options exercised

40,913


94


94

Lapse in restricted shares

14,854


Net income


1,739


1,739

Stockholders’
equity, March 31, 2022

23,978,741


$

232


5,553,696


$

56


$

248,638


$

(34,770

)


$

(34,006

)


$

180,150


SALEM MEDIA GROUP, INC.

CONDENSED CONSOLIDATED STATEMENTS OF CASH
FLOWS

(Dollars in thousands)

(Unaudited)


Three Months Ended

March 31,


2021


2022

OPERATING ACTIVITIES


Net income

$

323


$

1,739


Adjustments to reconcile net income to net cash provided by operating activities:


Non-cash stock-based compensation


78


106


Depreciation and amortization


3,170


3,276


Amortization of deferred financing costs


213


247


Non-cash lease expense


2,161


2,202


Provision for bad debts


(295

)


(209

)

Deferred income taxes


188


(5

)

Change in the estimated fair value of contingent earn-out consideration


(5

)

Loss on early retirement of long-term debt


53


Net (gain) loss on the disposition of assets


318


(1,735

)

Changes in operating assets and liabilities:


Accounts receivable and unbilled revenue


2,549


(2,229

)

Inventories


(93

)


(411

)

Prepaid expenses and other current assets


(750

)


(748

)

Accounts payable and accrued expenses


2,490


4,024


Operating lease liabilities


(2,497

)


(1,852

)

Contract liabilities


1,122


136


Deferred rent income


170


(58

)

Other liabilities


29


Income taxes payable


21


(218

)

Net cash provided by operating activities


9,197


4,313


INVESTING ACTIVITIES


Cash paid for capital expenditures net of tenant improvement allowances


(1,859

)


(3,439

)

Capital expenditures reimbursable under tenant improvement allowances and trade agreements


(40

)

Deposit on broadcast assets and radio station acquisitions


(100

)


Purchases of broadcast assets and radio stations


(540

)

Investment in LLC


(2,000

)

Proceeds from sale of long-lived assets


3,501


2,001


Other


(238

)


(858

)

Net cash provided by (used in) investing activities


1,304


(4,876

)

FINANCING ACTIVITIES


Payments to repurchase 2024 Notes


(2,531

)

Proceeds from borrowings under ABL Facility


16


6,257


Payments on ABL Facility


(5,016

)


(6,257

)

Proceeds from borrowings under PPP Loans


11,195


Payments of debt issuance costs


(3

)


Proceeds from the exercise of stock options


392


94


Payments on financing lease liabilities


(16

)


(16

)

Book overdraft


1,231


Net cash provided by (used in) financing activities


6,568


(1,222

)

Net increase (decrease) in cash and cash equivalents


17,069


(1,785

)

Cash and cash equivalents at beginning of year


6,325


1,785


Cash and cash equivalents at end of period

$

23,394


$


The company defines EBITDA (1) as net income before interest, taxes, depreciation, and amortization. The table below presents a reconciliation of EBITDA (1) to Net Income (Loss), the most directly comparable GAAP measure. EBITDA (1) is a non-GAAP financial performance measure that is not to be considered a substitute for or superior to the directly comparable measures reported in accordance with GAAP. The company defines Adjusted EBITDA (1) as EBITDA (1) before gains or losses on the disposition of assets, before changes in the estimated fair value of contingent earn-out consideration, before impairments, before net miscellaneous income and expenses, before (gain) loss on early retirement of long-term debt and before non-cash compensation expense. The table below presents a reconciliation of Adjusted EBITDA (1) to Net Income, the most directly comparable GAAP measure. Adjusted EBITDA (1) is a non-GAAP financial performance measure that is not to be considered a substitute for or superior to the directly comparable measures reported in accordance with GAAP.

Salem Media Group, Inc.

Supplemental Information

(in thousands)

Three Months Ended

March 31,

2021


2022

(Unaudited)

Net income

$

323

$

1,739

Plus interest expense, net of capitalized interest

3,926

3,394

Plus provision for (benefit from) income taxes

130

(211)

Plus depreciation and amortization

3,170

3,276

Less interest income


(1)


EBITDA

$

7,548

$

8,198

Less net (gain) loss on the disposition of assets

318

(1,735)

Less change in the estimated fair value of contingent

earn-out consideration


(5)

Plus debt modification costs


228

Plus loss on early retirement of long-term debt

53

Plus net miscellaneous income and expenses


(22)


(1)

Plus non-cash stock-based compensation


78


106

Adjusted EBITDA

$

7,922

$

6,844

The company defines Adjusted Free Cash Flow (1) as Adjusted EBITDA (1) less cash paid for capital expenditures, less cash paid for income taxes, and less cash paid for interest. The company considers Adjusted Free Cash Flow to be a liquidity measure that provides useful information to management and investors about the amount of cash generated by its operations after cash paid for capital expenditures, cash paid for income taxes and cash paid for interest. A limitation of Adjusted Free Cash Flow as a measure of liquidity is that it does not represent the total increase or decrease in its cash balance for the period. The company uses Adjusted Free Cash Flow, a non-GAAP liquidity measure, both in presenting its results to stockholders and the investment community, and in its internal evaluation and management of the business. The company’s presentation of Adjusted Free Cash Flow is not intended to be considered in isolation or as a substitute for the financial information prepared and presented in accordance with GAAP. The company’s definition of Adjusted Free Cash Flow is not necessarily comparable to similarly titled measures reported by other companies.

The table below presents a reconciliation of Adjusted Free Cash Flow to net cash provided by operating activities, the most directly comparable GAAP measure. Adjusted Free Cash Flow is a non-GAAP liquidity measure that is not to be considered a substitute for or superior to the directly comparable measures reported in accordance with GAAP.

Salem Media Group, Inc.

Supplemental Information

(in thousands)


Three Months Ended

March 31,

2021

2022

(Unaudited)

Net cash provided by operating activities

$

9,197


$

4,313


Non-cash stock-based compensation

(78

)

(106

)

Depreciation and amortization

(3,170

)

(3,276

)

Amortization of deferred financing costs

(213

)

(247

)

Non-cash lease expense


(2,161

)


(2,202

)

Provision for bad debts

295


209


Deferred income taxes

(188

)

5


Change in the estimated fair value of contingent earn- out consideration


5


Net (gain) loss on the disposition of assets

(318

)

1,735


Loss on early retirement of long-term debt


(53

)

Changes in operating assets and liabilities:


Accounts receivable and unbilled revenue

(2,549

)

2,229


Inventories

93


411


Prepaid expenses and other current assets

750


748


Accounts payable and accrued expenses

(2,490

)

(4,024

)

Contract liabilities

(1,122

)

(136

)

Operating lease liabilities (deferred rent)

2,497


1,852


Deferred rent income


(170

)


58


Other liabilities


(29

)


Income taxes payable


(21

)


218


Net income

$

323


$

1,739


Plus interest expense, net of capitalized interest

3,926


3,394


Plus provision for (benefit from) income taxes

130


(211

)

Plus depreciation and amortization

3,170


3,276


Less interest income


(1

)


EBITDA

$

7,548


$

8,198


Plus net (gain) loss on the disposition of assets

318


(1,735

)

Plus change in the estimated fair value of contingent earn-out consideration


(5

)

Plus debt modification costs


228


Plus loss on early retirement of long-term debt


53


Plus net miscellaneous income and expenses


(22

)


(1

)

Plus non-cash stock-based compensation


78


106


Adjusted EBITDA

$

7,922


$

6,844


Less net cash paid for capital expenditures (1)

(1,859

)

(3,439

)

Plus cash received (paid for) taxes

79


(12

)

Less cash paid for interest, net of capitalized interest


(53

)


(65

)

Adjusted Free Cash Flow

$

6,089


$

3,328

(1) Net cash paid for capital expenditures reflects actual cash payments net of cash reimbursements under tenant improvement allowances and net of property and equipment acquired in trade transactions.


Selected Debt Data

Outstanding at

Applicable Interest Rate

March 31, 2022

Senior Secured Notes due 2028 (1)

$

114,731,000

7.125%

Senior Secured Notes due 2024 (2)

$

57,674,000

6.750%

(1) $114.7 million notes with semi-annual interest payments at an annual rate of 7.125%.

(2) $57.7 million notes with semi-annual interest payments at an annual rate of 6.750%.


View source version on businesswire.com: https://www.businesswire.com/news/home/20220506005535/en/

Evan D. Masyr
Executive Vice President and Chief
Financial Officer
(805) 384-4512
evan@salemmedia.com

Source: Salem Media Group, Inc.


Release – Flotek Announces Shareholder Approval of $2 Billion+ Long Term Contract


Flotek Announces Shareholder Approval of $2 Billion+ Long Term Contract

Research, News, and Market Data on Flotek Industries

HOUSTON, May 10, 2022 – Flotek Industries, Inc. (“Flotek” or the “Company”) (NYSE: FTK), a leader in technology-driven specialty green chemistry solutions, today announced that Flotek’s shareholders overwhelmingly approved the previously-announced agreement with ProFrac Holdings, LLC (“ProFrac”) to expand the existing long-term supply agreement with one of ProFrac’s affiliates.
 

The results from yesterday’s meeting indicate that approximately 98.5% of the votes cast by Flotek common stock voted in favor of the proposal to approve the transactions contemplated by the agreement with ProFrac.  The full results of the vote are available in a Current Report on Form 8-K filed with Securities & Exchange Commission on May 9, 2022.
 

The transactions are expected to close expeditiously, subject to usual and customary closing conditions.
 

About Flotek
Industries, Inc.

Flotek Industries, Inc. creates solutions to reduce the environmental impact of energy on air, water, land and people.  A technology-driven, specialty green chemistry and data company, Flotek helps customers across industrial, commercial, and consumer markets improve their Environmental, Social, and Governance performance. Flotek’s Chemistry Technologies segment develops, manufactures, packages, distributes, delivers, and markets high-quality cleaning, disinfecting and sanitizing products for commercial, governmental and personal consumer use.  Additionally, Flotek empowers the energy industry to maximize the value of their hydrocarbon streams and improve return on invested capital through its real-time data platforms and green chemistry technologies.  Flotek serves downstream, midstream, and upstream customers, both domestic and international.  Flotek is a publicly traded company headquartered in Houston, Texas, and its common shares are traded on the New York Stock Exchange under the ticker symbol “FTK.”  For additional information, please visit www.flotekind.com.

Forward-Looking
Statements

Certain statements set forth in this press release constitute forward-looking statements (within the meaning of Section 27A of the Securities Act of 1933 and Section 21E of the Securities Exchange Act of 1934) regarding Flotek Industries, Inc.’s business, financial condition, results of operations and prospects.  Words such as will, continue, expects, anticipates, intends, plans, believes, seeks, estimates and similar expressions or variations of such words are intended to identify forward-looking statements, but are not the exclusive means of identifying forward-looking statements in this press release.  Although forward-looking statements in this press release reflect the good faith judgment of management, such statements can only be based on facts and factors currently known to management.  Consequently, forward-looking statements are inherently subject to risks and uncertainties, and actual results and outcomes may differ materially from the results and outcomes discussed in the forward-looking statements.  Further information about the risks and uncertainties that may impact the company are set forth in the Company’s most recent filing with the Securities and Exchange Commission on Form 10-K (including, without limitation, in the “Risk Factors” section thereof), and in the Company’s other SEC filings and publicly available documents.  Readers are urged not to place undue reliance on these forward-looking statements, which speak only as of the date of this press release.  The Company undertakes no obligation to revise or update any forward-looking statements in order to reflect, any event or circumstance that may arise after the date of this press release.


Contact:
Investor Relations
E: ir@flotekind.com
P: (713) 726-5322