Release – Palladium One Announces Mineral Resource Estimate for the LK PGE-Cu-Ni Project


Palladium One Announces Mineral Resource Estimate for the LK PGE-Cu-Ni Project

Research, News, and Market Data on Palladium One Mining


1.1 Million Ounces Total Precious Metals, 111 Million Pounds Copper, 92 Million Pounds Nickel and 5 Million Pounds Cobalt in Indicated AND 1.1 million Ounces Total Precious Metals, 173 Million Pounds Copper, 152 Million Pounds Nickel and 8 Million Pounds Cobalt in Inferred

Toronto, Ontario–(Newsfile Corp. – April 25, 2022) – Palladium One Mining Inc. (TSXV: PDM) (OTCQB: NKORF) (FSE: 7N11) (the “Company” or “Palladium One“) is pleased to announce an updated Indicated and Inferred Mineral Resource Estimate (“MRE”) prepared the Company under the supervision of SLR Consulting (Canada) Ltd. (formerly Roscoe, Postle Associates Inc.) disclosed in accordance with National Instrument 43-101 (“NI43-101”) for the 100%-owned Läntinen Koillismaa (“LK”) Project in north-central Finland (Figure 1).

“We are pleased to report important milestones that measurably de-risk our LK PGE-Cu-Ni Project in Finland. Namely, a) a maiden Mineral Resource Estimate at Kaukua South and Murtolampi which increases the Kaukua Area’s indicated resources tonnes by approximately 250%; b) advanced metallurgical testing conducted by SGS (Lakefield) which demonstrates consistently repeatable metallurgical recoveries; and c) the ability to produce both a high-value copper and nickel concentrate using a conventional flotation recovery process.

“These milestones substantially improve the economic potential by confirming scale and by delivering clarity of recovery rates for various rock types.

“With a grade of 30% copper in the copper concentrate and a value of approximately US$4,200 per tonne for the nickel concentrate, both are highly marketable, which bodes well for future concentrate marketing negotiations.

“While continued exploration in 2022 to increase the size of LK is ongoing, we have accelerated baseline environmental studies and plan to advance a Preliminary Economic Assessment (“PEA”).

“The bulk of 2022’s exploration efforts are expected to be in Canada and directed to the award winning Tyko Ni-Cu Project. Once drill permits are received, we plan to drill test several multi-line VTEM anomalies where highly anomalous soil sample values of copper nickel and cobalt were discovered in 2021. To date, additional drill permits have not been received,” commented Derrick Weyrauch, President and CEO.

Highlights

In addition to the Mineral Resource Estimate (“MRE”) which used US$1,700/oz palladium (Table 1a, 2b), a sensitivity analysis was completed with seven optimized open-pit constrained resource estimates, with palladium prices ranging from US$900/oz to US$2,500/oz (Table 2a, 2b).

Mineral Resource Estimate

  • 1.1 million ounces Total Precious Metals (Pd+Pt+Au) (“TMP”) (0.89 g/t), 111 Million Pounds Copper (0.13%), 92 Million Pounds Nickel (0.11%) and 5 million Pounds Cobalt (65 g/t) are classified as Indicated, contained in 38.2 million tonnes (see Table 1b).
  • 1.1 million ounces TMP (0.68 g/t), 173 Million Pounds Copper (0.16%), 152 Million Pounds Nickel (0.14%) and 8 million Pounds Cobalt (74 g/t) are classified as Inferred, contained in 49.7 million tonnes (see Table 1b).
  • 248% increase in Indicated tonnes and a 14% increase in Inferred tonnes.
  • 44% of the MRE is in the Indicated category.
  • A waste to ore ratio (“Strip Ratio”) of 1.48:1 in the Kaukua Area (including Murtolampi) and a 0.58:1 Strip Ratio at Haukiaho.
  • The MRE assumes a Net Smelter Return (“NSR”) cut-off of US$12.50 per tonne, based on a 20,000 tonne per day milling rate.
  • Includes three open-pits in the Kaukua Area (including Murtolampi) and one at Haukiaho, 10-kilometers to the south of Kaukua.
  • Recovered, and payable metal assumptions are based on the 2022 Phase II Metallurgical Testing Program, and preliminary indicative copper and nickel smelter quotes.

Future Resource Expansion

  • LK remains open for additional resource expansion both along strike and at depth.
    • The MRE covers approximately 5 kilometers of the 38-kilometer marginal series contact zone, for which reconnaissance historical drilling indicated mineralization along nearly it’s entire length.
    • The Company’s near-term targeting includes two additional open-pit targets in the Kaukua Area and possibly multiple open-pit targets along the 17-kilometer Haukiaho Trend.
    • Three areas of Target Potential have been defined for near term resource expansion representing an additional 2.4-kilometer of strike length along the favourable marginal series and could add between 21.6 million and 36.0 million tonnes of resource. Refer to Table 3, Figures 4 & 5.

2022 Phase II Metallurgical Testing Program

  • The Phase II Metallurgical Testing Program demonstrates the ability to produce BOTH a high-value copper AND a high-value nickel concentrate (“Con”) utilizing conventional 3-stage flotation.
  • The Cons were readily and consistently reproduced.
  • Locked Cycle Test results:
    • Locked Cycle Bulk Concentrate recoveries: 73.5% Pd, 56.1% Pt, 73.0% Au, 88.6% Cu, 30.3% Ni, and 18.6% Co (Table 5).
    • Copper Concentrate: Grades of 30.0% Cu, 1.43% Ni, 0.1% Co, 38.3 g/t Pd, 13.1 g/t Pt, 11.2 g/t Au representing a value of US$6,300 per tonne of concentrate (Table 6).
    • Nickel Concentrate: Grades of 4.8% Ni, 3.9% Cu, 0.2% Co, 40.8 g/t Pd, 11.0 g/t Pt, 2.9 g/t Au representing a value of US$4,200 per tonne of concentrate.
    • Rhodium values up to 1.7 g/t and 1.0 g/t were reported in both the Nickel and Copper Concentrates respectively, while the MRE does not include rhodium values.
    • Fortunately, both Cons are high in iron and sulfur and low in MgO, thereby improving marketability.
    • A low mass pull of 1.2% was achieved, thereby suggestive of low transportation charges.

Other

  • In aggregate, there is 38 million tonnes of Indicated and 50 million tonnes of inferred in resources, thereby providing the opportunity for a large tonnage long-life mine to be developed.
  • The LK project has excellent infrastructure with paved roads, power, skilled labour and is less than 180 kilometers from the port of Oulu, thereby providing the opportunity for reduced initial capital cost estimates.

Mineral Resource Estimate:

Table 1a. 2022 LK MRE

MINERAL RESOURCE ESTIMATE – April 2022
Tonnes & Grade – US$1,700 Pd per oz

Strip Ratio Tonnes (Mt) Pd Pt Au TPM Cu Ni Co
(g/t) (g/t) (g/t) (g/t) (%) (%) (g/t)
Indicated


Kaukua Area 1.50 38.2 0.61 0.22 0.07 0.89 0.13 0.11 64.56
Inferred


Kaukua Area +Murtolampi 1.45 30.8 0.52 0.20 0.08 0.80 0.14 0.14 86.07
Haukiaho 0.58 18.9 0.27 0.11 0.10 0.48 0.18 0.14 54.30
Total Inf. 1.26 49.7 0.43 0.17 0.09 0.68 0.16 0.14 73.98


Table 1b: 2022 LK MRE In-situ contained metal

MINERAL RESOURCE ESTIMATE – April 2022
Contained Metal – US$1,700 Pd per oz

Strip Pd Pt Au TPM Cu Ni Co
Ratio (M oz) (M oz) (M oz) (M oz) (M lbs) (M lbs) (M lbs)
Indicated


Kaukua Area 1.50 0.74 0.26 0.08 1.09 110.7 91.6 5.4
Inferred


Kaukua Area +Murtolampi 1.45 0.52 0.20 0.07 0.79 96.5 93.9 5.8
Haukiaho 0.58 0.16 0.07 0.06 0.29 76.4 57.5 2.3
Total Inf. 1.26 0.68 0.26 0.14 1.08 172.9 151.5 8.1


Notes

  1. CIM (2014) definitions were followed for Mineral Resources.
  2. The Mineral Resources have been reported above a preliminary open pit constraining surface using a Net Smelter Return (NSR) pit discard cut-off of US$12.5/t (which for comparison purposes equates to an approximately 0.65 g/t Palladium Equivalent in-situ cut-off, based on metal prices only).
  3. The NSR used for reporting is based on the following:
    1. Long term metal prices of US$ 1,700/oz Pd, US$ 1,100/oz Pt, US$ 1,800/oz Au, US$ 4.25/lb Cu, US$ 8.50/lb Ni and US$ 25/lb Co.
    2. Variable metallurgical recoveries for each metal were used at Kaukua and Murtolampi and fixed recoveries of 79.8% Pd, 80.1% Pt, 65% Au, 89% Cu, 64% Ni and 0% Co at Haukiaho.
    3. Commercial terms for a Cu and Ni concentrate based on indicative quotations from smelters.
  4. Total Precious Metals (TPM) equals palladium plus platinum plus gold.
  5. Bulk densities range between 1.8 and 3.23 t/m3.
  6. Numbers may not add up due to rounding.
  7. Mineral Resources, which are not Mineral Reserves, do not have demonstrated economic viability. The estimate of mineral resources may be materially affected by environmental, permitting, legal, title, taxation, sociopolitical, marketing, or other relevant issues.
  8. The quantity and grade of reported inferred resources in this estimation are conceptual in nature and there has been insufficient exploration to define these inferred resources as an indicated or measured mineral resource and it is uncertain if further exploration will result in upgrading them to an indicated or measured mineral resource category.

Palladium Equivalent (PdEq)

Palladium equivalent (“PdEq”) is calculated using US$1,700 per ounce for palladium, US$1,100 per ounce for platinum, US$1,800 per ounce for gold, US$4.25 per pound for copper, US$8.50 per pound for nickel, and $25 per pound cobalt consistent with the calculation used in the Company’s current Mineral Resource Estimate for the LK project. PdEq was used for wireframe construction and metallurgical test work only, and does not include metallurgical recoveries or smelter terms, and was not used for generation of the conceptual pit shells or Mineral Resource reporting. The Mineral Resource tabulation is based on a unit NSR value which includes metal prices, metallurgical recoveries and contract terms for Ni and Cu concentrates.

Mineral Resource Estimation Methodology

The Kaukua/Murtolampti drillhole database comprises 210 drillholes for a total of 44 km drilling. The Haukiaho drillhole database comprises a further 84 drillholes for a total of 13,392.3 m drilling . An updated 3D geological model has been constructed using Leapfrog software version (Figure 4).

Kaukua

For Kaukua, Key lithological units modelled include the basement gabbro and granodiorite as well as the intrusive or Marginal Series pyroxenite, peridotite and gabbronorite units. Major controlling structures have been used to split the deposit into three zones with subsidiary faults, major stratigraphic units, diabase dykes and the overburden modelled within these four zones. Faults outline the Pit, Gap and South Zones (sub-domains of the Kaukua deposit). A topographic surface has been generated using Lidar data.

Grade shells have been modelled at 0.3 g/t and 0.6 g/t PdEq thresholds using the vein system modelling in Leapfrog Geo within the geological constraints as determined.

Capping was completed on assays prior to compositing. A composite length of 6 m has been used, with the composites within each mineralized domain assessed for the need to apply grade caps. Continuity analysis (variography) has been completed on the composited samples within the various mineralization domains with the resultant variograms checked against the mineralization domain to ensure geological consistency.

A block model has been constructed in Hexagon Minesight software using a 6 m (X) by 6 m (Y) by 6 m (Z) block size. No sub-celling or rotation of the block model has been undertaken.

The block model has been coded by lithology and mineralization domain for each element. The later, cross-cutting diabase dykes and overburden have been coded into the block model with the grades for Pd, Pt, Cu, Ni, Co and Au set to background values in the block model.

The estimation of grade has been undertaken in two interpolation passes using ordinary kriging, with the 0.6 g/t PdEq mineralization wireframes used as firm-boundaries during the estimation. Dynamic anisotropy was used to accommodate local changes in dip and strike of the mineralization. Each subsequent interpolation pass has used an increased search ellipse size and a decrease in the minimum number of samples required:

  • Pass 1 estimations have been undertaken using a minimum of three and a maximum of 8 composites into a 120 m x 120 m x 60 m search ellipse, with a maximum of 2 composites per drillhole,

  • Pass 2 estimations have been undertaken using a minimum of one and a maximum of 8 composites into a 200 m x 200 m x 60 m search ellipse, with a maximum of one composite per drillhole,

Final grade estimates for Pd, Pt, Ni, Cu, Co and Au have been validated by statistical analysis and visual comparison to the input drillhole composite data. The estimated Pd, Pt, Cu, Ni, Co and Au grades validate within acceptable limits to the input declustered composite grades. Therefore, the block model accurately reproduces the input grades at a global scale. Swath plots show that there are negligible local biases. Change of support validation shows that the kriged model grades contain a suitable amount of internal dilution for the anticipated mining selectivity.

Blocks were classified as Indicated and Inferred in accordance with CIM Definition Standards 2014. Blocks were classified to the Inferred category if the block fell within 80 m of a composite. Indicated category blocks were classified using a drill-spacing of 50 x 50 m in the Pit area and 100 x 50 m in the South area.

Murtolampi

A grade shell has been modelled at a 0.3 g/t PdEq threshold using the vein system modelling in Leapfrog Geo within the geological constraints as determined.

Capping was completed on assays prior to compositing. A composite length of 6 m has been used, with the composites within each mineralized domain assessed for the need to apply grade caps. The variogram modelled for Kaukua was used at Murtolampti as there are an insufficient number of composites to model a robust variogram.

A block model has been constructed in Hexagon Mineplan software using a 6 m (X) by 6 m (Y) by 6 m (Z) block size. No sub-celling or rotation of the block model has been undertaken.

The block model has been coded by lithology and mineralization domain for each estimation of grade has been undertaken in two interpolation passes.

The estimation of grade has been undertaken in two interpolation passes using ordinary kriging. Anisotropy directions were selected based on the geometry of the mineralization. Each subsequent interpolation pass has used an increased search ellipse size and a decrease in the minimum number of samples required:

  • Pass 1 estimations have been undertaken using a minimum of three and a maximum of 8 composites into a 120 m x 120 m x 60 m search ellipse, with a maximum of 2 composites per drillhole,

  • Pass 2 estimations have been undertaken using a minimum of one and a maximum of 8 composites into a 200 m x 200 m x 60 m search ellipse, with a maximum of one composite per drillhole,

Final grade estimates for Pd, Pt, Ni, Cu, Co and Au have been validated by statistical analysis and visual comparison to the input drillhole composite data. The estimated Pd, Pt, Cu, Ni, Co and Au grades validate within acceptable limits to the input declustered composite grades. Therefore, the block model accurately reproduces the input grades at a global scale. Swath plots show that there are negligible local biases.

Haukiaho

Key lithological units modelled include the basement, gabbro/peridotite/pyroxenite and diabase. A fault divides the mineralization into eastern and western blocks. A topographic surface has been generated using Lidar data.

A grade shell has been modelled at a 0.25 g/t PdEq thresholds using the vein system modelling in Leapfrog Geo within the geological constraints as determined.

Capping was completed on assays prior to compositing. Several historic drillholes are missing Au, Pt and Pd assays. Linear regression (RMA) with high correlation coefficients against Cu and Ni assays has been used to assign Au, Pt and Pd grades to these drillholes. A composite length of 5 m has been used, with the composites within each mineralized domain assessed for the need to apply grade caps.

A block model has been constructed in Hexagon Mineplan software using a 10 m (X) by 10 m (Y) by 10 m (Z) block size. No sub-celling or rotation of the block model has been undertaken.

The block model has been coded by lithology and mineralization domain for each element. The later, cross-cutting diabase dykes and overburden have been coded into the block model with the grades for Pd, Pt, Cu, Ni, Co and Au set to background values in the block model.

The estimation of grade has been undertaken using inverse-distance weighting to the power of three in two interpolation passes, with the 0.25 g/t Pd-equivalent mineralization wireframes used as a hard-boundary during the estimation. Dynamic anisotropy was used to accommodate local changes in dip and strike of the mineralization. Each subsequent interpolation pass has used an increased search ellipse size and a decrease in the minimum number of samples required:

  • Pass 1 estimations have been undertaken using a minimum of three and a maximum of 8 composites into a 200 m x 200 m x 50 m search ellipse, with a maximum of 2 composites per drillhole,

  • Pass 2 estimations have been undertaken using a minimum of two and a maximum of 8 composites into a 300 m x 300 m x 50 m search ellipse, with a maximum of two composites per drillhole,

Final grade estimates for Pd, Pt, Ni, Cu, Co and Au have been validated by statistical analysis and visual comparison to the input drillhole composite data. The estimated Pd, Pt, Cu, Ni, Co and Au grades validate within acceptable limits to the input declustered composite grades. Therefore, the block model accurately reproduces the input grades at a global scale. Swath plots show that there are negligible local biases. Change of support validation shows that the kriged model grades contain a suitable amount of internal dilution for the anticipated mining selectivity.

Blocks were classified as Inferred in accordance with CIM Definition Standards 2014. Blocks were classified to the Inferred category if the block fell within 120 m of a composite.

Table 2a: 2022 LK MRE Sensitivity to Palladium Price – Grade

SENSITIVITY TO CUTOFF GRADE – Mineral Resource Estimate – March 2022

Pd Price Strip Tonnes (Mt) Pd Pt Au TPM Cu Ni Co
(US$/oz) Ratio (g/t) (g/t) (g/t) (g/t) (%) (%) (g/t)

$ 900 1.69 26.8 0.67 0.24 0.08 0.98 0.14 0.12 67.9
Total Indicated $1,400 1.54 35.2 0.62 0.22 0.07 0.91 0.13 0.11 65.2

$1,600 1.51 37.3 0.61 0.22 0.07 0.90 0.13 0.11 64.8

$1,700 1.50 38.2 0.61 0.22 0.07 0.89 0.13 0.11 64.6

$1,800 1.48 39.1 0.60 0.21 0.07 0.88 0.13 0.11 64.4

$2,000 1.54 46.5 0.58 0.21 0.06 0.85 0.12 0.11 65.6

$2,500 1.44 55.3 0.55 0.19 0.06 0.80 0.12 0.11 66.4
Total Inferred $ 900 1.39 31.2 0.47 0.18 0.10 0.75 0.18 0.15 75.2
$1,400 1.29 43.8 0.44 0.17 0.09 0.70 0.16 0.14 74.4
$1,600 1.27 47.7 0.43 0.17 0.09 0.69 0.16 0.14 74.0
$1,700 1.26 49.7 0.43 0.17 0.09 0.68 0.16 0.14 74.0
$1,800 1.24 51.2 0.42 0.16 0.09 0.67 0.16 0.14 73.5
$2,000 1.30 56.6 0.42 0.16 0.08 0.67 0.15 0.14 73.7
$2,500 1.23 68.1 0.40 0.15 0.08 0.64 0.15 0.13 73.2


Notes:

  1. Total Precious Metals (TPM) equals palladium plus platinum plus gold.
  2. Only the Palladium Price is varied, all other commodity prices remained fixed at the 2022 MRE price deck.
  3. Each Palladium price point is tabulated using a conceptual pit specific to that price point.

Table 2b: 2020 LK MRE Sensitivity to Palladium Price – contained metals

RESOURCE SENSITIVITY TO PALLADIUM PRICE (US$ / OZ)
IN-SITU CONTAINED METAL- Mineral Resource Estimate – March 2022

Pd Price Strip Pd Pt Au TPM Cu Ni Co
(US$/oz) Ratio (M oz) (M oz) (M oz) (M oz) (M lbs) (M lbs) (M lbs)
Total Indicated $ 900 1.69 0.58 0.21 0.07 0.85 83.3 67.9 4.0
$1,400 1.54 0.70 0.25 0.08 1.03 104.4 85.6 5.1
$1,600 1.51 0.73 0.26 0.08 1.07 108.8 89.9 5.3
$1,700 1.50 0.74 0.26 0.08 1.09 110.7 91.6 5.4
$1,800 1.48 0.75 0.27 0.08 1.11 112.5 93.4 5.5
$2,000 1.54 0.87 0.31 0.09 1.27 127.0 112.1 6.7
$2,500 1.44 0.97 0.34 0.11 1.42 143.8 133.6 8.1
Total Inferred $ 900 1.39 0.47 0.19 0.10 0.75 120.6 102.8 5.2
$1,400 1.29 0.62 0.24 0.13 0.99 158.9 137.4 7.2
$1,600 1.27 0.66 0.26 0.13 1.06 169.7 147.4 7.8
$1,700 1.26 0.68 0.26 0.14 1.08 172.9 151.5 8.1
$1,800 1.24 0.70 0.27 0.14 1.11 179.1 156.2 8.3
$2,000 1.30 0.77 0.30 0.15 1.21 192.6 170.9 9.2
$2,500 1.23 0.88 0.34 0.17 1.39 220.8 200.6 11.0


Notes:

  1. Total Precious Metals (TPM) equals palladium plus platinum plus gold.
  2. Only the Palladium Price is varied, all other commodity prices remained fixed at the 2022 MRE price deck.
  3. Each Palladium price point is tabulated using a conceptual pit specific to that price point.

Table 3: 2022 LK Target Potential

LK Target Potential – April 2022
Target Potential

Tonnes Low (Mt) Tonnes High (Mt) TPM Low TPM High Cu Low Cu High Ni Low Ni High
(g/t) (g/t) (%) (%) (%) (%)
Kaukua Far East 8.1 13.5 0.6 0.9 0.09 0.13 0.08 0.12
Haukiaho East 13.5 22.5 0.4 0.6 0.12 0.19 0.09 0.15
Total 21.6 36.0 0.5 0.7 0.11 0.17 0.09 0.14


Table 4: Commodity Price Assumptions used in the MRE

COMMODITY PRICES – Mineral Resource Estimate – April 2022

Unit of Measure 3-Year Trailing Average (1) 2-Year Trailing Average (1) Spot Price (2) Prices Used in Mineral Resource Estimation Percentage of Spot Price
Palladium US$/oz $ 2,132 $ 2,305 $ 2,358 $ 1,700 72%
Platinum US$/oz $ 964 $ 1,007 $ 1,011 $ 1,100 109%
Gold US$/oz $ 1,713 $ 1,829 $ 1,947 $ 1,800 92%
Copper US$/lbs $ 3.42 $ 3.82 $ 4.67 $ 4.25 91%
Nickel US$/lbs $ 7.73 $ 8.43 $ 15.04 $ 8.50 57%
Cobalt US$/lbs $ 19.39 $ 21.71 $ 37.11 $ 25 67%


(1) Source: As of April 19, 2022. As quoted on the LBMA & LME for precious & base metals, respectively.
(2) Source: S&P Capital IQ. 2026 estimates used as a proxy.

Metallurgical testing (2022 Phase II program) results:

  • Variability testing for five main lithologies and a Master Composite of similar grade to the Kaukua resource area was conducted.
  • Results:
    • Concentration by conventional floatation produces a saleable bulk concentrate with no deleterious elements, irrespective of lithology.
    • A clean, high value saleable Copper Concentrate can be produced.
    • A clean, high value saleable Nickel-PGE Concentrate can be produced.

A detailed floatation metallurgical program was conducted by the Company on the Kaukua & Kaukua South deposits. Both deposits posses very similar geology and mineralization, and bulk sample of approximately 1 metric tonne from 22 holes comprising both Upper and Lower Zone mineralization was shipped to SGS Lakefield in Canada in summer of 2021. This sample was blended to produce a representative composite sample of the Lower Zone mineralization with grade of 1.66 g/t PdEq (0.63 g/t Pd, 0.22 g/t Pt, 0.10 g/t Au, 0.13% Cu, 0.14% Ni, 88 g/t Co) (Table 5). In additional, ten individual samples (five high and five low grade) consisting of the four dominant rock types that comprise the Lower zone plus a fifth for the Upper zone were analysed for variability testing.

Results from the current metallurgical program have highlighted very consistently reproducible recovery rates form the Kaukua/Kaukua South mineralization. Copper and PGE recovery being only slightly affected by changes in grade, only nickel recovery is significantly affected by grade, as the percentage of silicate nickel increases as grade decreases.

Historical test work in 2011 on the Kaukua deposit was also performed by SGS Lakefield. This earlier composite sample had a similar bulk composition to the current metallurgical sample but was higher grade 2.38 g/t PdEq (0.94 g/t Pd, 0.31 g/t Pt, 0.08 g/t Au, 0.22% Cu, and 0.20% Ni). Results from this earlier test were consistent with result from the current test and further confirm the consistency of the floatation recovery.

In addition to a Bulk Con, a split copper and nickel con were produced. Both of which are highly saleable (Table 6). The Copper Con is particularly high-grade with 30% Cu and high PGEs. The Copper Con represents 30% by weight of the Bulk Con with the Nickel Con comprising 70%. In addition, the Bulk Con had a low 1.2% mass pull, and low deleterious elements including <6% MgO in the nickel concentrate.

The LK project is located 160 north east of the Port City of Oulu, thereby significantly decreasing potential shipping costs. In addition, Finland has domestic copper and nickel smelting capacity further potentially reducing shipping costs.

Table 5: Locked Cycle Test Results for Lower Zone Composite Sample.

LOCKED CYCLE METALLURGICAL TEST RESULTS – April 2022
Products Mass Assay % Distribution/Recovery

Pull
%
Pd g/t Pt g/t Au g/t Cu % Ni % Co % Pd Pt Au Cu Ni Co
Cu Cleaner Con 0.35 38.3 13.1 11.2 30.0 1.43 0.1 21.0 18.8 45.2 67.9 3.4 2.0
Ni 3rd Cleaner Con 0.82 40.8 11.0 2.9 3.9 4.85 0.2 52.5 37.3 27.8 20.7 27.0 16.6
Calc. Bulk Con 1.17 40.1 11.6 5.4 11.7 3.83 0.2 73.5 56.1 73.0 88.6 30.3 18.6
Rougher Con (1) 13.1 3.85 1.11 0.57 1.08 0.46 81.6 64.7 79.8 94.0 39.8
Sample Head
100 0.63 0.24 0.09 0.15 0.15 0.01 100 100 100 100 100 100


(1) The Rougher Con is from an Open Circuit test for comparison purposes, as Rougher Con results are not available from the Locked Cycle test as it is continuously recirculated.
(2) The Nickel recovery is lower than previous test work in 2011 which used a higher grade (2.38 g/t PdEq) composite sample due to a higher percentage of silicate nickel present in the current more representative lower grade (1.66 g/t PdEq) composite sample.

Concentrate Grades from Locked-Cycle Testwork:

Table 6: Concentrate Grades and Value from Locked Cycle Test

CONCENTRATE GRADES – April 2022

Unit of Measure Bulk Concentrate Grade (1) Copper Concentrate Grade (2) Nickel Concentrate Grade (3) Bulk Concentrate Value (1) Copper Concentrate Value (2) Nickel Concentrate Value (3)
Palladium g/t 40.1 38.3 40.8 $2,189 $2,093 $2,230
Platinum g/t 11.6 13.1 11.0 $411 $463 $389
Gold g/t 5.4 11.2 2.9 $312 $648 $170
Copper % 11.7 30.0 3.9 $1,095 $2,811 $365
Nickel % 3.83 1.43 4.85 $718 $268 $909
Cobalt g/t 0.2 0.1 0.2 $94 $55 $110
Rhodium (4) g/t 1.5 1.0 1.7 $479 $322 $547
PdEq (5) g/t 88.2 116.0 76.4


$ Value (5) US$/t


$4,819 $6,339 $4,173


(1) Represents aggregate concentrate produced.
(2) Represents preferential copper segregation form the Bulk Concentrate.
(3) Represents the remaining Bulk concentrate less the Copper Concentrate extracted.
(4) Rhodium was not consistently analyzed for; these values represent select analysis of nickel and copper concentrates; a price of $10,000/oz was used for purpose of this table for information purposes only.
(5) PdEq and Concentrate Value is calculated using metal price only for information purposes, it does not include Rhodium and is calculated using the current resource price deck of $1,700 US oz Pd, $1,100 US oz Pt, $1,800 US oz Au, $4.25 US lb Cu, $8.50 US lb Ni, and $25 US lb Co.

Methodology:

A resource average master composite was created with representative samples from the four lithologies containing both high- and low-grade samples. The flowsheet developed produced separate Cu and Ni concentrates and the results were confirmed in a locked cycle test which simulates plant conditions. The results of the locked cycle test are presented in Table 1.

Indicative quotations were obtained from smelters for the concentrates produced. Using those terms, the overall smelter returns which include payable metal in addition to treatment and refining charges for metal recovered to the concentrates using a split Nickel and Copper Cons were, Cu 80.3%, Ni 41.8%, Pd 85.3%, Pt 77.3% and Au 79.6%.

In addition to the locked cycle test on the master composite, open circuit tests of 10 variability samples representing the four lithologies of the master composite plus a composite for the Upper Zone were conducted utilizing the flowsheet developed. The results from all tests produced quality concentrates with a very consistent rougher recovery relationship of each metal to its feed grade. The relationships established were used to estimate the rougher recovery from the resource. The rougher recovery relationship combined with the locked cycle test cleaner recovery was used to determine the overall metal recovery. The smelter return for each metal was applied to the overall recovery to determine revenue.

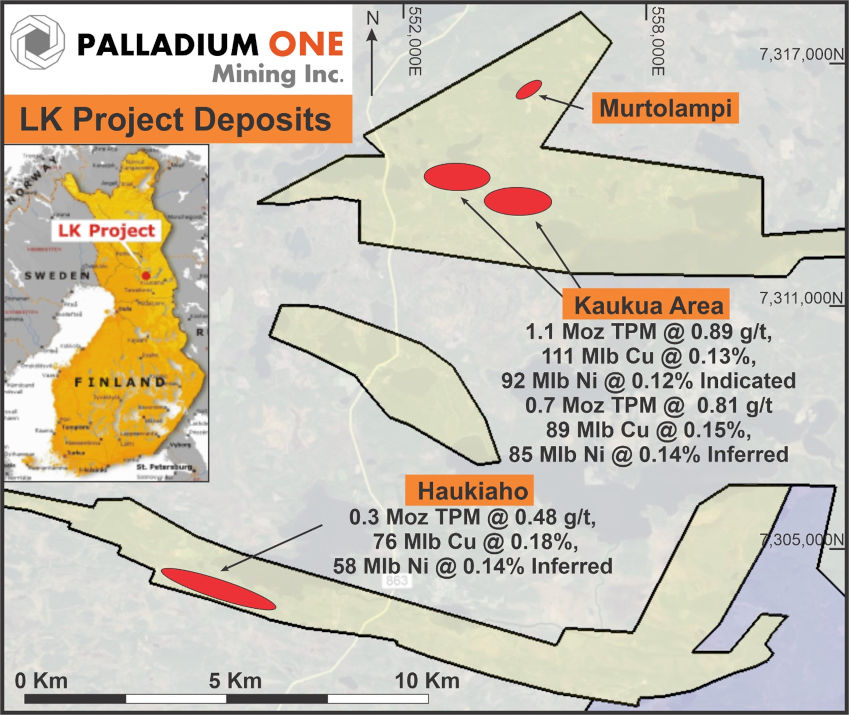
Figure 1 – Location map of LK Project and Open Pit Mineral Resources (red ellipses). The yellow shaded area represents the outer property boundary of the LK Project, and include both Exploration Permits and Permit Applications. The Blue shaded area represents the Company’s adjoining KS Project. TPM represents in-situ Total Precious Metals (Pd + Pt + Au). UTM grid datum is ETRS 35Fin, Zone 35W.

>


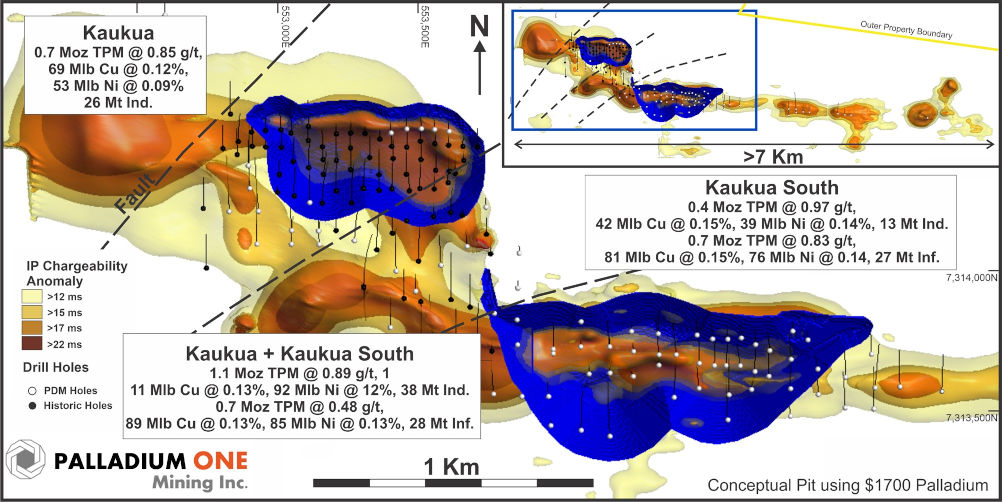
Figure 2 – Kaukua Area showing conceptual open pits superimposed on IP chargeability with both historical and Palladium One drill holes. TPM represents in-situ Total Precious Metals (Pd + Pt + Au).


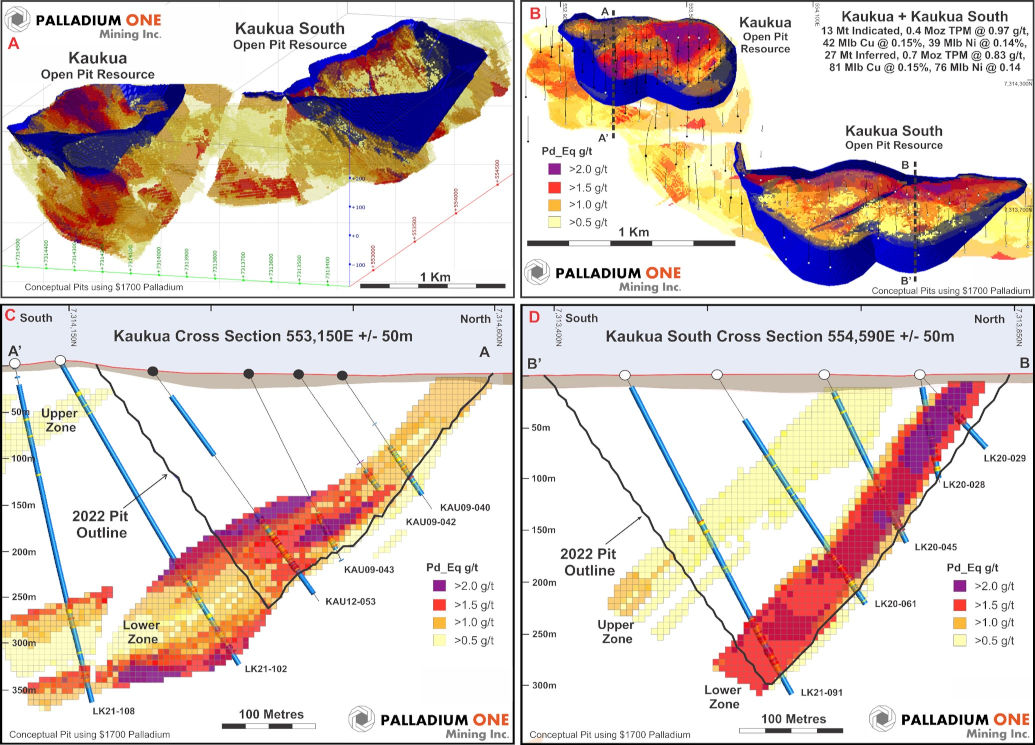
Figure 3 – A Isometric view looking to the northeast, Kaukua Area pits superimposed on the block model. B Plan view of the Kuakua Area pits superimposed on the block model and showing cross section locations. TPM represents in-situ Total Precious Metals (Pd + Pt + Au). C Cross section A-A’ looking west of the Kaukua pit showing drilling and the block model. D Cross section B-B’ looking west of the Kaukua South pit showing drilling and the block model.


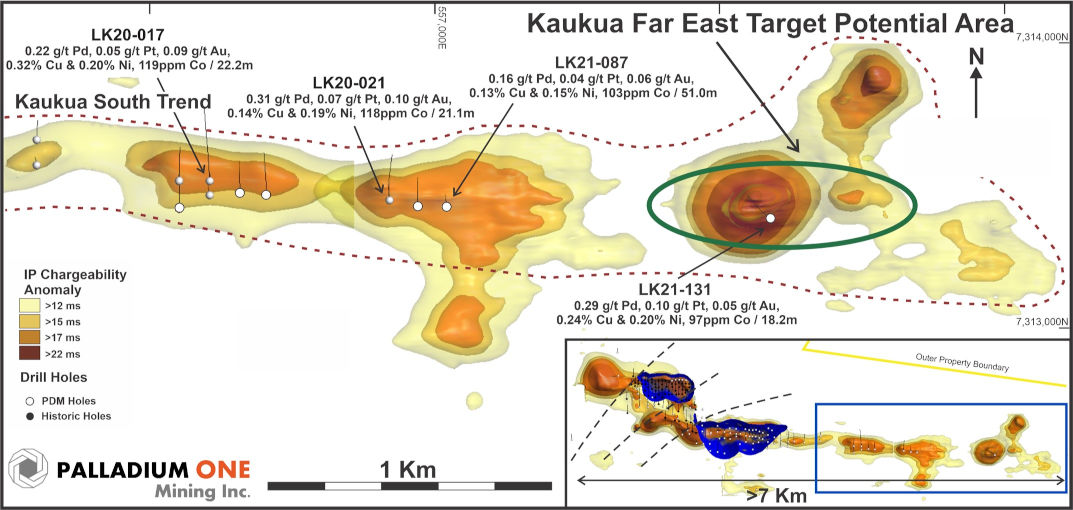
Figure 4. Kaukua Area showing eastern extension of the Kaukua South trend with Target Potential areas outlined in green.


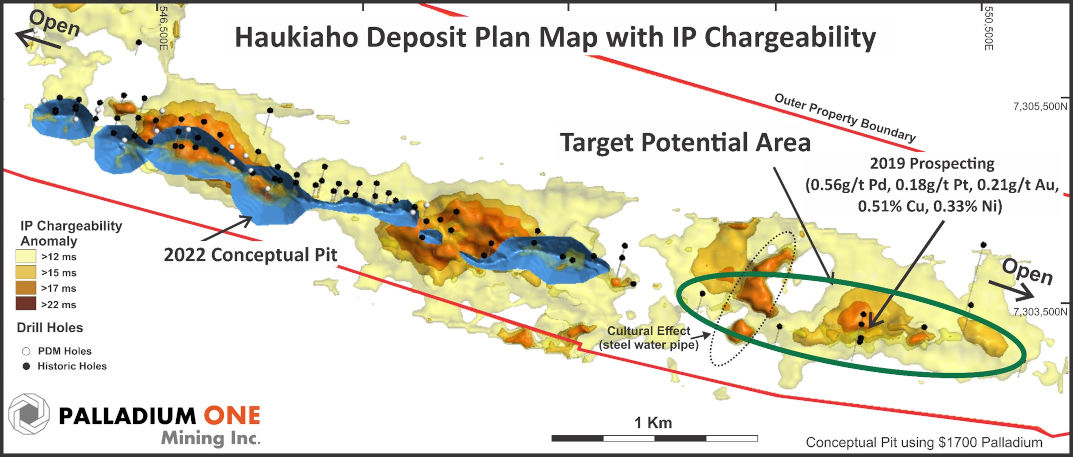
Figure 5. Huakiaho area with current conceptual open pit (blue) and Target Potential areas outlined in green.

Qualified Person

The Mineral Resource Estimate was prepared by the Company under the supervision of Mr. Sean Horan, P.Geo., Technical Manager of Geology at SLR Consulting Ltd., based in Toronto, Ontario, Canada. Mr. Horan is an Independent Qualified Person as defined by NI 43-101. The Mineral Resource Estimate in this news release has been classified in accordance with CIM Definition Standards on Mineral Resources and Mineral Reserves (May 14, 2014). Mr. Horan has read and approved the contents of this news release, as it relates to the disclosed Mineral Resource Estimate.

For the purposes of this news release, Mr. Neil Pettigrew, M.Sc., P. Geo., Vice President of Exploration and a director of the Company is the designated non-Independent Qualified Person and has reviewed and approved the scientific and technical information in this news release.

About Palladium One

Palladium One Mining Inc. (TSXV: PDM) is focused on discovering environmentally and socially conscious Metals for Green Transportation. A Canadian mineral exploration and development company, Palladium One is targeting district scale, platinum-group-element (PGE)-copper-nickel deposits in leading mining jurisdictions. Its flagship project is the Läntinen Koillismaa (LK) Project in north-central Finland, which is ranked by the Fraser Institute as one of the world’s top countries for mineral exploration and development. LK is a PGE-copper-nickel project that has existing Mineral Resources. PDM’s second project is the 2020 Discovery of the Year Award winning Tyko Project, a high-grade sulphide, copper-nickel project located in Canada. Follow Palladium One on LinkedIn, Twitter, and at www.palladiumoneinc.com.

ON BEHALF OF THE BOARD
“Derrick Weyrauch”
President & CEO, Director

For further information contact:
Derrick Weyrauch, President & CEO
Email: 
info@palladiumoneinc.com

Neither the TSX Venture Exchange nor its Market Regulator (as that term is defined in the policies of the TSX Venture Exchange) accepts responsibility for the adequacy or accuracy of this release.

This press release is not an offer or a solicitation of an offer of securities for sale in the United States of America. The common shares of Palladium One Mining Inc. have not been and will not be registered under the U.S. Securities Act of 1933, as amended, and may not be offered or sold in the United States absent registration or an applicable exemption from registration.

Information set forth in this press release may contain forward-looking statements. Forward-looking statements are statements that relate to future, not past events. In this context, forward-looking statements often address a company’s expected future business and financial performance, and often contain words such as “anticipate”, “believe”, “plan”, “estimate”, “expect”, and “intend”, statements that an action or event “may”, “might”, “could”, “should”, or “will” be taken or occur, or other similar expressions. By their nature, forward-looking statements involve known and unknown risks, uncertainties and other factors which may cause our actual results, performance or achievements, or other future events, to be materially different from any future results, performance or achievements expressed or implied by such forward-looking statements. Such factors include, among others, risks associated with project development; the need for additional financing; operational risks associated with mining and mineral processing; fluctuations in palladium and other commodity prices; title matters; environmental liability claims and insurance; reliance on key personnel; the absence of dividends; competition; dilution; the volatility of our common share price and volume; and tax consequences to Canadian and U.S. Shareholders. Forward-looking statements are made based on management’s beliefs, estimates and opinions on the date that statements are made and the Company undertakes no obligation to update forward-looking statements if these beliefs, estimates and opinions or other circumstances should change. Investors are cautioned against attributing undue certainty to forward-looking statements.

Is Cannabis Tourism a Good Idea


Image credit: Indrid Cold (Flickr)


The Untapped Economic Opportunity of Cannabis Tourism


Three years into the federal legalization of cannabis in Canada, almost all the pieces are in place for the growth of a robust cannabis tourism industry – except one.

Cannabis tourism includes the variety of activities, events and places that are part of any vacation or travel plans that incorporate cannabis. What’s missing are the rules around consuming cannabis socially in public settings, highlighting a broader issue about cannabis legalization in Canada.


This article was republished with permission from The Conversation, a news site dedicated to sharing ideas from academic experts. It was written by and represents the research-based opinions of Susan Dupej, SSHRC Postdoctoral Research Fellow, Gordon E. Lang School of Business and Economics, University of Guelph.


My recent research on the cannabis industry suggests that integrating cannabis consumption into tourism will have positive social impacts toward normalization, acceptance and tolerance of cannabis.

Re-framing a once-demonized substance as a legitimate recreational resource, tourism can play an important role in challenging stigma.


What is Cannabis Tourism?

Similar to findings from the United States, preliminary Canadian market research around cannabis travel point to untapped economic opportunities for incorporating cannabis into travel experiences. This interest is likely to increase as attitudes become more open towards cannabis.

Cannabis tourism can include a variety of services and experiences, such as tour companies, booking platforms, cannabis friendly accommodations, lounges, bud-tending services, spas, consumer trade shows, specialty travel guides, retail locations, as well as events such as festivals, comedy shows and others.

In all of its forms, cannabis tourism is an educational platform for sharing different types of knowledge about growing the plant, understanding how cannabis interacts with the body, legally purchasing cannabis, the different product types available, the different ways to consume cannabis and the cultural context surrounding cannabis in different locations.


Coffeeshop Smokey is a cannabis coffee shop located in Rembrandt Square, Amsterdam


If the iconic coffee shops of Amsterdam have taught us anything it’s that the ability to purchase and consume cannabis in a lounge-type setting, without fear of reprimand by the authorities or judgement by the general public, attracts tourism.

The ability to legally consume cannabis in public for social, recreational and leisure purposes offers timely opportunities for businesses in the tourism and hospitality industry hit hard by the pandemic.

Yet, a regulation gap has prevented the development of spaces in which people can responsibly consume cannabis products. In order for the cannabis tourism industry to move forward in a socially responsible and sustainable way, regulation is required in the area of cannabis consumption.


Closing the Regulation Gap

Closing the regulatory gap around cannabis consumption requires two things.

First, legislators must set aside outdated, uninformed and mistaken ideas that associate cannabis with deviancy and illegitimate behaviour. Education has a significant role to play changing perceptions.

Second, regulation around consumption must be thought of as an extension of the cannabis supply chain in Canada.

Similar to the legal production and sale of cannabis, spaces of public consumption can be regulated through licensing. Obtaining a license would enable a business to offer patrons the option of legally consuming cannabis on premises.

One level of hospitality licensing could include the on-site consumption of pre-packaged foods and beverages, which would allow an individual to purchase an edible at a café or lounge and consume it at the same establishment.

Another layer of licensing could address temporary events, such as concerts and festivals, with designated outdoor consumption areas for combustibles. Licensing also needs to address infused food and beverages prepared and served by restaurants.


A Global Leader in Cannabis Tourism?

Regulations are a great way to promote Canada as a safe destination to experience cannabis and entice the global travel audience. Beyond economic benefits, regulating cannabis consumption supports the government’s own objectives of reducing risk and supporting public health.

Most significantly, Canada is in a position to be a global leader in setting an international precedent for socially responsible and informed policy for an historically stigmatized and misunderstood substance.

But, a vibrant cannabis tourism industry in Canada is being held back by a lack of clear and meaningful rules. Regulations enabling public cannabis consumption will open up a new frontier for cannabis in Canada and, at the same time, push forward a socially responsible and progressive agenda for tourism that benefits tourists and citizens alike.


Suggested Content


The Risky Position Elon Musk is Placing Himself In


Psychedelic Medicine a Revolution for the Mind


GABY Inc. NobleCon18 Presentation


Schwazze  NobleCon18 Presentation


Stay up to date. Follow us:


Blackboxstocks Inc. (BLBX) – NobleCon 18 Presentation Notes

Monday, April 25, 2022

Blackboxstocks Inc. (BLBX)
NobleCon 18 Presentation Notes

Blackboxstocks, Inc. is a financial technology and social media hybrid platform offering real-time proprietary analytics and news for stock and options traders of all levels. Our web-based software employs “predictive technology” enhanced by artificial intelligence to find volatility and unusual market activity that may result in the rapid change in the price of a stock or option. Blackbox continuously scans the NASDAQ, New York Stock Exchange, CBOE, and all other options markets, analyzing over 10,000 stocks and up to 1,500,000 options contracts multiple times per second. We provide our users with a fully interactive social media platform that is integrated into our dashboard, enabling our users to exchange information and ideas quickly and efficiently through a common network. We recently introduced a live audio/screenshare feature that allows our members to broadcast on their own channels to share trade strategies and market insight within the Blackbox community. Blackbox is a SaaS company with a growing base of users that spans 42 countries; current subscription fees are $99.97 per month or $959.00 annually. For more information, go to: www.blackboxstocks.com

Joe Gomes, Senior Research Analyst, Noble Capital Markets, Inc.

Joshua Zoepfel, Research Associate, Noble Capital Markets, Inc.

Refer to the full report for the price target, fundamental analysis, and rating.

    NobleCon 18. Blackboxstocks CEO Gust Kepler, COO Eric Pharis, and CFO Robert Winspear presented at NobleCon18. They highlighted the increase of marketing on the platform, their mobile app, and three new products releasing in the future. A rebroadcast is available here.

    Marching the Marketing Beat.  Management noted again the good growth in users from the advertising campaign that ended last month, but again refrained from disclosing specific numbers, although we note CEO Kepler was itching to “brag” on the numbers. TV ads and other marketing efforts are planned to happen later this year, once the mobile app is ready for prime time. We believe these ads will target …


This Company Sponsored Research is provided by Noble Capital Markets, Inc., a FINRA and S.E.C. registered broker-dealer (B/D).

*Analyst certification and important disclosures included in the full report. NOTE: investment decisions should not be based upon the content of this research summary. Proper due diligence is required before making any investment decision. 


Comtech (CMTL) – NobleCon 18 Presentation Notes

Monday, April 25, 2022

Comtech (CMTL)
NobleCon 18 Presentation Notes

Comtech Telecommunications Corp. engages in the design, development, production, and marketing of products, systems, and services for advanced communications solutions in the United States and internationally. It operates in three segments: Telecommunications Transmission, Mobile Data Communications, and RF Microwave Amplifiers. The Telecommunications Transmission segment provides satellite earth station equipment and systems, over-the-horizon microwave systems, and forward error correction technology, which are used in various commercial and government applications, including backhaul of wireless and cellular traffic, broadcasting (including HDTV), IP-based communications traffic, long distance telephony, and secure defense applications. The Mobile Data Communications segment provides mobile satellite transceivers, and computers and satellite earth station network gateways and associated installation, training, and maintenance services; supplies and operates satellite packet data networks, including arranging and providing satellite capacity; and offers microsatellites and related components. The RF Microwave Amplifiers segment designs, develops, manufactures, and markets satellite earth station traveling wave tube amplifiers (TWTA) and broadband amplifiers. Its amplifiers are used in broadcast and broadband satellite communication; defense applications, such as telecommunications systems and electronic warfare systems; and commercial applications comprising oncology treatment systems, as well as to amplify signals carrying voice, video, or data for air-to-satellite-to-ground communications. The company serves satellite systems integrators, wireless and other communication service providers, broadcasters, defense contractors, military, governments, and oil companies. Comtech markets its products through independent representatives and value-added resellers. The company was founded in 1967 and is headquartered in Melville, New York.

Joe Gomes, Senior Research Analyst, Noble Capital Markets, Inc.

Joshua Zoepfel, Research Associate, Noble Capital Markets, Inc.

Refer to the full report for the price target, fundamental analysis, and rating.

    NobleCon18. Comtech Telecommunications VP of Investor Relations Robert Samuel and CFO Michael Bondi presented at NobleCon18. The company’s management highlighted two of its growing markets, the next generation 911 solutions and its satellite ground station equipment. A rebroadcast is available here.

    NG911 Highlights.  In the presentation, the Company showed an emphasis in the growth of its next-gen 911 business, highlighting that it is only one of two companies in the United States that has a 911 routing service. The acquisition pipeline in this segment remains robust according to management, and we would not count out additional acquisitions in the 911 business …


This Company Sponsored Research is provided by Noble Capital Markets, Inc., a FINRA and S.E.C. registered broker-dealer (B/D).

*Analyst certification and important disclosures included in the full report. NOTE: investment decisions should not be based upon the content of this research summary. Proper due diligence is required before making any investment decision. 


DLH (DLHC) – NobleCon 18 Presentation Notes

Monday, April 25, 2022

DLH (DLHC)
NobleCon 18 Presentation Notes

DLH Holdings Corp is a provider of technology-enabled business process outsourcing and program management solutions in the United States. The company offers services to several government agencies which include the Department of veteran affairs, Department of health and human services, Department of Defense and other government agencies. It operates primarily through prime contracts and also derives its revenue from agencies of the federal government, primarily as a prime contractor but also as a subcontractor to other Federal prime contractors.

Joe Gomes, Senior Research Analyst, Noble Capital Markets, Inc.

Joshua Zoepfel, Research Associate, Noble Capital Markets, Inc.

Refer to the full report for the price target, fundamental analysis, and rating.

    NobleCon 18. DLH Holding CFO Kathryn Johnbull presented at NobleCon18. The Company highlighted growth of their end markets and potential for expansion in the future, in our view. A rebroadcast is available here.

    Budget Growth.  Continued budget growth in government programs sets up DLH for the future, as their top three customers by revenue-DOD, HHS, and VA-have seen 1.8%, 8,5%, and 9.2% CAGRs, respectively, in their budgets from fiscal year 2019 to the 2022 presidential budget request. DLH’s pipeline exceeds $2 billion, with $800 million of proposals in process …


This Company Sponsored Research is provided by Noble Capital Markets, Inc., a FINRA and S.E.C. registered broker-dealer (B/D).

*Analyst certification and important disclosures included in the full report. NOTE: investment decisions should not be based upon the content of this research summary. Proper due diligence is required before making any investment decision. 


GABY Inc. (GABLF) – NobleCon 18 Presentation Notes

Monday, April 25, 2022

GABY Inc. (GABLF)
NobleCon 18 Presentation Notes

Gaby Inc is a wellness company that is engaged in the marketing of a variety of cannabis products, including flowers, concentrates, pre-rolls, edibles, topicals, tinctures, and other products. Some of its brands are Mankind, Sonoma Pacific, 2Rise, Lulu’s, and the Kind Republic. The company operates in two segments, namely licensed and unlicensed channels, both of which are in the manufacturing, distribution, and marketing of wellness products to address a variety of dietary and health concerns. All of its revenue comes from the United States.

Joe Gomes, Senior Research Analyst, Noble Capital Markets, Inc.

Joshua Zoepfel, Research Associate, Noble Capital Markets, Inc.

Refer to the full report for the price target, fundamental analysis, and rating.

    NobleCon 18. GABY CEO Margot Micallef presented at NobleCon18. The Company highlighted the transformation of the Company in 2021, growth opportunities and potential for expansion in the future. A rebroadcast is available here.

    Mankind-Flagship Retail Dispensary.  The Mankind dispensary is generating over $2 million in monthly revenue, with approximately 40% of monthly sales coming from curbside pickup and delivery. Mankind serves its 700 distinct cannabis products to over 27,000 monthly customers …


This Company Sponsored Research is provided by Noble Capital Markets, Inc., a FINRA and S.E.C. registered broker-dealer (B/D).

*Analyst certification and important disclosures included in the full report. NOTE: investment decisions should not be based upon the content of this research summary. Proper due diligence is required before making any investment decision. 


Information Services (III) – NobleCon 18 Presentation

Monday, April 25, 2022

Information Services (III)
NobleCon 18 Presentation

ISG (Information Services Group) (Nasdaq: III) is a leading global technology research and advisory firm. A trusted business partner to more than 700 clients, including more than 70 of the top 100 enterprises in the world, ISG is committed to helping corporations, public sector organizations, and service and technology providers achieve operational excellence and faster growth. The firm specializes in digital transformation services, including automation, cloud and data analytics; sourcing advisory; managed governance and risk services; network carrier services; strategy and operations design; change management; market intelligence and technology research and analysis. Founded in 2006, and based in Stamford, Conn., ISG employs more than 1,300 digital-ready professionals operating in more than 20 countries—a global team known for its innovative thinking, market influence, deep industry and technology expertise, and world-class research and analytical capabilities based on the industry’s most comprehensive marketplace data. For more information, visit www.isg-one.com

Joe Gomes, Senior Research Analyst, Noble Capital Markets, Inc.

Joshua Zoepfel, Research Associate, Noble Capital Markets, Inc.

Refer to the full report for the price target, fundamental analysis, and rating.

    NobleCon 18. ISG CEO Michael Connors and CFO Bert Alfonso presented at NobleCon18. The transformation of the Company during COVID, ISG NEXT, and potential for acquisitions were highlighted in the presentation. A rebroadcast is available here.

    A Changing Model.  The COVID environment gave ISG the ability to transform the business towards two different segments, ISG Digital and ISG Enterprise, which gave companies the ability to choose which solution is needed, whether it is for more data analytics and cyber security (Digital) or Human Resources and Accounting (Enterprise). Combined with the iFlex working structure, ISG transformed the …


This Company Sponsored Research is provided by Noble Capital Markets, Inc., a FINRA and S.E.C. registered broker-dealer (B/D).

*Analyst certification and important disclosures included in the full report. NOTE: investment decisions should not be based upon the content of this research summary. Proper due diligence is required before making any investment decision. 


Item 9 Labs (INLB) – Notes from NobleCon18

Monday, April 25, 2022

Item 9 Labs (INLB)
Notes from NobleCon18

Item 9 Labs Corp. (OTCQX: INLB) is a vertically integrated cannabis operator and dispensary franchisor delivering premium products from its large-scale cultivation and production facilities in the United States. The award-winning Item 9 Labs brand specializes in best-in-class products and user experience across several cannabis categories. The company also offers a unique dispensary franchise model through the national Unity Rd. retail brand. Easing barriers to entry, the franchise provides an opportunity for both new and existing dispensary owners to leverage the knowledge, resources, and ongoing support needed to thrive in their state compliantly and successfully. Item 9 Labs brings the best industry practices to markets nationwide through distinctive retail experience, cultivation capabilities, and product innovation. The veteran management team combines a diverse skill set with deep experience in the cannabis sector, franchising, and the capital markets to lead a new generation of public cannabis companies that provide transparency, consistency, and well-being. Headquartered in Arizona, the company is currently expanding its operations space by 650,000+ square feet on its 50-acre site, one of the largest properties in Arizona zoned to grow and cultivate flower. For additional information, visit item9labscorp.com.

Joe Gomes, Senior Research Analyst, Noble Capital Markets, Inc.

Joshua Zoepfel, Research Associate, Noble Capital Markets, Inc.

Refer to the full report for the price target, fundamental analysis, and rating.

    NobleCon 18. Item 9 Labs CFO Bobby Mikkelsen presented at NobleCon18. The Company’s franchising strategy and expansion were the main focus of the presentation. A rebroadcast is available here.

    Reg.  A Recap. Recall that in March of 2022, Item 9 Labs launched a regulation A offering of 28 million units of one share and one-half warrant, with a maximum proceed of $67.2 million. Management highlighted this offering in their presentation with the purpose of expanding the Unity Rd. franchise national footprint and growing the product into new markets, similarly to their expansion into New …


This Company Sponsored Research is provided by Noble Capital Markets, Inc., a FINRA and S.E.C. registered broker-dealer (B/D).

*Analyst certification and important disclosures included in the full report. NOTE: investment decisions should not be based upon the content of this research summary. Proper due diligence is required before making any investment decision. 


One Stop Systems (OSS) – Notes from the NobleCon 18 Presentation

Monday, April 25, 2022

One Stop Systems (OSS)
Notes from the NobleCon 18 Presentation

One Stop Systems Inc is US-based company which is principally engaged in designing, manufacturing, marketing high-end systems for high performance computing (HPC) applications. The company offers custom servers, compute accelerators, solid-state storage arrays and system expansion systems. The product line of the company includes GPU Appliances, GPU Expansion, GPUs and co-processors, Flash storage arrays, Flash storage expansion, Servers, Disk Arrays, Desktop computing appliances, accessories and parts. The company delivers high-end technology to customers through the sale of equipment and software for use on their premises or through remote cloud access to secure data centres housing technology.

Joe Gomes, Senior Research Analyst, Noble Capital Markets, Inc.

Joshua Zoepfel, Research Associate, Noble Capital Markets, Inc.

Refer to the full report for the price target, fundamental analysis, and rating.

    NobleCon 18. One Stop Systems CEO David Raun and CFO John Morrison were hosted by us at NobleCon18. The major highlight from the presentation was their strategy in edge computing, particularly in AI Transportables. A rebroadcast is available here.

    A Growing Market.  Global Edge Computing is estimated to grow at a 38.4% CAGR to $61.1 billion in 2028 from the reported $6.3 billion in 2021. Alongside this, an estimated 75% of data processed will be through edge computing vs. 10% in 2018. This increase in data will help the Company, in our view, as the ever-growing amount of data in various industries will need to be processed in real-time …


This Company Sponsored Research is provided by Noble Capital Markets, Inc., a FINRA and S.E.C. registered broker-dealer (B/D).

*Analyst certification and important disclosures included in the full report. NOTE: investment decisions should not be based upon the content of this research summary. Proper due diligence is required before making any investment decision. 


What Is a Tender Offer


Placing a Bid to Own a Public Company


A tender offer is a bid to purchase some or all the shares in a corporation. Most often these bids are a public invitation for shareholders to sell their positions to the bidding party, at a specified price, within a set timeframe.  As an inducement, the price offered is generally higher than the current market price. The offer is most often reliant on a minimum number of shares tendered, for example, 51% of outstanding to allow control.

A common variation of this is an exchange offer. This is a non-cash type of tender offer in which securities or other non-cash alternatives are offered in exchange for shares. When one company acquires another, it often does a share exchange in an exchange offer tender.

A publicly-traded company may present a tender offer for its own publicly held shares to either take themselves private or to reduce shares in the public’s hands and increase those in the corporation’s treasury.

Tender offers to acquire a company without the Board of Directors’ approval can be considered a hostile takeover. Hostile takeover acquirers in the past have included hedge funds, private equity firms, management-led investor groups, SPACs, and more recently a wealthy entrepreneur (Elon Musk).


Suggested Reading


Why Investors Monitor the Yield Curve and Yield Curve Changes


Why a Growing or Shrinking Fed Balance Sheet Can Impact Your Investments


Stay up to date. Follow us:


Release – NABs Leadership Foundation Selects Five Gray Television Stations As Finalists for 2022 Service to America Awards


NAB’s Leadership Foundation Selects Five Gray Television Stations As Finalists for 2022 Service to America Awards

Research, News, and Market Data on Gray Television


ATLANTA, April 21, 2022 (GLOBE NEWSWIRE) — The National Association of Broadcasters Leadership Foundation (“NABLF”) selected five television stations owned by Gray Television, Inc. (NYSE: GTN) as finalists for this year’s coveted Service to America Awards. The NABLF’s Service to America Awards recognize outstanding community service by local broadcasters and selects local radio and television stations and one group owner each year for their exemplary service to their communities. The winners in each category will be announced at an in-person gala in Washington, DC, on June 7, 2022.

In the Medium Market category, all three of the finalists selected by NABLF are Gray Television stations:

  • WMTV-TV (NBC) in Madison, Wisconsin, for its series “WMTV Diaper Drive Success”
  • WIS-TV (NBC) in Columbia, South Carolina, for its series “Families Helping Families;” and
  • WTOC-TV (CBS) in Savannah, Georgia, for its series “WTOC Tells Smart Women’s Stories and helps raise $139K to Fight Breast Cancer.”

In the Small Market category, two of the three finalists selected by NABLF are Gray Television stations:

  • WBNG-TV (CBS) in Binghamton, New York, for its series “WBNG Southern Tier Tuesdays;” and
  • KWQC-TV (NBC) in Davenport, Iowa, for its series “TV6 Real Conversations.”

“We are very proud of the great journalism across our company and industry that leads to actual results that improve local communities,” said Gray Executive Chairman and CEO Hilton H. Howell Jr. “We salute all of our honorees and especially the Gray Television stations for their continued commitment to quality journalism.”

About Gray:

Gray Television, Inc. is a multimedia company headquartered in Atlanta, Georgia. We are the nation’s largest owner of top-rated local television stations and digital assets in the United States that serve 113 television markets reaching approximately 36 percent of US television households. This portfolio includes 80 markets with the top-rated television station and 100 markets with the first and/or second highest rated television station. We also own video program companies Raycom Sports, Tupelo Honey, and PowerNation Studios, as well as Third Rail Studios.


Contact Data

Gray Contacts:

Website: www.gray.tv
Bob Smith, Chief Operating Officer, 404-266-8333
Kevin P. Latek, Chief Legal and Development Officer, 404-266-8333

The Risky Position Elon Musk is Placing Himself In


Image: Daniel Oberhaus (Flickr)


What Would Failure Look Like to Elon Musk if He Buys Twitter?


Elon Musk is a winner. We witness his success daily, after all, he’s the richest person in the world. No one else can say that right now. But the challenges that took the South African-born immigrant from poor college student to his current status were not a straight line. And, taking over Twitter won’t be a sure win either, yet he is betting a lot of his previous financial success on his ability to acquire it and run it successfully.

As innovative, crafty and wealthy as Musk is, this potential acquisition of the social media giant, may put him in a political arena like he has never experienced before. Musk could find himself in a “deathmatch” with those that control the rules – in the ring with some that have been powerful enough to shape the version of Twitter that he is now trying to steer back toward inclusion.


Buying Twitter is not the Win

“Failure is an option here. If things are not failing you are not innovating.” – Elon Musk

The above Elon Musk quote was said prior to 2022. But, it is helpful to understand; he thrives on the challenge of doing things different, trying to do things that are meaningful. While many Elon fans are watching and expecting this larger-than-life person to handily succeed, he’s human and this deal must make him somewhat uncomfortable.

For Elon, success in buying Twitter, a company that had already reached a valuation well above his bid, is not the win. Transforming and re-innovating Twitter, against the wishes of many senior department heads, and against many political interests, is the ultimate goal. This could become a nightmare, after all, successfully sending a reusable rocket round trip into space is just physics, going against the grain of powerful people that want you to fail, goes beyond physics. It may present unseen, non-science challenges.


The Risk

Self-made billionaires don’t reach that category by depositing their paycheck into a JP Morgan Chase bank account to earn .01%. They get it by risking a great deal, by hiring the right team, putting in the necessary work, and maybe getting some breaks along the way. This is the largest acquisition financing ever by one person. It’s not chump change for Elon who is doing it his own unique way. He’s a proven manager, but he’ll be spreading himself thinner if he buys Twitter. And, may not find he is getting too many breaks from those in power positions.

More than two-thirds of the $46.5 billion financing package that Musk unveiled on Thursday (April 21) for his bid for Twitter would come from his own assets, the remainder would come from bank loans secured against Twitter’s assets. Typically, the majority of a buyout of this magnitude is funded by securing most of the debt against the acquired. Elon is taking two-thirds of the “lien” himself.

The banks approached showed concern that the regulators may reprimand them because of the size of the risk they would be putting on their balance sheet. The lack of cash flow from Twitter also created concern. They may have also been troubled that the would-be acquirer said he doesn’t care about the economics of the deal “at all.” Musk said that he was pursuing the acquisition because it was “extremely important to the future of civilization.”

The banks may have also pondered that Musk has suggested that he may move Twitter away from advertising, Twitter relies on ads for the majority of its revenue.

What amplifies the challenge for Tesla’s CEO is he has agreed to take out a $12.5 billion margin loan, secured against his Tesla (TSLA) stock to pay for a portion of the $33.5 billion. Were Tesla’s stock to drop by 40%, he would have to repay that margin loan, according to a regulatory filing.


The Twitter Side

Musk is the world’s richest person, with a net worth listed by Forbes of $270 billion. Yet most of his wealth is tied up in Tesla shares, and the proposed deal structure would dry up most of his available liquidity. Twitter’s board plans to ask Musk to provide more details on the source of the cash he has promised to deliver, according to people familiar with the matter.

Twitter’s board is preparing to reject Musk’s bid as too low by April 28, when the company is scheduled to report first-quarter earnings, sources have said.

Musk, who has amassed a stake in Twitter of 9.2%, said on Wednesday he’d be exploring taking a bid directly to Twitter’s shareholders via a tender
offer
. In that scenario, shareholders would not be able to sell their shares, because of the poison pill Twitter created. The shareholders would however be able to register their support for Musk’s bid.

Paul Hoffman

Managing Editor, Channelchek


Suggested Reading


Why Poison Pills Have Been Effective at Warding off Unsolicited Offers


Jack Dorsey, Corporate Boards, and Bad Apples


As Dorsey’s Tweet Exemplifies, NFT Market is Still Maturing


Placing a Bid to Own a Public Company


Sources

https://www.chase.com/content/dam/chase-ux/ratesheets/pdfs/rdny1.pdf

https://www.inc.com/alyssa-satara/in-2-sentences-elon-musk-explains-why-key-to-success-is-failure.html.

https://www.reuters.com/business/musk-tears-up-buyout-playbook-with-465-bln-twitter-financing-2022-04-22/


Stay up to date. Follow us:


Reading the Metaverses Virtual Fine Print


Image Credit: Duncan Rawlinson (Flickr)


Can You Truly Own Anything in the Metaverse? A Law Professor Explains How Blockchains and NFTs Don’t Protect Virtual Property


In 2021, an investment firm bought 2,000 acres of real estate for about US$4 million. Normally this would not make headlines, but in this case the land was virtual. It existed only in a metaverse platform called The Sandbox. By buying 792 non-fungible tokens on the Ethereum blockchain, the firm then owned the equivalent of 1,200 city blocks.

But did it? It turns out that legal ownership in the metaverse is not that simple.

The prevailing but legally problematic narrative among crypto enthusiasts is that NFTs allow true ownership of digital items in the metaverse for two reasons: decentralization and interoperability. These two technological features have led some to claim that tokens provide indisputable proof of ownership, which can be used across various metaverse apps, environments and games. Because of this decentralization, some also claim that buying and selling virtual items can be done on the blockchain itself for whatever price you want, without any person or any company’s permission.


This article was republished with permission from The Conversation, a news site dedicated to sharing ideas from academic experts. It was written by and represents the research-based opinions of João Marinotti, Associate Professor of Law, Indiana University.


Despite these claims, the legal status of virtual “owners” is significantly more complicated. In fact, the current ownership of metaverse assets is not governed by property law at all, but rather by contract law. As a legal scholar who studies property law, tech policy and legal ownership, I believe that what many companies are calling “ownership” in the metaverse is not the same as ownership in the physical world, and consumers are at risk of being swindled.


Purchasing in the Metaverse

When you buy an item in the metaverse, your purchase is recorded in a transaction on a blockchain, which is a digital ledger under nobody’s control and in which transaction records cannot be deleted or altered. Your purchase assigns you ownership of an NFT, which is simply a unique string of bits. You store the NFT in a crypto wallet that only you can open, and which you “carry” with you wherever you go in the metaverse. Each NFT is linked to a particular virtual item.

It is easy to think that because your NFT is in your crypto wallet, no one can take your NFT-backed virtual apartment, outfit or magic wand away from you without access to your wallet’s private key. Because of this, many people think that the NFT and the digital item are one and the same. Even experts conflate NFTs with their respective digital goods, noting that because NFTs are personal property, they allow you to own digital goods in a virtual world.

However, when you join a metaverse platform you must first agree to the platform’s terms of service, terms of use or end user license agreement. These are legally binding documents that define the rights and duties of the users and the metaverse platform. Unfortunately, and unsurprisingly, almost no one actually reads the terms of service. In one study, only 1.7% of users found and questioned a “child assignment clause” embedded in a terms of service document. Everyone else unwittingly gave away their first-born child to the fictional online service provider.

It is in these lengthy and sometimes incomprehensible documents where metaverse platforms spell out the legal nuances of virtual ownership. Unlike the blockchain itself, the terms of service for each metaverse platform are centralized and are under the complete control of a single company. This is extremely problematic for legal ownership.

Interoperability and portability are defining features of the metaverse, meaning you should be able to carry your non-real-estate virtual property – your avatar, your digital art, your magic wand – from one virtual world to another. But today’s virtual worlds are not connected to one another, and there is nothing in an NFT itself that labels it as, say, a magic wand. As it stands, each platform needs to link NFTs to their own proprietary digital assets.


Virtual Fine Print

Under the terms of service, the NFTs purchased and the digital goods received are almost never one and the same. NFTs exist on the blockchain. The land, goods and characters in the metaverse, on the other hand, exist on private servers running proprietary code with secured, inaccessible databases.

This means that all visual and functional aspects of digital assets – the very features that give them any value – are not on the blockchain at all. These features are completely controlled by the private metaverse platforms and are subject to their unilateral control.

Because of their terms of service, platforms can even legally delete or give your items away by delinking the digital assets from their original NFT identification codes. Ultimately, even though you may own the NFT that came with your digital purchase, you do not legally own or possess the digital assets themselves. Instead, the platforms merely grant you access to the digital assets and only for the length of time they want.

For example, on one day you might own a $200,000 digital painting for your apartment in the metaverse, and the next day you may find yourself banned from the metaverse platform, and your painting, which was originally stored in its proprietary databases, deleted. Strictly speaking, you would still own the NFT on the blockchain with its original identification code, but it is now functionally useless and financially worthless.

Virtual
items like this avatar are sold in NFT marketplaces. Nescolet/Flickr

While admittedly jarring, this is not a far-fetched scenario. It might not be a wise business move for the platform company, but there’s nothing in the law to prevent it. Under the terms of use and premium NFT terms of use governing the $4 million’s worth of virtual real estate purchased on The Sandbox, the metaverse company – like many other NFT and metaverse platforms – reserves the right at its sole discretion to terminate your ability to use or even access your purchased digital assets.

If The Sandbox “reasonably believes” you engaged in any of the platform’s prohibited activities, which require subjective judgments about whether you interfered with others’ “enjoyment” of the platform, it may immediately suspend or terminate your user account and delete your NFT’s images and descriptions from its platform. It can do this without any notice or liability to you.

In fact, The Sandbox even claims the right in these cases to immediately confiscate any NFTs it deems you acquired as a result of the prohibited activities. How it would successfully confiscate blockchain-based NFTs is a technological mystery, but this raises further questions about the validity of what it calls virtual ownership.


Legally Binding

As if these clauses weren’t alarming enough, many metaverse platforms reserve the right to amend their terms of service at any time with little to no actual notice. This means that users would need to constantly refresh and reread the terms to ensure they do not engage in any recently banned behavior that could result in the deletion of their “purchased” assets or even their entire accounts.


Suggested Reading


Why the Metaverse is Attracting Traditional Professions


The Metaverse vs Virtual Reality, Two Different Worlds


NobleCon18 Brought Media Experts Together to Discuss the Metaverse, Here’s What Happened


Why the Metaverse Matters


Stay up to date. Follow us: