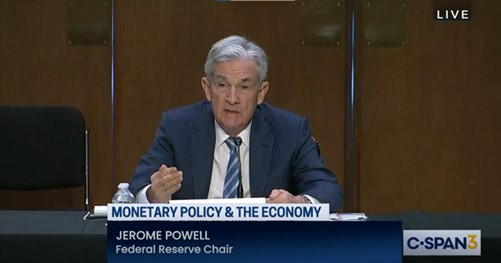
Image Credit: C-Span
Powell Caught Between Competing Political Agendas and Economic Reality
Twice a year, the head of the Federal Reserve goes before the Committee on Banking, Housing, and Urban Affairs, of the U.S. Senate. The Chair delivers prepared remarks and then answers questions from members of the attending committees. Over the years, the Fed has gone from tightly guarding monetary policy plans to being as transparent as possible. In either case, as the nation’s top economist, they know if they say one wrong word during questioning, there can be significant shifts in the markets, and changes in all-around confidence globally. It’s perilous, and the challenge is even greater as they are economists that understand their role at a very high level, but they are taking questions from politicians that may have other priorities.
Chair Powell spoke about the overall economy, monetary policy, inflation, recession, and the terminal rate, or the highest rate expected during this tightening cycle. He was unequivocal in his resolve to bring down inflation. In his opening remarks he began with, “At the Fed, we understand the hardship high inflation is causing. We are strongly committed to bringing inflation back down, and we are moving expeditiously to do so. We have both the tools we need and the resolve it will take to restore price stability on behalf of American families and businesses. It is essential that we bring inflation down if we are to have a sustained period of strong labor market conditions that benefit all.”
The Federal Reserve Chair believes it is possible to effectively reel in inflaton without entering a recession, but it became clear through the question and answer session that he would allow a recession if that is the solution to the inflation battle.
Overall Economy
Inflation remains well above the Fed’s longer-run goal of a modest 2%. In the 12 months ending April 2022, Powell pointed out that inflation, as measured by the PCE deflator, rose 6.3 percent. He indicated he believes the pace has held and that consumer demand is strong. The supply problems he admitted have been larger and longer-lasting than expected. He also noted that price pressures have spread to a broad range of goods and services. The surge in crude oil prices and other commodities from Russia’s invasion of Ukraine is also boosting prices for fuel and is placing even greater upward pressure on inflation.
Additionally, new Covid-19-related lockdowns in China will add to global supply problems. Powell pointed out that the U.S. is not alone in dealing with inflation, prices also increased rapidly in many foreign economies.
He believes GDP measured growth which was negative over the first quarter has picked up during the second quarter. Consumption spending remains strong, and the job market is on firm ground. He said he sees signs of business fixed investment slowing, and activity in housing softening. These were not characterized as bad during his testimony as tempered demand can better match supply and lead to a sustainable balance.
The Fed takes particular comfort with strong labor markets, it gives them room to work. The unemployment rate is near a 50-year low, job vacancies are at historical highs, and hourly earnings are up. Labor demand is very strong, while labor supply remains subdued, with the labor force participation rate little changed since January.
Monetary Policy
The Fed’s monetary policy actions are guided by its mandate to promote maximum employment and stable prices in the U.S. economy. Fed Powell said in his prepared remarks, “My colleagues and I are acutely aware that high inflation imposes significant hardship, especially on those least able to meet the higher costs of essentials like food, housing, and transportation. We are highly attentive to the risks high inflation poses to both sides of our mandate, and we are strongly committed to returning inflation to our 2 percent objective.”

In orchestrating lower inflation The Fed chair said he expects further rate increases will be appropriate, and the pace of the increases will depend on incoming data and outlook. During the last FOMC meeting, the Fed hiked the overnight lending rate by .75%, this was higher than earlier Fed guidance, it is presumed that increasing inflation conditions drove the higher than foretold increase. It sounds as though Powell is warning that they will continue to do what’s appropriate when they feel it’s appropriate — situations change.
“Setting appropriate monetary policy in this uncertain environment requires a recognition that the economy often evolves in unexpected ways. Inflation has obviously surprised to the upside over the past year, and further surprises could be in store. We, therefore, will need to be nimble in responding to incoming data and the evolving outlook. And we will strive to avoid adding uncertainty in what is already an extraordinarily challenging and uncertain time. We are highly attentive to inflation risks and determined to take the measures necessary to restore price stability. The American economy is very strong and well-positioned to handle tighter monetary policy,” Powell said in opening remarks.
Inflation
The Federal Reserve Chair believes it is possible to effectively reel in inflation without entering a recession, but it became clear through the question and answer session that the Fed places inflation concerns and the impact on the economy, ahead of recession risks.
As part of the discussion, members of Congress, especially those with more conservative leanings, hammered the inflation issue, pointing to stimulus spending sanctioned by the White House, and energy decisions that have reduced supply. Conservative members of the Senate also criticized the Fed for delaying drastic action on curbing inflation.
Other members of Congress dwelled more on outside issues that have impacted inflation and asked whether interest rates could have an impact on the increasing price of food, and energy. “A Fed increase won’t bring down these prices,” said Sen. Elizabeth Warren. “And why? Because rate hikes won’t make Vladimir Putin turn his tanks around and leave Ukraine. Rate hikes won’t break up monopolies, rate hikes won’t straighten out the supply chain or speed up ships or stop a virus that is still causing lockdowns in some parts of the world.”
Powell doesn’t believe the economy has “seen the full effect” of Covid-19 lockdowns.
Recession
Some members of Congress see a political advantage in faster monetary-policy tightening. For some, a more hawkish Fed up front could put out the fire sooner and reduce damage from inflation. This would likely mean an upfront recession. For those that can’t resist viewing any activity as political, the November mid-term elections may be won or lost on the pace of the economy and the rate of inflation. The party in power in both Congress and the White House would not benefit from rising rates and a weakening economy.
For Powell’s part, what is most telling is that he did not seem overly concerned about the risk of slower or negative economic growth. He continued to emphasize inflation, fighting the price increases, and doing everything possible to avoid prolonged weakness while prioritizing bringing inflation down to a 2% target.
Terminal Rate
At Wednesday’s testimony, Powell estimated the longer-run neutral rate for Fed funds should be about 2.5%. He also continued to emphasize that in his estimate it would be appropriate to raise rates to a restrictive level to curb inflation. There was some talk about the Taylor Rule, which is a theoretical formula that suggests the Fed should adjust overnight rates by an amount equivalent to the spread between measured inflation and the desired inflation rate (presumed to be 2%). To this, the Fed’s Chair indicated that economics is more of an art than science. The current situation according to Powell is unique and has its own dynamics that include the war in Ukraine supply issues, Covid-19 lockdown effects, and stock and bond markets that benefitted from injections to stimulate during the pandemic.
Managing Editor, Channelchek
Suggested Content
 The Soft Landing Challenge, Fed Chairman Makes No Promises
|
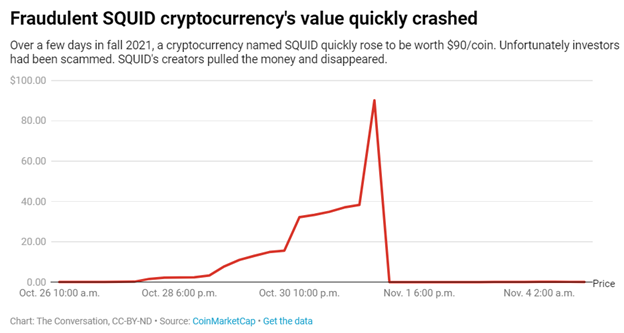
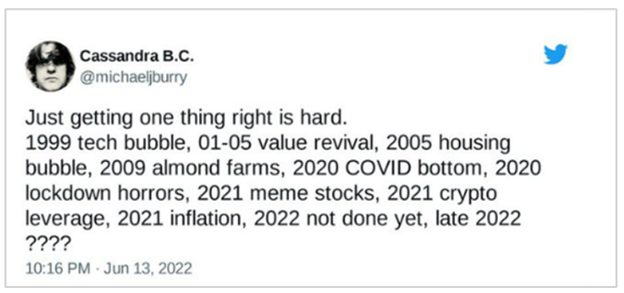
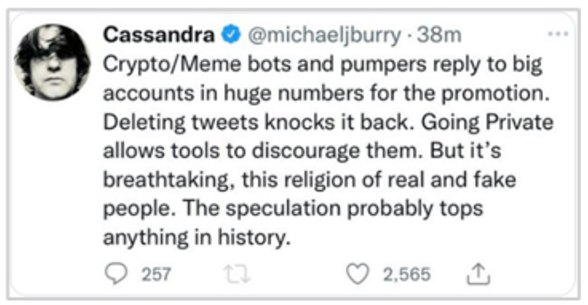
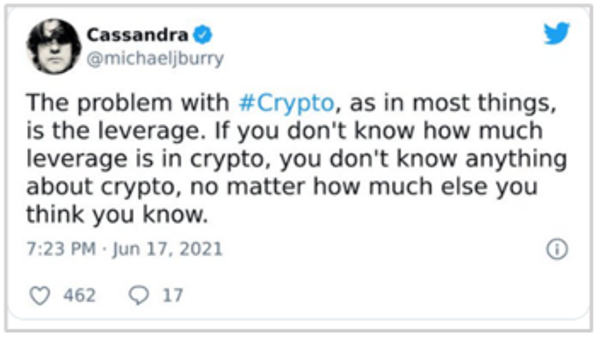
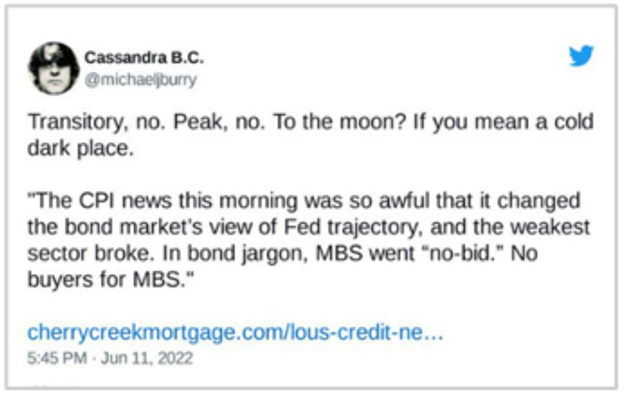
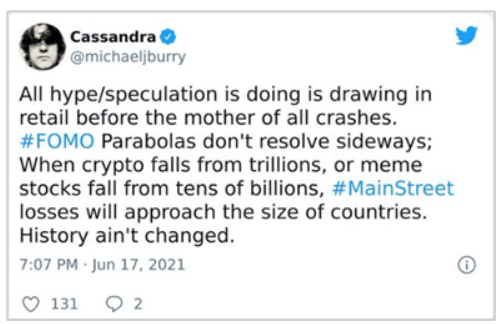
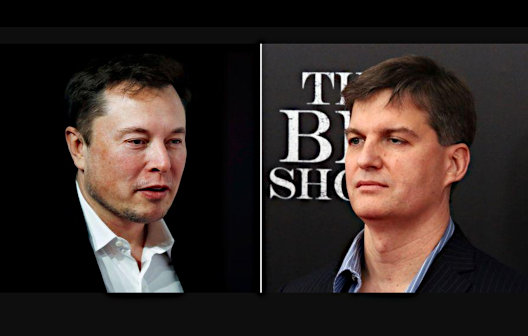
 Michael Burry is Predicting More Red
|
 Michael Burry is Predicting More Red
|
 Five Things to Know About the Fed’s Interest Rate Increase and How it Will Affect You
|
https://www.federalreserve.gov/newsevents/testimony/powell20220622a.htm
www.investopedia.com/terms/t/taylorsrule.asp
Stay up to date. Follow us:

|


