Image Credit: Kent Dayton (MIT News Office)
Ultrathin Fuel Cell Uses the Body’s Own Sugar to Generate Electricity
Jennifer Chu | MIT News
Office
Glucose is the sugar we absorb from the foods we eat. It is the fuel that powers every cell in our bodies. Could glucose also power tomorrow’s medical implants?
Engineers at MIT and the Technical University of Munich think so. They have designed a new kind of glucose fuel cell that converts glucose directly into electricity. The device is smaller than other proposed glucose fuel cells, measuring just 400 nanometers thick, or about 1/100 the diameter of a human hair. The sugary power source generates about 43 microwatts per square centimeter of electricity, achieving the highest power density of any glucose fuel cell to date under ambient conditions.
The new device is also resilient, able to withstand temperatures up to 600 degrees Celsius. If incorporated into a medical implant, the fuel cell could remain stable through the high-temperature sterilization process required for all implantable devices.
The heart of the new device is made from ceramic, a material that retains its electrochemical properties even at high temperatures and miniature scales. The researchers envision the new design could be made into ultrathin films or coatings and wrapped around implants to passively power electronics, using the body’s abundant glucose supply.
“Glucose is everywhere in the body, and the idea is to harvest this readily available energy and use it to power implantable devices,” says Philipp Simons, who developed the design as part of his PhD thesis in MIT’s Department of Materials Science and Engineering (DMSE). “In our work we show a new glucose fuel cell electrochemistry.”
“Instead of using a battery, which can take up 90 percent of an implant’s volume, you could make a device with a thin film, and you’d have a power source with no volumetric footprint,” says Jennifer L.M. Rupp, Simons’ thesis supervisor and a DMSE visiting professor, who is also an associate professor of solid-state electrolyte chemistry at Technical University Munich in Germany.
A “Hard” Separation
The inspiration for the new fuel cell came in 2016, when Rupp, who specializes in ceramics and electrochemical devices, went to take a routine glucose test toward the end of her pregnancy.
“In the doctor’s office, I was a very bored electrochemist, thinking what you could do with sugar and electrochemistry,” Rupp recalls. “Then I realized, it would be good to have a glucose-powered solid state device. And Philipp and I met over coffee and wrote out on a napkin the first drawings.”
The team is not the first to conceive of a glucose fuel cell, which was initially introduced in the 1960s and showed potential for converting glucose’s chemical energy into electrical energy. But glucose fuel cells at the time were based on soft polymers and were quickly eclipsed by lithium-iodide batteries, which would become the standard power source for medical implants, most notably the cardiac pacemaker.
However, batteries have a limit to how small they can be made, as their design requires the physical capacity to store energy.
“Fuel cells directly convert energy rather than storing it in a device, so you don’t need all that volume that’s required to store energy in a battery,” Rupp says.
In recent years, scientists have taken another look at glucose fuel cells as potentially smaller power sources, fueled directly by the body’s abundant glucose.

A glucose fuel cell’s basic design consists of three layers: a top anode, a middle electrolyte, and a bottom cathode. The anode reacts with glucose in bodily fluids, transforming the sugar into gluconic acid. This electrochemical conversion releases a pair of protons and a pair of electrons. The middle electrolyte acts to separate the protons from the electrons, conducting the protons through the fuel cell, where they combine with air to form molecules of water — a harmless byproduct that flows away with the body’s fluid. Meanwhile, the isolated electrons flow to an external circuit, where they can be used to power an electronic device.
The team looked to improve on existing materials and designs by modifying the electrolyte layer, which is often made from polymers. But polymer properties, along with their ability to conduct protons, easily degrade at high temperatures, are difficult to retain when scaled down to the dimension of nanometers, and are hard to sterilize. The researchers wondered if a ceramic — a heat-resistant material which can naturally conduct protons — could be made into an electrolyte for glucose fuel cells.
“When you think of ceramics for such a glucose fuel cell, they have the advantage of long-term stability, small scalability, and silicon chip integration,” Rupp notes. “They’re hard and robust.”
Peak Power
The researchers designed a glucose fuel cell with an electrolyte made from ceria, a ceramic material that possesses high ion conductivity, is mechanically robust, and as such, is widely used as an electrolyte in hydrogen fuel cells. It has also been shown to be biocompatible.
“Ceria is actively studied in the cancer research community,” Simons notes. “It’s also similar to zirconia, which is used in tooth implants, and is biocompatible and safe.”
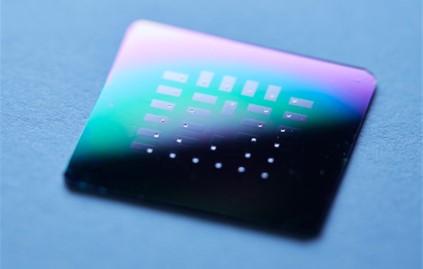
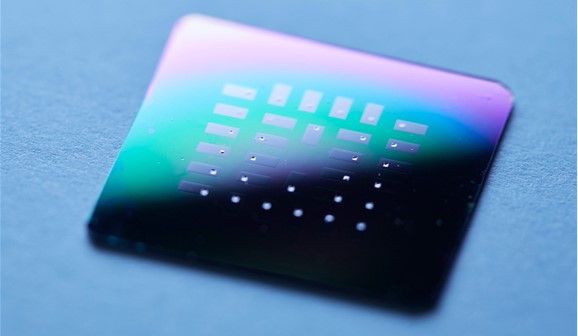
The team sandwiched the electrolyte with an anode and cathode made of platinum, a stable material that readily reacts with glucose. They fabricated 150 individual glucose fuel cells on a chip, each about 400 nanometers thin, and about 300 micrometers wide (about the width of 30 human hairs). They patterned the cells onto silicon wafers, showing that the devices can be paired with a common semiconductor material. They then measured the current produced by each cell as they flowed a solution of glucose over each wafer in a custom-fabricated test station.
They found many cells produced a peak voltage of about 80 millivolts. Given the tiny size of each cell, this output is the highest power density of any existing glucose fuel cell design.
“Excitingly, we are able to draw power and current that’s sufficient to power implantable devices,” Simons says.
“It is the first time that proton conduction in electroceramic materials can be used for glucose-to-power conversion, defining a new type of electrochemstry,” Rupp says. “It extends the material use-cases from hydrogen fuel cells to new, exciting glucose-conversion modes.”
The researchers “have opened a new route to miniature power sources for implanted sensors and maybe other functions,” says Truls Norby, a professor of chemistry at the University of Oslo in Norway, who did not contribute to the work. “The ceramics used are nontoxic, cheap, and not least inert both to the conditions in the body and to conditions of sterilization prior to implantation. The concept and demonstration so far are promising indeed.”
Reprinted with permission of MIT News (http://news.mit.edu/)
Suggested Reading
 Baudax Bio (BXRX) NobleCon18 Presentation Replay
|
 BioSig Technologies (BSGM) NobleCon18 Presentation Replay
|
 Cocrystal Pharma (COCP) NobleCon18 Presentation Replay
|
 Genprex (GNPX) NobleCon18 Presentation Replay
|
Stay up to date. Follow us:

|