|
|
|
Noble Capital Markets Senior Research Analyst Mark Reichman sits down with Maple Gold Mines (MGMLF)(MGM.V) President & CEO Matthew Hornor Research, News, and Advanced Market Data on MGMLFView all C-Suite InterviewsThe 2022 C-Suite Interview series is now available on major podcast platforms
About Maple Gold Maple Gold Mines Ltd. is a Canadian advanced exploration company in a 50/50 joint venture with Agnico Eagle Mines Limited to jointly advance the district-scale Douay and Joutel gold projects located in Quebec’s prolific Abitibi Greenstone Gold Belt. The projects benefit from exceptional infrastructure access and boast ~400 km2 of highly prospective ground including an established gold resource at Douay (SLR 2022) that holds significant expansion potential as well as the past-producing Eagle, Telbel and Eagle West mines at Joutel. In addition, the Company holds an exclusive option to acquire 100% of the Eagle Mine Property. The district-scale property package also hosts a significant number of regional exploration targets along a 55 km strike length of the Casa Berardi Deformation Zone that have yet to be tested through drilling, making the project ripe for new gold and polymetallic discoveries. The Company is well capitalized and is currently focused on carrying out exploration and drill programs to grow resources and make new discoveries to establish an exciting new gold district in the heart of the Abitibi. For more information, please visit www.maplegoldmines.com. |
Category:
Release – Bunker Hill Announces $15 Million Convertible Debt Financing
![]()
Bunker Hill Announces Appointment Of General Manager And Secures Mining Contractor
News and Market Data on Bunker Hill Mining
Bunker Hill Announces $15 Million Convertible Debt FinancingBunker Hill to Host Live Interactive 6ix Summit on Wednesday, June 22 @ 2:00pm ET / 11:00am PT TORONTO, June 20, 2022 – Bunker Hill Mining Corp. (the “Company”) (CSE: BNKR; OTCQB: BHLL) is pleased to announce the execution and closing of a new $15 million convertible debenture financing (the “Series 2 Convertible Debentures”) with Sprott Private Resources Streaming & Royalty Corp. (“SRSR” or “Sprott”). All figures in this news release are in US dollars unless otherwise stated. Sam Ash, CEO, stated “We are very pleased to announce this new $15 million financing, representing an increase in our project finance package with Sprott to $66 million. Together with our recent equity raise, this materially improves our working capital position, enables us to meet our financial assurance obligations with the EPA, and funds several key workstreams over the coming months including completion of the underground decline, demobilization of the Pend Oreille mill, and further engineering optimization in preparation for the mine restart.” Investors are invited to register for the live interactive 6ix Summit at: CONVERTIBLE DEBENTURE The Series 2 Convertible Debentures bear interest at an annual rate of 10.5%, payable in cash or shares at the Company’s option, and mature on March 31, 2025. Repayments of $2 million shall be made at the end of each calendar quarter, starting on 30 June 2024, with the remaining $9 million due on March 31, 2025. The Series 2 Convertible Debentures are convertible into shares of the Company at a share price of CAD 0.29 per share until the maturity date. The Company may elect to re-pay the Convertible Debenture early; if SRSR elects not to exercise its conversion option at such time, a minimum of 12 months of interest would apply. The Series 2 Convertible Debentures will be secured by the same security package that has been put in place to secure the $8 million Royalty Convertible Debenture and the aggregate $6 million Convertible Debentures (the “Series 1 Convertible Debentures”) that closed in January 2022. The parties have also agreed to a number of changes to the previously announced project finance package of up to $51 million (of which $14 million has been advanced to date), consisting of the Royalty Convertible Debenture, Series 1 Convertible Debentures, and the Stream. Firstly, the maturity dates of the Royalty Convertible Debenture and Series 1 Convertible Debentures have been extended to March 31, 2025 (previously July 7, 2023). As previously envisaged, the Royalty Convertible Debenture will convert to a 1.85% life of mine royalty or be repaid when the Stream is advanced. However, in the event of conversion, the Company will enter into a Royalty Put Option entitling the royalty holder to resell the royalty to the Company for $8 million upon default under the Series 1 Convertible Debentures or Series 2 Convertible Debentures until such time that the Series 1 Convertible Debentures and Series 2 Convertible Debentures are paid in full. The Series 1 Convertible Debentures will remain outstanding until March 31, 2025, regardless of whether the Stream is advanced, unless the Company elects to exercise its option of early repayment. Lastly, the minimum quantity of metal delivered under the Stream, if advanced, will increase by 10% relative to amounts announced in the news release of December 20, 2021. In light of the Series 2 Convertible Debenture financing, the previously permitted additional senior secured indebtedness of up to $15 million for project finance has been removed. However, the Company and Sprott have agreed that the Company is permitted to sell an additional $5 million of the Series 2 Convertible Debentures to other investors until August 1, 2022. The net proceeds of the financing will be primarily used to satisfy the Company’s financial assurance obligations with the US Environmental Protection Agency (“EPA”) and the advancement of mine restart activities, including the completion of the underground decline, demobilization of the Pend Oreille mill, and advancement of EPCM activities in anticipation of mill construction in the fourth quarter of 2022. NEXT STEPS Additional optimization opportunities have been identified as technical work on the Prefeasibility Study (“PFS”) has advanced. In order to incorporate these into the PFS, technical work is continuing and the PFS is now expected to be completed later in the third quarter of 2022. The advancement of the Stream is also expected to take place at approximately that time. While this additional technical work is in progress, development drifting will continue with an expected breakthrough into the internal ramp between the 6 and 8 levels to occur in September 2022. Relocation of the Pend Oreille Mill will continue throughout the summer with a key milestone being the disassembly and transport of the primary ball mills in August. RELATED PARTY The financing transactions described in this press release (the “Transactions”) constitute related party transactions pursuant to Multilateral Instrument 61-101 – Protection of Minority Security Holders in Special ABOUT BUNKER HILL MINING Under new Idaho-based leadership the Bunker Hill Mining Corp, intends to sustainably restart and develop the Bunker Hill Mine as the first step in consolidating a portfolio of North American precious-metal assets with a focus on silver. Information about the Company is available on its website, www.bunkerhillmining.com, or within the SEDAR and EDGAR databases. For additional David Wiens, CFA CAUTIONARY STATEMENTS Certain |
|
Contact Info: Bunker Hill Mining Corp. |
Vectrus (VEC) – Vertex Combination Approved by Shareholders

Tuesday, June 21, 2022
Vectrus (VEC)
Vertex Combination Approved by Shareholders
For more than 70 years, Vectrus has provided critical mission support for our customers’ toughest operational challenges. As a high-performing organization with exceptional talent, deep domain knowledge, a history of long-term customer relationships, and groundbreaking technical expertise, we deliver innovative, mission-matched solutions for our military and government customers worldwide. Whether it’s base operations support, supply chain and logistics, IT mission support, engineering and digital integration, security, or maintenance, repair and overhaul, our customers count on us for on-target solutions that increase efficiency, reduce costs, improve readiness, and strengthen national security. Vectrus is headquartered in Colorado Springs, Colo., and includes about 8,100 employees spanning 205 locations in 28 countries. In 2021, Vectrus generated sales of $1.8 billion. For more information, visit the company’s website at www.vectrus.com or connect with Vectrus on Facebook, Twitter, and LinkedIn.
Joe Gomes, Senior Research Analyst, Noble Capital Markets, Inc.
Joshua Zoepfel, Research Associate, Noble Capital Markets, Inc.
Refer to the full report for the price target, fundamental analysis, and rating.
Shareholder Approval. Last week, Vectrus announced that Vectrus shareholders voted to approve the combination with Vertex. With shareholder approval, the combined company will be renamed V2X, Inc, and its common stock will trade on the NYSE under a new ticker symbol, “VVX”, following the close of the transaction, which is expected to occur early in the third quarter of 2022.
Overwhelming Approval. The shareholder vote was not close. Approximately 90% of the 11,826,663 share eligible to vote, voted. Question 1, to approve the issuance of Company Common Stock as merger consideration pursuant to the Agreement and Plan of Merger dated as of March 7, 2022, received the support of 89.7% of the shares that voted. Question 2, to approve an amendment and restatement of the Articles of Incorporation of the Company to change its name to “V2X, Inc.”, received 96.0% approval of shares that voted….

This Company Sponsored Research is provided by Noble Capital Markets, Inc., a FINRA and S.E.C. registered broker-dealer (B/D).
*Analyst certification and important disclosures included in the full report. NOTE: investment decisions should not be based upon the content of this research summary. Proper due diligence is required before making any investment decision.
Maple Gold Mines (MGMLF) – Eagle Phase I Drill Results Speak for Themselves; Phase II Drilling Underway
Tuesday, June 21, 2022
Maple Gold Mines (MGMLF)
Eagle Phase I Drill Results Speak for Themselves; Phase II Drilling Underway
Mark Reichman, Senior Research Analyst, Natural Resources, Noble Capital Markets, Inc.
Refer to the full report for the price target, fundamental analysis, and rating.
Outstanding Eagle Phase I drill results. Maple Gold reported assay results from the company’s Phase I drill program at its 100%-controlled Eagle Mine Property in Quebec, Canada. The Phase I program consisted of eight diamond drill holes, representing 4,462 meters of drilling, that tested potential extensions of mineralization along the past-producing Eagle-Telbel Mine Trend. A majority of Phase I drill holes contained at least one interval with greater than 1 gram of gold per tonne, with Hole EM-22-005 intersecting 4.0 grams of gold per tonne over 7.5 meters, including 6.4 grams of gold per tonne over 3.0 meters.
Phase II drilling underway. Data collected from the Phase I drilling is guiding the ~4,000 meter Phase II drilling program which is testing the Eagle-Telbel Mine Trend at greater depths. In aggregate, management expects to reach its goal of twelve drill holes, representing 8,200 meters of drilling, by the end of the quarter….
This Company Sponsored Research is provided by Noble Capital Markets, Inc., a FINRA and S.E.C. registered broker-dealer (B/D).
*Analyst certification and important disclosures included in the full report. NOTE: investment decisions should not be based upon the content of this research summary. Proper due diligence is required before making any investment decision.
Element79 Gold Corp. (ELMGF) – Definitive Agreement to Acquire Peruvian Gold Portfolio
Tuesday, June 21, 2022
Element79 Gold Corp. (ELMGF)
Definitive Agreement to Acquire Peruvian Gold Portfolio
Element79 Gold is a mineral exploration company focused on the acquisition, exploration and development of mining properties for gold and associated metals. Element79 Gold has acquired its flagship Maverick Springs Project located in the famous gold mining district of northeastern Nevada, USA, between the Elko and White Pine Counties, where it has recently completed a 43-101-compliant, pit-constrained mineral resource estimate reflecting an Inferred resource of 3.71 million ounces of gold equivalent* “AuEq” at a grade of 0.92 g/t AuEq (0.34 g/t Au and 43.4 g/t Ag)) with an effective date of Feb. 4, 2022. The acquisition of the Maverick Springs Project also included a portfolio of 15 properties along the Battle Mountain trend in Nevada, which the Company is analyzing for further merit of exploration, along with the potential for sale or spin-out. In British Columbia, Element79 Gold has executed a Letter of Intent to acquire a private company which holds the option to 100% interest of the Snowbird High-Grade Gold Project, which consists of 10 mineral claims located in Central British Columbia, approximately 20km west of Fort St. James. In Peru, Element79 Gold has signed a letter of intent to acquire the business and assets of Calipuy Resources Inc., which holds 100% interest in the past-producing Lucero Mine, one of the highest-grade underground mines to be commercially mined in Peru’s history, as well as the past-producing Machacala Mine. The Company also has an option to acquire 100% interest in the Dale Property which consists of 90 unpatented mining claims located approximately 100 km southwest of Timmins, Ontario, Canada in the Timmins Mining Division, Dale Township.
Mark Reichman, Senior Research Analyst, Natural Resources, Noble Capital Markets, Inc.
Refer to the full report for the price target, fundamental analysis, and rating.
Definitive agreement to acquire Calipuy Resources. As anticipated, Element79 Gold Corp. executed a definitive agreement to purchase the issued and outstanding common shares of Calipuy Resources Inc. for consideration value of US$15 million. Through its subsidiaries, Calipuy holds a 100% interest in two past producing high-grade gold-silver mines in Peru, the Lucero and Machacala mines. Closing is subject to various conditions, including third-party approvals and other customary conditions.
Terms of the agreement. Upon closing, the US$15 million purchase price for the shares of Calipuy will be paid by the issuance on a pro rata basis to the shareholders of Calipuy: 1) a total of 19,165,486 common shares of the company at an issue price of CAD$1.00 per consideration share, and 2) performance bonus warrants to acquire an aggregate of 3,833,085 common shares of Element79 Gold. Issuance of consideration shares will be paid in CAD denominated shares at the agreed exchange rate of CAD$1.2777 to USD$1.00. Each performance bonus warrant is exercisable into one common share of Element79 at an exercise price of CAD$2.00 per share for a period of three years from the exercise eligibility date. Holders of the performance bonus warrants may not exercise the warrants until projects carried out on the properties have cumulatively reached a minimum production target of 9,000 tons of ore yielding a minimum of 1,500 ounces of gold within a 30-day production period. …
This Company Sponsored Research is provided by Noble Capital Markets, Inc., a FINRA and S.E.C. registered broker-dealer (B/D).
*Analyst certification and important disclosures included in the full report. NOTE: investment decisions should not be based upon the content of this research summary. Proper due diligence is required before making any investment decision.
Avivagen Inc. (VIVXF) – Waiting for Upturn in End Markets
Tuesday, June 21, 2022
Avivagen Inc. (VIVXF)
Waiting for Upturn in End Markets
Avivagen is a life sciences corporation focused on developing and commercializing products for livestock, companion animal and human applications that, by safely supporting immune function, promote general health and performance. It is a public corporation traded on the TSX Venture Exchange under the symbol VIV and is headquartered in Ottawa, Canada, based in partnership facilities of the National Research Council of Canada. For more information, visit www.avivagen.com. The contents of the website are expressly not incorporated by reference in this press release.
Joe Gomes, Senior Research Analyst, Noble Capital Markets, Inc.
Joshua Zoepfel, Research Associate, Noble Capital Markets, Inc.
Refer to the full report for the price target, fundamental analysis, and rating.
Q2 Results. Avivagen reported revenue of $88,438 (all figures are in Canadian $), down from $159,614 the prior year and below our estimate of $400,000. Net loss for the quarter was at $1.3 million or $0.02 per share, an increase over the prior year’s $2.2 million or $0.04 per share, and better than our estimate of a loss of $1.4 million or $0.03 per share. The decrease in revenue was due to lower sales of OxC-Beta, with the net loss decrease due to an adjustment on the Company’s ACOA liabilities.
Modest OxC-beta Sales. During 2Q22, Avivagen sold just 925 kilograms of OxC-beta Livestock, down from 2,550 kg in 1Q22. Nearly half, or 400 kgs, was sold in Brazil, Other sales were made in Thailand, 150 kgs, Taiwan, 350 kgs, and Mexico, 25 kgs. The average price of OxC-Beta per kilogram was $102.27 in the quarter from a previous $106.33 in 1Q22….
This Company Sponsored Research is provided by Noble Capital Markets, Inc., a FINRA and S.E.C. registered broker-dealer (B/D).
*Analyst certification and important disclosures included in the full report. NOTE: investment decisions should not be based upon the content of this research summary. Proper due diligence is required before making any investment decision.
Release – Seanergy Maritime Announces Proposed Spin-Off
![]()
Seanergy Maritime Holdings Corp. Reports First Quarter 2022 Financial Results and Declares Dividend of $0.025 Per Share
June 17, 2022 – Glyfada, Greece – Seanergy Maritime Holdings Corp. (the “Company” or “Seanergy”) (NASDAQ: SHIP) announced today that it intends to effect a spin-off of the Company’s oldest Capesize vessel, the M/V Gloriuship, through a wholly-owned subsidiary. The newly formed subsidiary, United Maritime Corporation (“United”), will act as the holding company for the M/V Gloriuship. United has applied to have its common shares listed on the Nasdaq Capital Market and is expected to adopt a diversified business model, with investments across various maritime sectors.
Seanergy is contributing the vessel-owning subsidiary of the M/V Gloriuship to United and intends to distribute all the common shares of United pro rata to the Company’s shareholders of record as of June 28, 2022, which coincides with the previously-announced record date for Seanergy’s cash dividend of $0.025 per share for the first quarter of 2022. The distribution of United common shares is expected to be made on or around July 5, 2022. United common shares are expected to commence trading on a standalone basis on the Nasdaq Capital Market on the first trading day after the date of distribution, under the ticker “USEA”.
The transaction remains subject to the registration statement on Form 20-F being declared effective and the approval of the listing of United’s common shares on the Nasdaq Capital Market. There can be no assurance that the transaction will occur or, if it does occur, of its terms or timing.
Stamatis
Tsantanis, the Company’s Chairman & Chief Executive Officer, stated:
“The spin-off of 100% of the common shares of United Maritime Corporation represents a significant return of value to our shareholders. Our board of directors believes that the distribution of shares of a separate, publicly traded shipping company that will pursue a diversified business model and greater exposure to different shipping segments will further enhance shareholder value.”
“Seanergy will continue its successful course as a pure-play Capesize owner, and we intend to substitute our oldest vessel, the Gloriuship, with a younger Capesize vessel.
“At the same time the uninterrupted payment of cash dividends by Seanergy over the last two quarters is a solid indication of our stated intention to continue rewarding our shareholders.”
Seanergy shareholders do not need to take any action to receive United shares to which they are entitled, and do not need to pay any consideration or surrender or exchange Seanergy common shares. Seanergy common shareholders will receive one United common share for every 118 Seanergy common shares held at the close of business on June 28, 2022, the record date for the distribution. Fractional common shares of United will not be distributed. Instead, the distribution agent will aggregate fractional common shares into whole shares, sell such whole shares in the open market at prevailing rates promptly after United’s common shares commence trading on the Nasdaq Capital Market, and distribute the net cash proceeds from the sales pro rata to each holder who would otherwise have been entitled to receive fractional common shares in the distribution. It is not anticipated that a “when-issued” trading market in United common shares will be established, and therefore it is not anticipated that United common shares will begin trading on a standalone basis until the trading day following the date of distribution. Shares of Seanergy common stock are expected to trade with due bills from the record date through and including the date of the distribution of the United common shares. Accordingly, Seanergy common shareholders as of the record date must continuously hold such Seanergy common shares through and including the distribution date in order to receive common shares of United in the proposed spin-off. Holders of Seanergy common shares are encouraged to consult with their financial and tax advisors regarding the specific implications of the proposed spin-off, including the implications of trading in Seanergy common shares prior to the distribution date and the U.S. federal, state and local or foreign tax consequences, as applicable, of the proposed spin-off.
United has filed a registration statement on Form 20-F pursuant to the Securities Exchange Act of 1934 with the Securities and Exchange Commission, which includes a more detailed description of the terms of the proposed spin-off transaction. A copy of the registration statement on Form 20-F is available at www.sec.gov. The information in the filed registration statement on Form 20-F is not final and remains subject to change.
About
Seanergy Maritime Holdings Corp.
Seanergy Maritime Holdings Corp. is the only pure-play Capesize ship-owner publicly listed in the US. Seanergy provides marine dry bulk transportation services through a modern fleet of Capesize vessels. The Company’s fleet consists of 17 Capesize vessels with an average age of 12.3 years and aggregate cargo carrying capacity of 3,011,083 dwt.
The Company is incorporated in the Marshall Islands and has executive offices in Glyfada, Greece. The Company’s common shares trade on the Nasdaq Capital Market under the symbol “SHIP”.
Please visit our company website at: www.seanergymaritime.com.
Forward-Looking
Statements
This press release contains forward-looking statements (as defined in Section 27A of the Securities Act of 1933, as amended, and Section 21E of the Securities Exchange Act of 1934, as amended) concerning future events, including statements regarding the anticipated spin-off of United, including transaction timing and certainty, the planned record and distribution dates our and United’s anticipated competitive positioning and positioning for future success following the spin-off. Words such as “may”, “should”, “expects”, “intends”, “plans”, “believes”, “anticipates”, “hopes”, “estimates” and variations of such words and similar expressions are intended to identify forward-looking statements. These statements involve known and unknown risks and are based upon a number of assumptions and estimates, which are inherently subject to significant uncertainties and contingencies, many of which are beyond the control of the Company. Actual results may differ materially from those expressed or implied by such forward-looking statements. Factors that could cause actual results to differ materially include, but are not limited to, the impact of regulatory requirements or other factors on the Company’s ability to consummate the proposed spin-off; the Company’s operating or financial results; the Company’s liquidity, including its ability to service its indebtedness; competitive factors in the market in which the Company operates; shipping industry trends, including charter rates, vessel values and factors affecting vessel supply and demand; future, pending or recent acquisitions and dispositions; business strategy, areas of possible expansion or contraction, and expected capital spending or operating expenses; risks associated with operations outside the United States; broader market impacts arising from war (or threatened war) or international hostilities, such as between Russia and Ukraine; risks associated with the length and severity of the ongoing novel coronavirus (COVID-19) outbreak, including its effects on demand for dry bulk products and the transportation thereof; and other factors listed from time to time in the Company’s filings with the SEC, including its most recent annual report on Form 20-F. The Company’s filings can be obtained free of charge on the SEC’s website at www.sec.gov. Except to the extent required by law, the Company expressly disclaims any obligations or undertaking to release publicly any updates or revisions to any forward-looking statements contained herein to reflect any change in the Company’s expectations with respect thereto or any change in events, conditions or circumstances on which any statement is based.
For further
information please contact:
Seanergy Investor Relations
Tel: +30 213 0181 522
E-mail: ir@seanergy.gr
Capital Link, Inc.
Paul Lampoutis
230 Park Avenue Suite 1536
New York, NY 10169
Tel: (212) 661-7566
E-mail: seanergy@capitallink.com
Why Understanding the Metaverse isn’t Common Sense
Image Credit: Kimberly Winnington

How We Describe the Metaverse Makes a Difference – Today’s Words Could Shape Tomorrow’s Reality and Who Benefits from It
Quick, define the word “metaverse.”
Coined in 1992 by science fiction author Neal Stephenson, the relatively obscure term exploded in popularity during the COVID-19 pandemic, particularly after Facebook rebranded as Meta in October 2021. There are now myriad articles on the metaverse, and thousands of companies have invested in its development. Citigroup Inc. has estimated that by 2030 the metaverse could be a US$13 trillion market, with 5 billion users.
From climate change to global connection and disability access to pandemic response, the metaverse has incredible potential. Gatherings in virtual worlds have considerably lower carbon footprints than in-person gatherings. People spread all over the globe can gather together in virtual spaces. The metaverse can allow disabled people new forms of social participation through virtual entrepreneurship. And during the early days of the COVID-19 pandemic, the metaverse not only provided people with ways to connect but also served as a place where, for instance, those sharing a small apartment could be alone.
No less monumental dangers exist as well, from surveillance and exploitation to disinformation and discrimination.
| This article was republished with permission from The Conversation, a news site dedicated to sharing ideas from academic experts. It was written by and represents the research-based opinions of Tom Boellstorff, Professor of Anthropology, University of California, Irvine. |
But discussing these benefits and threats remains difficult because of confusion about what “metaverse” actually means. As a professor of anthropology who has been researching the metaverse for almost 20 years, I know this confusion matters. The metaverse is at a virtual crossroads. Norms and standards set in the next few years are likely to structure the metaverse for decades. But without common conceptual ground, people cannot even debate these norms and standards.
Unable to distinguish innovation from hype, people can do little more than talk past one another. This leaves powerful companies like Meta to literally set the terms for their own commercial interests. For example, Nick Clegg, former deputy prime minister of the U.K. and now president of global affairs at Meta, attempted to control the narrative with the May 2022 essay “Making the Metaverse.”
Categorical Prototypes
Most attempted definitions for metaverse include a bewildering laundry list of technologies and principles, but always included are virtual worlds – places online where real people interact in real time. Thousands of virtual worlds already exist, some gaming oriented, like Fortnite and Roblox, others more open-ended, like Minecraft and Animal Crossing: New Horizons.
Beyond virtual worlds, the list of metaverse technologies typically includes avatars, nonplayer characters and bots; virtual reality; cryptocurrency, blockchain and non-fungible tokens; social networks from Facebook and Twitter to Discord and Slack; and mobile devices like phones and augmented reality interfaces. Often included as well are principles like interoperability – the idea that identities, friendship networks and digital items like avatar clothes should be capable of moving between virtual worlds.
The problem is that humans don’t categorize by laundry lists. Instead, decades of research in cognitive science has shown that most categories are “radial,” with a central prototype. One could define “bird” in terms of a laundry list of traits: has wings, flies and so on. But the prototypical bird for North Americans looks something like a sparrow. Hummingbirds and ducks are further from this prototype. Further still are flamingos and penguins. Yet all are birds, radiating out from the socially specific prototype. Someone living near the Antarctic might place penguins closer to the center.
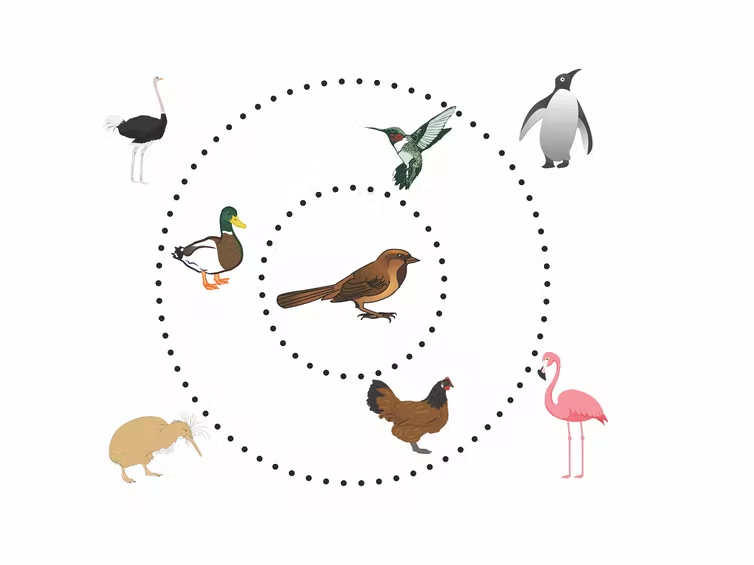
This representation of radial categories shows that the prototypical bird for most Americans is a sparrow, and that while ostrich legs are bird parts, they aren’t part of every bird. Credit: Tom Boellstorff
Human creations are usually radial categories as well. If asked to draw a chair, few people would draw a dentist chair or beanbag chair.
The metaverse is a human creation, and the most important step to defining it is to realize it’s a radial category. Virtual worlds are prototypical for the metaverse. Other elements of the laundry list radiate outward and won’t appear in all cases. And what’s involved will be socially specific. It will look different in Alaska than it will in Addis Ababa, or when at work versus at a family gathering.
Whose Idea of Essential?
This matters because one of the most insidious rhetorical moves currently underway is to assert that some optional aspect of the metaverse is prototypical. For instance, many pundits define the metaverse as based on blockchain technology and cryptocurrencies. But many existing virtual worlds use means other than blockchain for confirming ownership of digital assets. Many use national currencies like the U.S. dollar, or metaverse currencies pegged to a national currency.
Another such rhetorical move appears when Clegg uses an image of a building with a foundation and two floors to argue not only that interoperability will be part of “the foundations of the building” but that it’s “the common theme across these floors.”
But Clegg’s warning that “without a significant degree of interoperability baked into each floor, the metaverse will become fragmented” ignores how interoperability isn’t prototypical for the metaverse. In many cases, fragmentation is desirable. I might not want the same identity in two different virtual worlds, or on Facebook and an online game.

The 13-year-old computer game Minecraft lets players build virtual worlds, which makes it a prototypical element of the metaverse.
This raises the question of why Meta – and many pundits – are fixated on interoperability. Left unsaid in Clegg’s essay is the “foundation” of Meta’s profit model: tracking users across the metaverse to target advertising and potentially sell digital goods with maximum effectiveness. Recognizing “metaverse” as a radial category reveals that Clegg’s claim about interoperability isn’t a statement of fact. It’s an attempt to render Meta’s surveillance capitalism prototypical, the foundation of the metaverse. It doesn’t have to be.
Locking in Definitions
This example illustrates how defining the metaverse isn’t an empty intellectual exercise. It’s the conceptual work that will fundamentally shape design, policy, profit, community and the digital future.
Clegg’s essay concludes optimistically that “time is on our side” because many metaverse technologies won’t be fully realized for a decade or more. But as the VR pioneer Jaron Lanier has noted, when definitions about digital technology get locked in they become difficult to dislodge. They become digital common sense.
With regard to the definitions that will be the true foundation of the metaverse, time is emphatically not on our side. I believe that now is the time to debate how the metaverse will be defined — because these definitions are very likely to become our digital realities.
Suggested Reading
 The Metaverse is Under Construction, Here’s What is Known
|
 Microstrategy’s Bitcoin Position and the Past, Present, and Future of Crypto
|
 Cathie Wood and the Risk of Trying to Get Someplace Fast
|
 Metaverse: Is the Future Real? – Panel Presentation from NobleCon18
|
Stay up to date. Follow us:

|
Bear Market Wisdom
Image Credit: Pixabay (Flickr)

Investors Always Have to Play the Cards They’re Dealt
Keeping your cool when faced with options that affect your investments will more likely translate into making better decisions. But often, when a stock goes against us or a bear market takes a bite out of our portfolio, we forget we have options. This could lead to doing nothing, doubling down at the wrong time, or unloading everything for a loss – then swearing we’ll never invest in another stock for as long as we live. Investors do have options; what is important is to look at where you are and not let the change in your portfolio remove good judgment.
Your Own Soft Landing
Investors are looking for ways to shield their portfolios after stocks gave back 10% so far in June alone. This followed a slow erosion throughout the year that amounted to another 10% or more. Just this Monday, the S&P 500 closed more than 20% lower than the highs reached at the start of 2022. Investors have come to define a bear market as a 20% decline from highs that would place us in a bear market. But it gets even more intense, on Wednesday, the Federal Reserve instituted the largest rate increase since 1994 in an attempt to hit the brakes on an economy that has become inflationary.
Aside from the market which is anticipating the Fed will be successful at creating a slowdown, the market may already be in a recession. First quarter GDP declined by 1.5%, putting us at risk of being in one already the first half of this year. However, Fed Chairman Powell indicated in his statement this week that the economy had accelerated during the second quarter. Concern is still high among investors, economists, business owners, and households about the path of the economy, or more accurately what the path means for them and what they may do now to have their own “soft landing.” There is a lot of fear bordering on panic across all the stakeholders in a healthy economy.
For investors, this elevated fear can cause questionable investment moves. Below are three typical moves investors have made when their once healthy portfolio took a bad turn. Just knowing them and also that others have lived through similar cycles could lead to better thought processes for an investor.
Doing Nothing – The deer in the headlights approach of just watching an oncoming car that may hit it is not uncommon. You want to do something but you’re frozen. For some, this occurs because each time they move to do something, they see signs that conditions may change. With so much going on in any economy, it is always possible to see anything you want to see.
It may make sense for investors that have experienced this to predefine actions they will take if certain events occur. For example, if the stock decreases in value faster than the S&P 500 index over the next week I will sell X.XX%. If the stock outperforms the S&P 500 index in the coming week, I will retain my holding and then watch for the same circumstances the following week.
Having a rules-based system to guide you or show you when your money is not employed in the best place can help prevent indecisiveness.
Hit the Sell Button on Everything – Individual investors tend to sell after an economic downturn is already priced into equity markets. Selling when stocks are 20% cheaper than they had been and below where you were once comfortable buying them locks in your loss. Getting rid of the paper loss allows the investor to not have to worry or watch it anymore. They bite the bullet and deal with it by making it go away. What caused the pain can’t hurt them any longer.
The decision is based more on figuring out how to stop the worry. If the same investor had missed buying the same stocks and was now looking at them down double digits, they may find the positions attractive. But, the red in their account does not allow for the same, clear, less emotionally clouded disposition for decision making.
The solution is to forget about where you bought it and decide if it is the best place for your money within your investment time horizon. If you believe you can get a better return elsewhere, then move. If you think the potential is strong and better than the alternatives, stop worrying about it.
Most humans are wired to have perfect bad timing when investing. They will watch something go up and wish they had bought it. About the time they give in and buy, the stock has peaked. The same happens with selling; when the holding is losing value, people tend to watch and not sell until it is near the end of its decline.
Doubling Down – With a long enough time horizon or a large enough pool of reserves, doubling down in a diversified portfolio has always paid off. However, sometimes it has taken 30 years. In recent history, the recovery time has been much shorter.
If you are looking to add to losing positions, approach with caution, and know, that the reality is you’re looking to find the bottom when the bottom may not be reached for another year. Average in if you can, spread your risk.
Take-Away
Knowing that the market moves in cycles and having faith that this time it is the same as other times helps one have a clear head to make investment decisions going forward.
Simplifying options and making a plan help the thought process and the implementation of investment moves. Any move should be weighed against the risk of inflation eating away at savings, credit card debt costing more than any investment return expectations, and making sure losses are never so big that you don’t have capital set aside for the next long-lived wave upward.
Managing Editor, Channelchek
Suggested Content
 Winners and Losers in a Market Capitulation
|
 Is the Bear Market Bull?
|
 Exposure to Non-Travel Leisure Stocks
|
 What Investors Haven’t Yet Noticed About the Value in Some Biotechs
|
Stay up to date. Follow us:
|
|
Release -Defense Metals Diamond Drilling Update – Pit Slope Geotechnical Preparations Underway
![]()
Defense Metals Diamond Drilling Update – Pit Slope Geotechnical Preparations Underway
News, and Market Data on Defense Metals
|
|
|


|
|
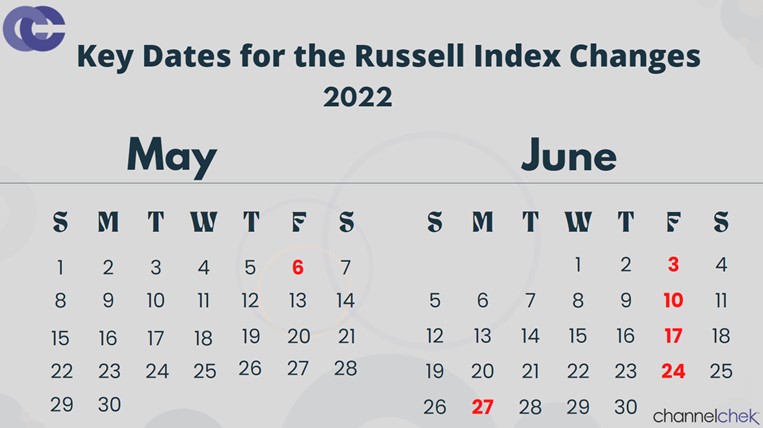
Will Sell off Impact Russell Reconstitution Investor Strategies?
Image Credit: Todd F Niemand (Flickr)

Investors and Traders that Jumped in Early to FTSE Russell Trade May Have Gotten Soaked
How has the stock market sell off impacted the FTSE Russell Reconstitution? A sudden rise in a stock’s price is almost always demand-related. And demand for a few hundred stocks has been expected to come a week from Monday when the market opening bell rings on June 27. The FTSE Russell 3000 will include 300 new names for the next year or more. The FTSE Russell will also be recalibrating its Microcap Index. Fund managers that manage index funds tied to these benchmarks will need to eliminate their holdings in what is exiting the index related to the fund they manage, and on a balanced weighting, take on some new names to their holdings. Hedge funds and individual investors know this and it has become popular to front-run the late June shift in demand. But an unexpected selloff might be gunking up investor strategies.
Background
Inclusion in a major market index is exciting for the management of a publicly held company, while it can cause dislocations and wild price swings that may not wind up with the stock price being higher, they can count on higher trading volume, which increases liquidity and reduces bid/ask spreads.
For investors, since the 1990s, it has signaled a period where hedge funds and individuals alike try to take advantage of the short-term dislocations and adjustments. It’s important for all involved to remember that much of the list of names included or excluded for the first time in a Russell Index may just be moving from one index classification to another. In these cases, it may be difficult to gauge whether there will be higher demand or lower. Market forces also play a large part; the market has been bearish recently, so performance is relative.
Source: Koyfin
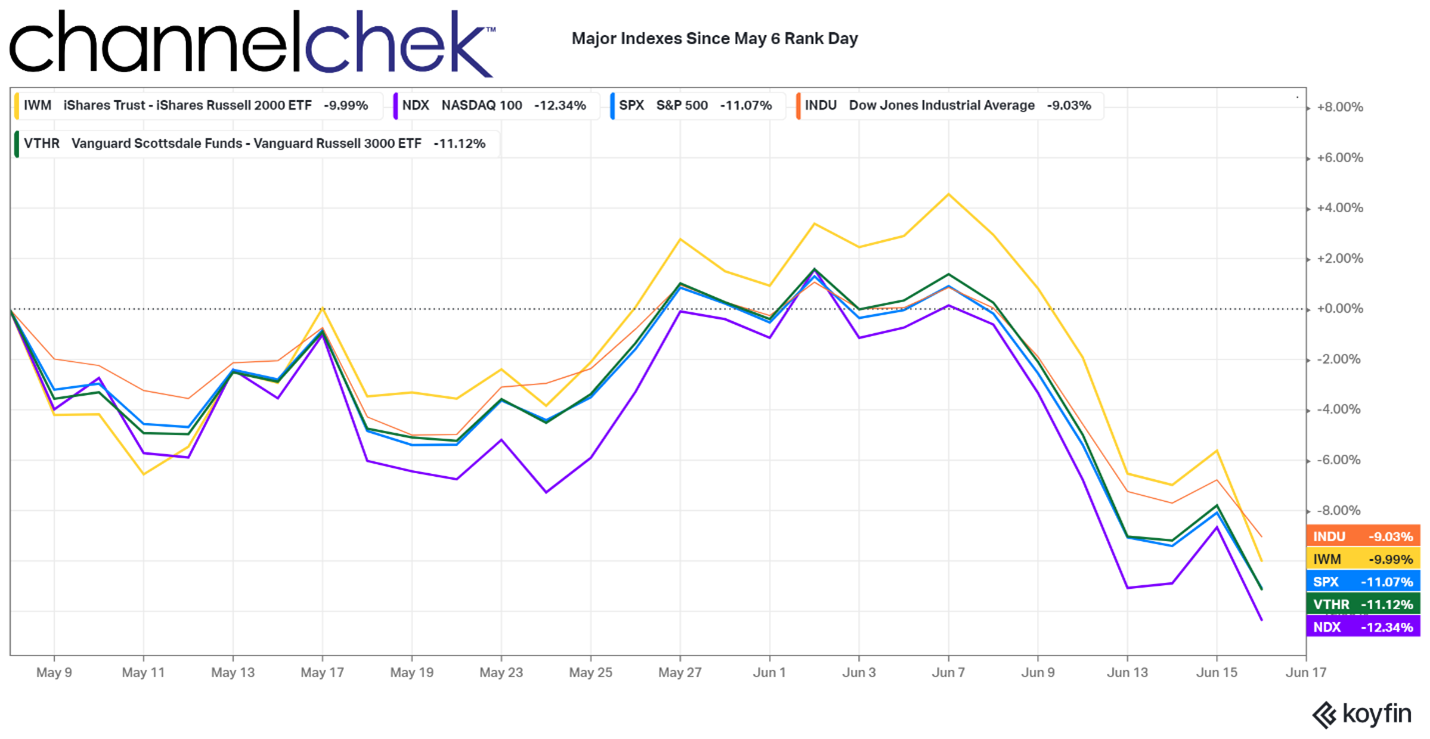
Reconstitution June 2022
There is no indication of how monetary policy, inflation, investor appetite, and market weakness is going to affect the final days of the rebalancing. The Russell 3000 Index (shown above using VTHR) is down 11.12% since rank day. The Russell 2000 is down 9.99%. Rank day is when the FTSE Russell looks at all stock’s closing prices and determines the top 3000 stocks by market value.
For investors and traders that were looking to, and even have acted to cash in on an early entry strategy, and even portfolio managers that got an early start rebalancing, they may have been caught by all the fall off in the markets; some may have even amassed oversized losses.
Typical Pre-Rebalance Day Strategy
The basics of the strategy involves buying up shares in companies slated for inclusion in an index and selling short the companies about to be removed. Trillions of dollars in passive investment funds like Mutual funds and ETFs are designed to mimic these indexes. Knowing this, traders, hedge funds, and savvy individuals have noted the changes announced by Russell weeks in advance, purchases some of those expected to be added, and then wait until late June and early July to sell these positions. The result over the years has at times been significant, with high probability of price moves. The added stocks on average rise and the deleted stocks wane.
Not Your Typical June
This strategy has been around a while, but it has gotten crowded over the past five years. Investors and traders in 2022 may need to temper their enthusiasm with this rebalance. This year there may already be far more than average that are holding stocks in these names that will soon be lined up to unwind. This could cause weakness in the very stocks purchased to rise. Plus, investors may already be down double digits in these names.
Source: Koyfin
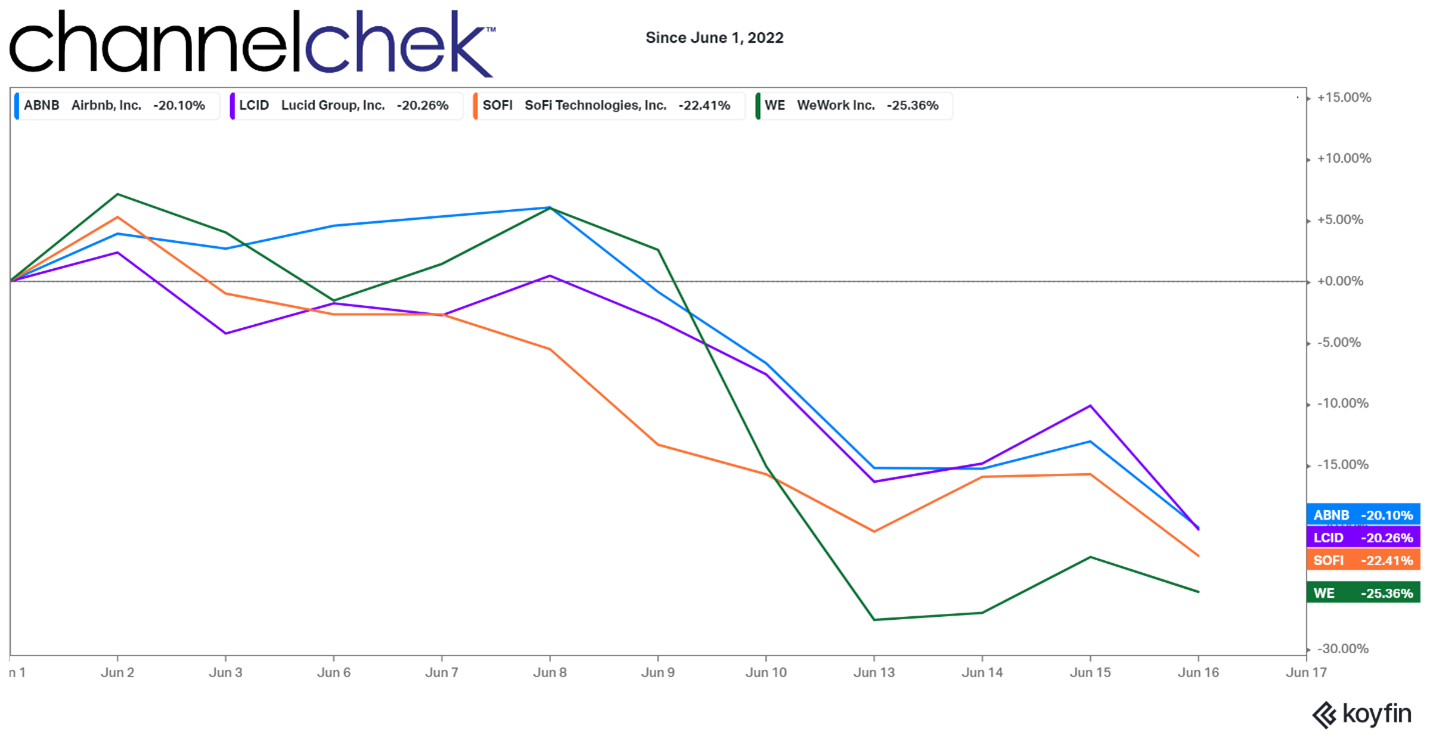
The nearly 300 stocks scheduled to join the index on June 27 include Airbnb (ABNB), Lucid Motors (LCID), SoFi Technologies (SOFI) , WeWork (WE), and many others that have gone off a cliff this month. The S&P 500 and Russell 3000 are each down 9%.
It’s not the first time the index-rebalance trade has soaked participants. In 2020, specialists in the strategy started off in disarray as fallout from COVID-19 late Spring altered many of the rebalance participants that hedge funds had presupposed. What was strong became weak and what was weak became strong just before the rank date.
Take Away
There are investors that look to determine which companies may be added to an index and which may be removed. Although being right doesn’t always mean huge gains, the rewards, on average, make this a legitimate approach for stock picking. This year the Russell 3000 index may have undermined strategies to get in early unless those that got in early shorted stocks being removed.
The sell off prior to the June 27 reopening could leave many who looked at their Russell Index play as a short term holding taking a huge loss, or keeping the money tied up while hoping for a 30% rally. Tax considerations aside, if any holding becomes dead money for any length of time, while there are better opportunities, taking a loss should be considered.
Be careful out there.
Managing Editor, Channelchek
Suggested Content
 Russell Reconstitution 2022, What Investors Should Know
|
 Investors Keeping Their Eye on Fridays in June
|
 Has Summer Driving Season Been Cancelled by High Gas Prices?
|
 Is Crumbling Trust in the Financial System Leading to a Flight to Real Assets?
|
Sources
https://www.ftserussell.com/press
https://www.sec.gov/fast-answers/answersindiceshtm.html
Sources
https://twitter.com/elonmusk/status/1501449525831081987
https://www.cnbc.com/2022/06/14/bitcoin-plunge-spells-trouble-for-michael-saylors-microstrategy.html
Stay up to date. Follow us:
|
|
Allegiant Gold (AUXXF) – Keeping an Eye Out for the Next Update
Friday, June 17, 2022
Allegiant Gold (AUXXF)
Keeping an Eye Out for the Next Update
Allegiant owns 100% of 10 highly-prospective gold projects in the United States, seven of which are located in the mining-friendly jurisdiction of Nevada. Three of Allegiant’s projects are farmed-out, providing for cost reductions and cash-flow. Allegiant’s flagship, district-scale Eastside project hosts a large and expanding gold resource and is located in an area of excellent infrastructure. Preliminary metallurgical testing indicates that both oxide and sulphide gold mineralization at Eastside is amenable to heap leaching.
Mark Reichman, Senior Research Analyst, Natural Resources, Noble Capital Markets, Inc.
Refer to the full report for the price target, fundamental analysis, and rating.
Drilling through the remainder of the year. In April, Allegiant Gold commenced its 14,000-meter drilling program at Eastside. We expect two rigs to be in operation at Eastside through the remainder of the year. With the recent investment by Kinross Gold Corporation (NYSE: KGC, TSX: K), along with its technical advisory support, deeper core drilling will help to better assess Eastside’s high-grade potential. We might expect the company to provide an update soon.
Updating estimates. We have updated our estimates and forecast a 2022 net loss per share of C$(0.02) compared to our prior estimate of C$(0.01). Our revised estimate reflects greater expenses associated with investor relations, professional fees, and non-cash share-based payments….
This Company Sponsored Research is provided by Noble Capital Markets, Inc., a FINRA and S.E.C. registered broker-dealer (B/D).
*Analyst certification and important disclosures included in the full report. NOTE: investment decisions should not be based upon the content of this research summary. Proper due diligence is required before making any investment decision.
Entravision Communications (EVC) – Quarterly Preview: Raising Estimates
Friday, June 17, 2022
Entravision Communications (EVC)
Quarterly Preview: Raising Estimates
Entravision Communications Corporation is a diversified Spanish-language media company utilizing a combination of television and radio operations to reach Hispanic consumers across the United States, as well as the border markets of Mexico. Entravision owns and/or operates 53 primary television stations and is the largest affiliate group of both the top-ranked Univision television network and Univision’s TeleFutura network, with television stations in 20 of the nation’s top 50 Hispanic markets. The Company also operates one of the nation’s largest groups of primarily Spanish-language radio stations, consisting of 48 owned and operated radio stations.
Michael Kupinski, Director of Research, Noble Capital Markets, Inc.
Patrick McCann, Research Associate, Noble Capital Markets, Inc.
Refer to the full report for the price target, fundamental analysis, and rating.
Q2 expected to exceed consensus. We believe that revenue trends in the company’s digital and TV businesses are pacing slightly better than our original estimates. As such, we are raising our total company revenue estimate from $219.1 million to $222.7 million. And, we are raising our Q2 adj. EBITDA estimate from $19.7 million to $21.9 million. We believe that the results will exceed consensus and current analysts estimates.
Digital on fire. We believe that the company is expanding its international markets, developing deep relationships with social media companies, and seeing strong growth for its programmatic business Smadex. Digital revenue growth is expected to be roughly 35% in Q2 and a strong 32% for the full year 2022. …
This Company Sponsored Research is provided by Noble Capital Markets, Inc., a FINRA and S.E.C. registered broker-dealer (B/D).
*Analyst certification and important disclosures included in the full report. NOTE: investment decisions should not be based upon the content of this research summary. Proper due diligence is required before making any investment decision.