Forecasting Stocks, Disease, Weather, Sales, All Made Easier With a Simple Algorithm


A Tool for Predicting the Future – Helping Nonexperts Make Forecasts Using Data Collected Over Time


Adam Zewe | MIT News Office


Whether someone is trying to predict tomorrow’s weather, forecast future stock prices, identify missed opportunities for sales in retail, or estimate a patient’s risk of developing a disease, they will likely need to interpret time-series data, which are a collection of observations recorded over time.

Making predictions using time-series data typically requires several data-processing steps and the use of complex machine-learning algorithms, which have such a steep learning curve they aren’t readily accessible to nonexperts.

To make these powerful tools more user-friendly, MIT researchers developed a system that directly integrates prediction functionality on top of an existing time-series database. Their simplified interface, which they call tspDB (time series predict database), does all the complex modeling behind the scenes so a nonexpert can easily generate a prediction in only a few seconds.

The new system is more accurate and more efficient than state-of-the-art deep learning methods when performing two tasks: predicting future values and filling in missing data points.

One reason tspDB is so successful is that it incorporates a novel time-series-prediction algorithm, explains electrical engineering and computer science (EECS) graduate student Abdullah Alomar, an author of a recent research paper in which he and his co-authors describe the algorithm. This algorithm is especially effective at making predictions on multivariate time-series data, which are data that have more than one time-dependent variable. In a weather database, for instance, temperature, dew point, and cloud cover each depend on their past values.

The algorithm also estimates the volatility of a multivariate time series to provide the user with a confidence level for its predictions.

“Even as the time-series algorithm can effectively capture any time-series structure out there, data becomes more and more complex. It feels like we have found the right lens to look at the model complexity of time-series data,” says senior author Devavrat Shah, the Andrew and Erna Viterbi Professor in EECS and a member of the Institute for Data, Systems, and Society and of the Laboratory for Information and Decision Systems.

Joining Alomar and Shah on the paper is lead author Anish Agrawal, a former EECS graduate student who is currently a postdoc at the Simons Institute at the University of California at Berkeley. The research will be presented at the ACM SIGMETRICS conference.


Adapting a New Algorithm

Shah and his collaborators have been working on the problem of interpreting time-series data for years, adapting different algorithms and integrating them into tspDB as they built the interface.

About four years ago, they learned about a particularly powerful classical algorithm, called singular spectrum analysis (SSA), that imputes and forecasts single time series. Imputation is the process of replacing missing values or correcting past values. While this algorithm required manual parameter selection, the researchers suspected it could enable their interface to make effective predictions using time series data. In earlier work, they removed this need to manually intervene for algorithmic implementation. 

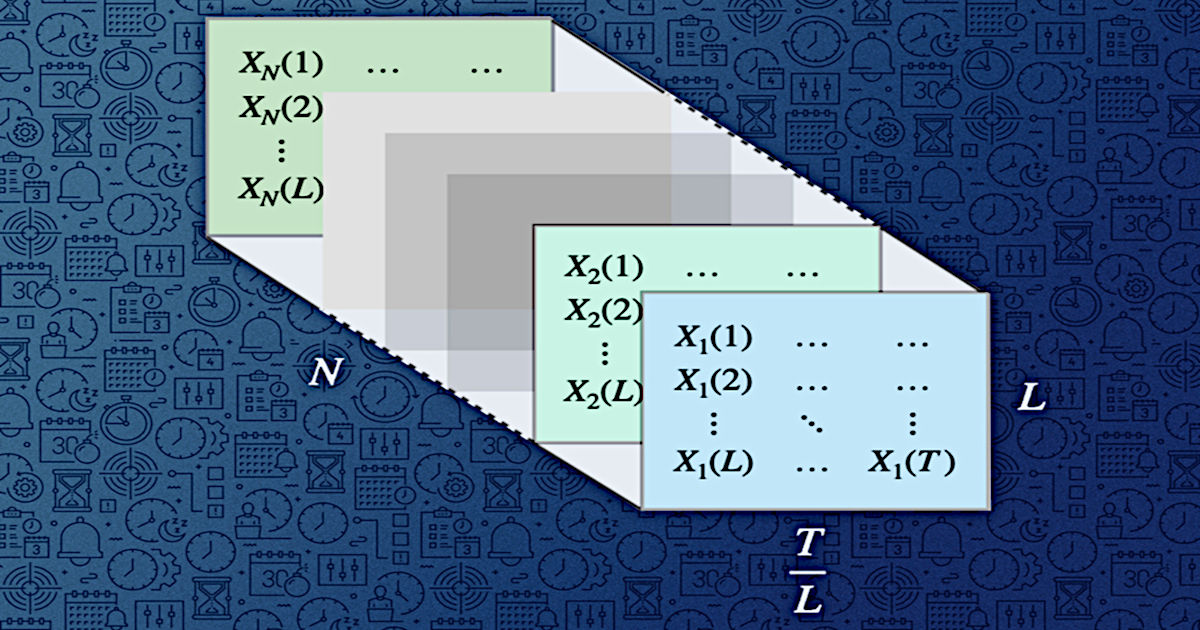
The algorithm for single time series transformed it into a matrix and utilized matrix estimation procedures. The key intellectual challenge was how to adapt it to utilize multiple time series.  After a few years of struggle, they realized the answer was something very simple: “Stack” the matrices for each individual time series, treat it as a one big matrix, and then apply the single time-series algorithm on it.

This utilizes information across multiple time series naturally — both across the time series and across time, which they describe in their new paper.

This recent publication also discusses interesting alternatives, where instead of transforming the multivariate time series into a big matrix, it is viewed as a three-dimensional tensor. A tensor is a multi-dimensional array, or grid, of numbers. This established a promising connection between the classical field of time series analysis and the growing field of tensor estimation, Alomar says.

“The variant of mSSA that we introduced actually captures all of that beautifully. So, not only does it provide the most likely estimation, but a time-varying confidence interval, as well,” Shah says.


The Simpler, the Better

They tested the adapted mSSA against other state-of-the-art algorithms, including deep-learning methods, on real-world time-series datasets with inputs drawn from the electricity grid, traffic patterns, and financial markets.

Their algorithm outperformed all the others on imputation and it outperformed all but one of the other algorithms when it came to forecasting future values. The researchers also demonstrated that their tweaked version of mSSA can be applied to any kind of time-series data.

“One reason I think this works so well is that the model captures a lot of time series dynamics, but at the end of the day, it is still a simple model. When you are working with something simple like this, instead of a neural network that can easily overfit the data, you can actually perform better,” Alomar says.


The impressive performance of mSSA is what makes tspDB so effective, Shah explains. Now, their goal is to make this algorithm accessible to everyone.

One a user installs tspDB on top of an existing database, they can run a prediction query with just a few keystrokes in about 0.9 milliseconds, as compared to 0.5 milliseconds for a standard search query. The confidence intervals are also designed to help nonexperts to make a more informed decision by incorporating the degree of uncertainty of the predictions into their decision making.

For instance, the system could enable a nonexpert to predict future stock prices with high accuracy in just a few minutes, even if the time-series dataset contains missing values.

Now that the researchers have shown why mSSA works so well, they are targeting new algorithms that can be incorporated into tspDB. One of these algorithms utilizes the same model to automatically enable change point detection, so if the user believes their time series will change its behavior at some point, the system will automatically detect that change and incorporate that into its predictions.

They also want to continue gathering feedback from current tspDB users to see how they can improve the system’s functionality and user-friendliness, Shah says.

“Our interest at the highest level is to make tspDB a success in the form of a broadly utilizable, open-source system. Time-series data are very important, and this is a beautiful concept of actually building prediction functionalities directly into the database. It has never been done before, and so we want to make sure the world uses it,” he says.

“This work is very interesting for a number of reasons. It provides a practical variant of mSSA which requires no hand tuning, they provide the first known analysis of mSSA, and the authors demonstrate the real-world value of their algorithm by being competitive with or out-performing several known algorithms for imputations and predictions in (multivariate) time series for several real-world data sets,” says Vishal Misra, a professor of computer science at Columbia University who was not involved with this research. “At the heart of it all is the beautiful modeling work where they cleverly exploit correlations across time (within a time series) and space (across time series) to create a low-rank spatiotemporal factor representation of a multivariate time series. Importantly this model connects the field of time series analysis to that of the rapidly evolving topic of tensor completion, and I expect a lot of follow-on research spurred by this paper.”


Suggested Reading


Are Economic Excesses Creating Investment Opportunity?


Retail Investors May Soon See More Safety Measures Including Coursework and Testing


How Your Data is Used to Generate Big Returns


What Makes a Country a Tax Haven?


Stay up to date. Follow us:


Wendyverse Allows Wendy’s to Meta Market


The Metaverse will Now Include Fast Food’s Favorite Redhead


This calendar week each year, I’m always skeptical of stories that seem to not jibe with reality. Around April Fools’ you see even the most stodgy firms trying to shock and have some fun. I still remember last year when Volkswagen created a stir by saying it was rebranding to VOLTswagen? So when Wendy’s, which loves to have fun on Twitter, announced it was creating Wendysverse, I needed to triple check if their metaverse announcement was a reality or a stunt.


In March of 2021 VW got in trouble with the SEC with a prank that significantly moved
their stock price


The reality is the fast-food restaurant is available in virtual reality. Wendy’s will exist on Meta’s Horizon Worlds (Facebook) platform incarnated as “Wendyverse.”  This is a marketing and gaming combination that will help their brand stay in front of consumers in the virtual world.

As of April 2, those with a Quest 2 headset will be able to enter the metaverse activation, which is divided into two areas: Towne Square Central, home to a virtual Wendy’s restaurant, and Partnership Plaza, where players can shoot Baconators on a branded basketball court called the Buck BiscuitDome (which is a limited-edition menu item that is currently available). The experiences were developed through a collaboration between Wendy’s and community creators.


Wendy’s didn’t invent marketing in VR. Metaverse locations like Wendyverse are being rolled out by others as brands work to stay fresh by being digitally minded to attract and retain younger customers. For some of these virtual worlds, the customers have to be at least 21 as Jose Cuervo announced plans to build a distillery in Decentraland. Also, Miller Lite opened a bar on Decentraland for the Super Bowl. Fast food restaurants in particular have been building out virtual spaces as they look to build on their base of consumers by marketing in a game-like setting and going where their customers are. Even McDonald’s and Chipotle have created virtual experiences – Arby’s recently filed trademarks to offer virtual food and beverages.


Source: @wendys (Twitter)

What’s noteworthy about Wendy’s entry is their use of Meta’s Horizon Worlds. The platform, which just hit 300,000 users, requires an Oculus headset, which can cost near $300. This may allow a more immersive Wendysville experience, but could also limit the number of potential visitors. Horizon Worlds platform has seen fewer brand partnerships to date than rival platforms like Roblox, Decentraland and The Sandbox – cost of entry is one of the reasons.

To visit Wendyverse, customers must first download the Horizon Worlds app. Inside the app, they have to search for Wendyverse and click on a picture to travel to the virtual world.

Paul Hoffman

Managing Editor, Channelchek


Suggested Reading


Zuckerberg Top Executive Joins NobleCon18 Lineup


Walmart’s Metaverse, NFT, and Crypto Plans


The Metaverse is Under Construction, Here’s What is Known


Microsoft and Facebook are Now All In on the Metaverse


Sources

https://www.theverge.com/2022/2/17/22939297/meta-social-vr-platform-horizon-300000-users

https://omicronb11529variant.com/wendys-opens-metaverse-restaurant-in-metas-horizon-worlds-adage-com/

https://www.marketingdive.com/news/wendys-metaverse-meta-horizon-worlds/621325/

https://twitter.com/Wendys/status/1509185783776878598

https://www.restaurantbusinessonline.com/marketing/wendys-newest-location-will-be-metaverse


Stay up to date. Follow us:


Kratos Demonstrates All-Digital Multi-Mission Edge Capability at the 37th Space Symposium


Kratos Demonstrates All-Digital Multi-Mission Edge Capability at the 37th Space Symposium

Research, News, and Market Data on Kratos Defense & Security Solutions


Will Preview the Industry’s First Implementation of DIFI Compliant Digital Terminal Capability Running on COTS Hardware

SAN DIEGO
March 31, 2022 (GLOBE NEWSWIRE) — 
Kratos Defense & Security Solutions, Inc. (Nasdaq: KTOS), a leading National Security Solutions provider, announced today that along with technology partner 
Kymeta, it will provide live demonstrations of an all-digital multi-mission capability at the 37th Annual Space Symposium in 
Colorado Springs, Colorado
April 4-7.

The demonstrations will include Kratos’ OpenSpace™ Satcom and RF Carrier Analysis virtual network functions running on a generic (x86) compute device that is digitally paired with a 
Kymeta electronically steered antenna (ESA) mounted inside a tactical H2 vehicle. This virtual architecture enables a universally deployable solution within a broad range of resilient ground station and cloud environments.

This demonstration highlights the first ever implementation of the industry interoperability standard developed by the 
Digital Intermediate Frequency Interoperability (DIFI) Consortium inside a terminal application. DIFI members include the 
U.S. DoD CIO, 
U.S. Army
U.S. Navy
U.S. Space Force, DISA, as well as key commercial companies, and the standard has already been specified in at least one 
U.S. defense-related RFP. The industry’s growing adoption of the DIFI standard supports the DoD’s digital transformation goals, as well as freeing operators from the vendor lock-in characterized by proprietary systems.

“This demonstration will show that critical satellite network operations can be made increasingly virtual, interoperable and software-defined all the way to the network’s edge,” said  Kevin Tobias, Director of Edge Products at Kratos. “It is another step forward in proving that the ground layer can enable multi-orbit networks and multi-mission operations, for example Satcom, space domain awareness (SDA) and ISR together as dynamic, virtualized applications, and all supporting the DoD’s digital transformation goals and JADC2 principles regarding open-standards and interoperability.”

Attendees at the 37th Annual Space Symposium can view these industry-first capabilities at the Kratos H2 located on site for demonstrations during exhibit hall hours, 
April 4-7, 2022. Visit Kratos booth 1140 in Bartolin Hall to schedule a demo.

About Kratos OpenSpace
Kratos’ OpenSpace family of solutions enables the digital transformation of satellite ground systems to become a more dynamic and powerful part of the space network. The family consists of three product lines: OpenSpace SpectralNet for converting satellite RF signals to be used in digital environments; OpenSpace quantum products, which are virtual versions of traditional hardware components; and the OpenSpace Platform, the first commercially available, fully orchestrated, software-defined ground system. These three OpenSpace lines enable satellite operators and other service providers to implement digital operations at their own pace and in ways that meet their unique mission goals and business models. For more information about the OpenSpace family visit http://KratosDefense.com/OpenSpace.

About Kratos Defense & Security Solutions

Kratos Defense & Security Solutions, Inc. (NASDAQ:KTOS) develops and fields transformative, affordable technology, platforms and systems for United States National Security related customers, allies and commercial enterprises. Kratos is changing the way breakthrough technology for these industries are rapidly brought to market through proven commercial and venture capital backed approaches, including proactive research and streamlined development processes. At Kratos, affordability is a technology and we specialize in unmanned systems, satellite communications, cyber security/warfare, microwave electronics, missile defense, hypersonic systems, training, combat systems and next generation turbo jet and turbo fan engine development. For more information go to www.KratosDefense.com.

Notice Regarding Forward-Looking Statements
Certain statements in this press release may constitute “forward-looking statements” within the meaning of the Private Securities Litigation Reform Act of 1995. These forward-looking statements are made on the basis of the current beliefs, expectations and assumptions of the management of Kratos and are subject to significant risks and uncertainty. Investors are cautioned not to place undue reliance on any such forward-looking statements. All such forward-looking statements speak only as of the date they are made, and Kratos undertakes no obligation to update or revise these statements, whether as a result of new information, future events or otherwise. Although Kratos believes that the expectations reflected in these forward-looking statements are reasonable, these statements involve many risks and uncertainties that may cause actual results to differ materially from what may be expressed or implied in these forward-looking statements. For a further discussion of risks and uncertainties that could cause actual results to differ from those expressed in these forward-looking statements, as well as risks relating to the business of Kratos in general, see the risk disclosures in the Annual Report on Form 10-K of Kratos for the year ended 
December 26, 2021, and in subsequent reports on Forms 10-Q and 8-K and other filings made with the 
SEC by Kratos.

Press Contact:
Yolanda White
858-812-7302 Direct

Investor Information:
877-934-4687
investor@kratosdefense.com

Gray Sets Date For First Quarter Earnings Release And Earnings Conference Call


Gray Sets Date For First Quarter Earnings Release And Earnings Conference Call

Research, News, and Market Data on Gray Television


ATLANTA, March 31, 2022 (GLOBE NEWSWIRE) — Gray Television, Inc. (NYSE: GTN) today announced that it will release its earnings results for the quarter ending March 31, 2022 on Friday, May 6, 2022.

 Earnings Conference Call Information
Gray Television, Inc. will host a conference call to discuss its operating results for the quarter ended March 31, 2022, on Friday, May 6, 2022. The call will begin at 11:00 a.m. Eastern Time. The live dial-in number is 1-855-493-3489 and the confirmation code is 8298523. The call will be webcast live and available for replay at www.gray.tv. The taped replay of the conference call will be available at 1-855-859-2056 Confirmation Code: 8298523 until June 6, 2022.

About Gray Television
Gray Television, Inc. is a multimedia company headquartered in Atlanta, Georgia. We are the nation’s largest owner of top-rated local television stations and digital assets in the United States that serve 113 television markets reaching approximately 36 percent of US television households. This portfolio includes 80 markets with the top-rated television station and 100 markets with the first and/or second highest rated television station. We also own video program companies Raycom Sports, Tupelo Honey, and PowerNation Studios, as well as Third Rail Studios.


Contact Data

Gray Contacts:
Website: www.gray.tv
Jim Ryan, Executive Vice President and Chief Financial Officer, 404-504-9828
Kevin P. Latek, Executive Vice President, Chief Legal and Development Officer, 404-266-8333

PDS Biotech Provides Business Update and Reports Fourth-Quarter and Full-Year 2021 Financial Results


PDS Biotech Provides Business Update and Reports Fourth-Quarter and Full-Year 2021 Financial Results

Research, News, and Market Data on PDS Biotech


Company to host conference call and webcast today, March 31, 2022, at 8:00 AM EDT

FLORHAM PARK, N.J., March 31, 2022 (GLOBE NEWSWIRE) — PDS Biotechnology Corporation (Nasdaq: PDSB), a clinical-stage immunotherapy company developing a growing pipeline of molecularly targeted cancer immunotherapies and infectious disease vaccines based on the Company’s proprietary Versamune® and Infectimune™ T-cell activating technologies, today provided a business update and announced its financial results for the year ended December 31, 2021.

“I’m very pleased to report that we have undergone a 12-month period of incredible productivity here at PDS Biotech,” commented Dr. Frank Bedu-Addo, President and Chief Executive Officer of the Company. “We’ve made significant clinical progress on our lead oncology candidate, PDS0101, and presented at leading oncology conferences on the promising efficacy and safety results of PDS0101 from two of our ongoing Phase 2 clinical trials. Another phase 2 clinical study of PDS0101 to be led by Mayo Clinic was initiated this month, to evaluate PDS0101 as a potential first-line neo-adjuvant treatment for patients with oropharyngeal cancer prior to transoral robotic surgery. We also recently announced encouraging pre-clinical data from our NIAID-funded universal flu vaccine program. We continue to leverage our unique T-cell activating platforms to advance additional pre-clinical oncology and infectious disease candidates.”

Dr. Bedu-Addo continued: “Over the past year, we completed two licensing transactions and secured additional intellectual property for our expanding pipeline. We also received approval of a US composition of matter and use patent for PDS0101. We strengthened our scientific advisory and leadership teams by adding distinguished immuno-oncology experts to our scientific advisory board and welcomed Matthew Hill as our Chief Financial Officer. We also added more than $52 million to our balance sheet in 2021, significantly extending our cash runway and ability to continue to advance our clinical and pre-clinical programs. We look forward to an equally productive 2022, during which we expect to announce additional data from our ongoing Phase 2 oncology trials for PDS0101, as well as plan to progress at least one of our preclinical programs, PDS0103 into the clinic.”

Fourth Quarter 2021 and Recent Business Highlights:

  • Achieved several milestones in the VERSATILE-002 Phase 2 combination trial of PDS0101-KEYTRUDA® (pembrolizumab) for recurrent and/or metastatic human papillomavirus (HPV)16-associated head and neck cancer. These milestones include:
    • Presented preliminary safety data on a total of 18 checkpoint inhibitor naïve patients at the 2022 Multidisciplinary Head and Neck Cancers Symposium. Highlights from the presentation include the absence of dose-limiting toxicities, drug discontinuation related to toxicity, or any significant immune-related adverse events. Subjects received a median of 4 doses of PDS0101 (range 1-5) and a median of 6 doses of KEYTRUDA® (range 1-13).
    • Achieved preliminary objective response benchmarks that enabled us to advance towards full enrollment of 54 patients in the checkpoint inhibitor naïve patient cohort.
    • Initiated enrollment in the checkpoint inhibitor-refractory cohort.
  • Announced initiation of an investigator-initiated trial with Mayo Clinic for patients with HPV-associated oropharyngeal cancer at high risk of recurrence. The trial will evaluate PDS0101 as monotherapy and in combination with KEYTRUDA®.
  • Announced encouraging preclinical data for the universal flu vaccine that demonstrated a potent neutralization response against multiple strains of the influenza virus and provided protection against infection after challenge with a live H1N1 pandemic strain of influenza in preclinical animal subjects.
  • Granted U.S. Patent Application by the United States Patent and Trademark Office for composition of matter and use of PDS0101, extending its U.S. patent protection into 2037.
  • Achieved enrollment objective of 30 patients in the checkpoint inhibitor refractory arm of the NCI-led triple combination trial in March 2022.
  • Achieved median overall survival at December 31, 2021 of 12 months for 30 HPV16-positive patients who had received at least one evaluation in the NCI-led triple combination trial. Approximately 73% of the patients had failed 3 prior treatment regimens including checkpoint inhibitor therapy.

Full-Year 2021 Financial Results

For the year ended December 31, 2021, the net loss was approximately $16.9 million, or $0.66 per basic share and diluted share, compared to a net loss of approximately $14.8 million, or $0.89 per basic share and diluted share for the year ended December 31, 2020.

For the year ended December 31, 2021, research and development expenses increased to approximately $11.3 million compared to approximately $7.9 million for the year ended December 31, 2020. The increase of $3.4 million was primarily attributable to an increase in regulatory and clinical costs of $2.6 million, non-cash stock-based compensation of $1.1 million and personnel costs of $0.4 million, partially offset by an overall decrease in manufacturing and facility costs of $0.7 million.

For the year ended December 31, 2021, general and administrative expenses increased to approximately $10.2 million compared to approximately $7.0 million for the year ended December 31, 2020. The $3.2 million increase was primarily attributable to an increase in personnel costs of $1.0 million, non-cash stock-based compensation of $2.5 million, and facilities costs of $0.1 million, partially offset by a decrease in professional fees of $0.4 million.

Total operating expenses for the year ended December 31, 2021 were approximately $21.4 million, an increase of approximately 44% compared to total operating expenses of approximately $14.9 million for the year ended December 31, 2020.

The Company’s cash balance as of December 31, 2021 was $65.2 million. Based on the Company’s available cash resources and cash flow projections, the Company believes this balance is sufficient to fund Company operations and research and development programs through the end of 2023.

Conference Call and Webcast
The conference call is scheduled to begin at 8:00 AM EDT on Thursday, March 31, 2022. Participants should dial 877-407-3088 (United States) or 201-389-0927 (International) and mention PDS Biotechnology. A live webcast of the conference call will also be available on the investor relations page of the Company’s corporate website at https://pdsbiotech.com/investors/news-center/events. After the live webcast, the event will be archived on PDS Biotech’s website for six months. 

About PDS Biotechnology
PDS Biotech is a clinical-stage immunotherapy company developing a growing pipeline of molecularly targeted cancer and infectious disease immunotherapies based on the Company’s proprietary Versamune® and Infectimune™ T-cell activating technology platforms. Our Versamune®-based products have demonstrated the potential to overcome the limitations of current immunotherapy by inducing in vivo, large quantities of high-quality, highly potent polyfunctional tumor specific CD4+ helper and CD8+ killer T-cells. PDS Biotech has developed multiple therapies, based on combinations of Versamune® and disease-specific antigens, designed to train the immune system to better recognize diseased cells and effectively attack and destroy them.  The Company’s pipeline products address various cancers including HPV16-associated cancers (anal, cervical, head and neck, penile, vaginal, vulvar) and breast, colon, lung, prostate and ovarian cancers.  

Our Infectimune™ -based vaccines have demonstrated the potential to induce not only robust and durable neutralizing antibody responses, but also powerful T-cell responses including long-lasting memory T-cell responses. To learn more, please visit www.pdsbiotech.com or follow us on Twitter at @PDSBiotech.

Forward Looking Statements
This communication contains forward-looking statements (including within the meaning of Section 21E of the United States Securities Exchange Act of 1934, as amended, and Section 27A of the United States Securities Act of 1933, as amended) concerning PDS Biotechnology Corporation (the “Company”) and other matters. These statements may discuss goals, intentions and expectations as to future plans, trends, events, results of operations or financial condition, or otherwise, based on current beliefs of the Company’s management, as well as assumptions made by, and information currently available to, management. Forward-looking statements generally include statements that are predictive in nature and depend upon or refer to future events or conditions, and include words such as “may,” “will,” “should,” “would,” “expect,” “anticipate,” “plan,” “likely,” “believe,” “estimate,” “project,” “intend,” “forecast,” “guidance”, “outlook” and other similar expressions among others. Forward-looking statements are based on current beliefs and assumptions that are subject to risks and uncertainties and are not guarantees of future performance. Actual results could differ materially from those contained in any forward-looking statement as a result of various factors, including, without limitation: the Company’s ability to protect its intellectual property rights; the Company’s anticipated capital requirements, including the Company’s anticipated cash runway and the Company’s current expectations regarding its plans for future equity financings; the Company’s dependence on additional financing to fund its operations and complete the development and commercialization of its product candidates, and the risks that raising such additional capital may restrict the Company’s operations or require the Company to relinquish rights to the Company’s technologies or product candidates; the Company’s limited operating history in the Company’s current line of business, which makes it difficult to evaluate the Company’s prospects, the Company’s business plan or the likelihood of the Company’s successful implementation of such business plan; the timing for the Company or its partners to initiate the planned clinical trials for PDS0101, PDS0203 and other Versamune and Infectimune-based product candidates; the future success of such trials; the successful implementation of the Company’s research and development programs and collaborations, including any collaboration studies concerning PDS0101, PDS0203 and other Versamune and Infectimune-based product candidates and the Company’s interpretation of the results and findings of such programs and collaborations and whether such results are sufficient to support the future success of the Company’s product candidates; the success, timing and cost of the Company’s ongoing clinical trials and anticipated clinical trials for the Company’s current product candidates, including statements regarding the timing of initiation, pace of enrollment and completion of the trials (including the Company’s ability to fully fund its disclosed clinical trials, which assumes no material changes to our currently projected expenses), futility analyses, presentations at conferences and data reported in an abstract, and receipt of interim results (including, without limitation, any preclinical results or data), which are not necessarily indicative of the final results of the Company’s ongoing clinical trials; any Company statements about its understanding of product candidates mechanisms of action and interpretation of preclinical and early clinical results from its clinical development programs and any collaboration studies; and other factors, including legislative, regulatory, political and economic developments not within the Company’s control, including unforeseen circumstances or other disruptions to normal business operations arising from or related to COVID-19. The foregoing review of important factors that could cause actual events to differ from expectations should not be construed as exhaustive and should be read in conjunction with statements that are included herein and elsewhere, including the risk factors included in the Company’s annual and periodic reports filed with the SEC. The forward-looking statements are made only as of the date of this press release and, except as required by applicable law, the Company undertakes no obligation to revise or update any forward-looking statement, or to make any other forward-looking statements, whether as a result of new information, future events or otherwise.

Versamune® is a registered trademark and Infectimune is a trademark of PDS Biotechnology. KEYTRUDA® is a registered trademark of Merck Sharp & Dohme Corp., a subsidiary of Merck & Co., Inc., Kenilworth, NJ, USA.

Investor Contact:
Rich Cockrell
CG Capital
Phone: +1 (404) 736-3838
Email: rich@cg.capital


PDS BIOTECHNOLOGY CORPORATION AND SUBSIDIARY
Consolidated Balance Sheets

  December 31,
2021
  December 31,
2020
ASSETS      
Current assets:      
Cash and cash equivalents $ 65,242,622     $ 28,839,565  
Prepaid expenses and other   1,597,569       1,497,665  
Total current assets   66,840,191       30,337,230  
           
Property and equipment, net   86       5,443  
Operating lease right-to-use asset   357,611       547,706  
           
Total assets $ 67,197,888     $ 30,890,379  
           
LIABILITIES AND STOCKHOLDERS’ EQUITY          
Current liabilities:          
Accounts payable $ 1,309,403     $ 1,415,224  
Accrued expenses   2,187,704       1,735,322  
Operating lease obligation – short term   258,924       119,904  
Total current liabilities   3,756,031       3,270,450  
           
Noncurrent liability:          
Operating lease obligation – long term   231,430       490,353  
Total liabilities   3,987,461       3,760,803  
           
STOCKHOLDERS’ EQUITY          
Common stock, $0.00033 par value, 75,000,000 shares authorized at December 31, 2021 and
December 31, 2020, 28,448,612 shares and 22,261,619 shares issued and outstanding at
December 31, 2021 and December 31, 2020, respectively
  9,387       7,346  
Additional paid-in capital   123,904,602       70,907,315  
Accumulated deficit   (60,703,562 )     (43,785,085 )
Total stockholders’ equity   63,210,427       27,129,576  
           
Total liabilities and stockholders’ equity $ 67,197,888     $ 30,890,379  


PDS BIOTECHNOLOGY CORPORATION AND SUBSIDIARY
Consolidated Statements of Operations and Comprehensive Loss

  Year Ended December 31,
  2021     2020  
Operating expenses:      
Research and development expenses $ 11,254,538     $ 7,924,450  
General and administrative expenses   10,184,773       6,977,936  
Total operating expenses   21,439,311       14,902,386  
           
Loss from operations   (21,439,311 )     (14,902,386 )
           
Other income          
Interest income   4,346       55,006  
           
Loss before income taxes   (21,434,965 )     (14,847,380 )
Benefit from income taxes   4,516,488        
Net loss and comprehensive loss $ (16,918,477 )   $ (14,847,380 )
           
Per share information:          
Net loss per share, basic and diluted $ (0.66 )   $ (0.89 )
           
Weighted average common shares outstanding basic and diluted   25,597,125       16,745,044  


PDS BIOTECHNOLOGY CORPORATION AND SUBSIDIARY
Consolidated Statements of Cash Flows


  Year Ended December 31,
  2021     2020  
Cash flows from operating activities:      
Net loss $ (16,918,477 )   $ (14,847,380 )
Adjustments to reconcile net loss to net cash used in operating activities:            
Stock-based compensation expense   4,074,458       432,321  
Stock-based 401K company common match   35,747       19,967  
Depreciation expense   5,357       15,608  
Operating lease expense   241,031       160,684  
Changes in operating assets and liabilities:              
Prepaid expenses and other assets   (99,904 )     810,797  
Accounts payable   (105,821 )     217,504  
Accrued expenses   452,382       637,682  
Restructuring reserve         (498,185 )
Operating lease liabilities   (170,839 )     (98,133 )
Net cash used in operating activities   (12,486,066 )     (13,149,135 )
           
           
Cash flows from financing activities:          
Proceeds from exercise of warrants         70,459  
Proceeds from exercise of stock options   344,125        
Proceeds from issuances of common stock, net of issuance costs   48,544,998       29,756,502  
Net cash provided by financing activities   48,889,123       29,826,961  
               
Net increase in cash and cash equivalents   36,403,057       16,677,826  
Cash and cash equivalents at beginning of period   28,839,565       12,161,739  
               
Cash and cash equivalents at end of period $ 65,242,622     $ 28,839,565  
             

What is the PCE Price Index (In 500 Words or Less)?


The Lesser-Known Inflation Indicator is Preferred By Fed Officials


Most people quote inflation based on the Bureau of Labor Statistics Consumer Price Index or CPI.  But the metric the Federal Reserve is said to find more valuable is the Personal Consumption Expenditures Price Index, or PCE Price Index.

What is it that makes this measure considered more relevant to gauge inflation, and economic impact?

First, the number is composed of a very broad range of expenditures far broader than CPI. The PCE Price Index is also weighted by data reported through business surveys. Businesses account for and document transactions far better than households. CPI is consumer or household-based.

While CPI is based on a basket of goods and services that is revised infrequently, The PCE Price Index uses a formula that allows for changes in consumer behavior and changes that occur in the short term. For example, if gas prices rise and consumers drive less or switch to a lower octane fuel, this information is more useful than just noting that gas prices are up. These adjustments in consumer behavior are not made in the CPI calculation. This makes the PSE Price Index a more comprehensive metric for measuring price changes that impact the economy.


Advantages / Disadvantages of PCE Price Data

Personal consumption expenditures provide a glimpse of how the economy is going. When people are spending without any hesitation, it usually means that the economy is doing well. But when they cut back, it points to problems in the overall economic picture. Monitoring whether consumers are increasing spending, decreasing, or finding replacements that are less expensive is meaningful to recognizing and forecasting trends. This helps the Fed assess economic needs that may be assisted through monetary policy.

Source: Bureau of Economic Analysis


Stay up to date. Follow us:


Information Services (III) – Expanding The Platform

Wednesday, March 30, 2022

Information Services (III)
Expanding The Platform

ISG (Information Services Group) (Nasdaq: III) is a leading global technology research and advisory firm. A trusted business partner to more than 700 clients, including more than 70 of the top 100 enterprises in the world, ISG is committed to helping corporations, public sector organizations, and service and technology providers achieve operational excellence and faster growth. The firm specializes in digital transformation services, including automation, cloud and data analytics; sourcing advisory; managed governance and risk services; network carrier services; strategy and operations design; change management; market intelligence and technology research and analysis. Founded in 2006, and based in Stamford, Conn., ISG employs more than 1,300 digital-ready professionals operating in more than 20 countries—a global team known for its innovative thinking, market influence, deep industry and technology expertise, and world-class research and analytical capabilities based on the industry’s most comprehensive marketplace data. For more information, visit www.isg-one.com

Joe Gomes, Senior Research Analyst, Noble Capital Markets, Inc.

Joshua Zoepfel, Research Associate, Noble Capital Markets, Inc.

Refer to the full report for the price target, fundamental analysis, and rating.

    A New Acquisition. ISG’s management announced yesterday the acquisition of privately-held Agreemint, an automated contracting solution company. A partner to ISG since 2021, Agreemint’s AI-powered contracting platform brings important new capabilities to the market-leading ISG GovernX vendor compliance and risk management solution and will be used by ISG to add value to future platform solutions now in development.

    What is Agreemint? As mentioned, Agreemint is a contracting solution company that uses AI to deliver automated contract authoring through a repository of legal positions to speed the process to contract.  Through its AI functionality, it enables users to negotiate better contracts, as it suggests language that is legal, governable, and agreeable to both parties, as well as anticipates language …


This Company Sponsored Research is provided by Noble Capital Markets, Inc., a FINRA and S.E.C. registered broker-dealer (B/D).

*Analyst certification and important disclosures included in the full report. NOTE: investment decisions should not be based upon the content of this research summary. Proper due diligence is required before making any investment decision. 


Ayala Pharmaceuticals (AYLA) – Ayala Reports FY21 and Reiterates Trial Data Expectations

Wednesday, March 30, 2022

Ayala Pharmaceuticals (AYLA)
Ayala Reports FY21 and Reiterates Trial Data Expectations

Ayala Pharmaceuticals Inc clinical-stage oncology company focused on developing and commercializing small molecule therapeutics for patients suffering from rare and aggressive cancers, primarily in genetically defined patient populations. The company’s current portfolio of product candidates, AL101 and AL102, targets the aberrant activation of the Notch pathway with gamma secretase inhibitors. Its product candidate, AL101, is being developed as a potent, selective, injectable small molecule gamma secretase inhibitor, or GSI. It is also developing AL101 for the treatment of T-ALL, an aggressive, rare form of T-cell specific leukemia.

Robert LeBoyer, Vice President, Research Analyst, Life Sciences, Noble Capital Markets, Inc.

Refer to the full report for the price target, fundamental analysis, and rating.

    Ayala Reported FY2021 Within Expectations Ayala Reported FY2021 loss of $40.3 million or $(2.80) per share.  This compares with our estimate of a loss of $40.9 million or $(3.00) per share, as both R&D and General Expenses were slightly below our estimates. Cash balance on December 31 was $37.3 million.

    One New Study Testing AL101 Is Underway, Another To Begin In 2H22.  The “Window of Opportunity” study testing AL101 in ACC (adenoid cystic carcinoma) has begun treating patients prior to surgery and radiation therapy. This is intended to reduce recurrence rates and improve long-term survival, as well as to define the mechanism and effects of AL101 on cancer. Separately, the Phase 2 trial in T-ALL …


This Company Sponsored Research is provided by Noble Capital Markets, Inc., a FINRA and S.E.C. registered broker-dealer (B/D).

*Analyst certification and important disclosures included in the full report. NOTE: investment decisions should not be based upon the content of this research summary. Proper due diligence is required before making any investment decision. 


Alliance Resource Partners (ARLP) – Cash Flow Above All Else

Wednesday, March 30, 2022

Alliance Resource Partners (ARLP)
Cash Flow Above All Else

Alliance Resource Partners LP operates as a coal mining company based in the United States. It functions through threesegments; Illinois Basin, Appalachia, and and Minerals. The Illinois Basin activity comprises of underground mining complexes in Illinois, Indiana, Kentucky, Maryland and West Virginia and it makes up for most of the company’s revenue-generating operations. The Appalachia segment, on the other hand, consists of multiple operating segments, including the Mettiki mining complex, the Tunnel Ridge mining complex and the MC Mining mining complex. The Minerals segment includes oil & gas mineral interests held by AR Midland and AllDale I & II.

Mark Reichman, Senior Research Analyst of Natural Resources, Noble Capital Markets, Inc.

Refer to the full report for the price target, fundamental analysis, and rating.

    Initiating coverage.  Alliance Resource Partners is a diversified natural resource company that generates revenue from the production and marketing of coal, and royalty income from coal, oil, and gas mineral interests located in favorable producing regions across the United States. Strong cash flows generated by the company’s operations are expected to support continued growth in its oil and natural gas royalty business, along with diversification into green energy sources that may include strategic minerals and metals, electric vehicle charging infrastructure, wind, and/or solar.

    Strong cash flow growth profile.  Demand for coal, oil, and gas remains robust and prices have risen in recent quarters. Free cash flow in 2021 was $302.2 million, well above capital expenditures of $123 million. In 2021, Alliance paid down over $100 million of debt and recently increased its quarterly cash distribution to unitholders by 25% to $0.25 per unit, or $1.00 on an annualized basis …


This Company Sponsored Research is provided by Noble Capital Markets, Inc., a FINRA and S.E.C. registered broker-dealer (B/D).

*Analyst certification and important disclosures included in the full report. NOTE: investment decisions should not be based upon the content of this research summary. Proper due diligence is required before making any investment decision. 


What is a Stock Split


Why Stocks Split and the Possible Impact to Investors


Reason for a Company to Split its Stock

When stocks split, it is most often a decision by the company to lower its trading price range to a level small enough to attract more investors and enhance the liquidity of trading in its shares.

Variations of Splits

A company’s board of directors may decide to split the stock by any ratio. For example, the most common is 2:1 (the stockholder receives two shares for each one they own), but 3:1, even 5:1 is not uncommon. In a 2:1 split there will be double the amount of shares trading, the price per share will approximate half of what it was before the split.

Impact to Market Cap

Market capitalization is calculated by multiplying the total number of shares outstanding by the price per share. For example, if XYZ Corp. has 10 million shares outstanding and the shares are trading at $20 Its market cap will be 200 million. If the company’s board of directors decides to split the stock 2:1 the number of shares outstanding would double to 20 million, while the share price would be roughly halved to $10.

Reasons for a Stock Split

The decision to go through the administrative expense is usually based on one or two of the following:

First, stocks traditionally traded in “round-lots” of 100 and multiples of 100. Companies often decide on a split when the stock price has reached a level where it is preventing those that the company would most likely want as owners from investing in round-lots.  

Second, the lower priced, higher number of shares outstanding can result in greater liquidity for the stock. This is because it facilitates transactions and could narrow the spread between bid and offer.

Increased liquidity helps owners large and small find buyers when they are looking to sell, and sellers when they are looking to buy. With high liquidity, a large number of shares can be traded without much impact on price levels. While this is positive for all who transact in the shares, companies that may look to repurchase their shares also don’t have as much concern about escalating the price they’re paying. Management can also exercise their ability to sell large amounts they may have acquired as part of their compensation without causing the price to plummet.

Stock Price

While a split, in theory, should have no effect on a stock’s price, it often results in renewed investor interest, which can have a positive effect. Stock splits by large heavily traded companies are often bullish for their market capitalization numbers, and positive for investors.

When You Own Shares

When a stock you own splits, shareholders of record are credited with their additional shares. For instance, in a 2:1 stock split, if you owned 100 shares that were trading at $20 just before the split, you would then own 200 shares at about $10 each. Your broker would handle this automatically, so there is nothing you need to do.

Will a Stock Split Affect My Taxes?

No. The cost basis of each share owned after the stock split will be half of what it was before the split for tax purposes.


Are Stock Splits Good or Bad?

Stock splits are usually done when the share price has risen so high that it might reduce trading. This means investors were driving the company valuation higher. So splits often happen in healthy growing companies. Plus, a stock that has just split may see an uptick in interest as it attracts new investors at the lower price tag per share.


Suggested Reading


What is Fed Tightening?


What is the Yield Curve?


Stay up to date. Follow us:


Robinhood Launching Extended Hours


Robinhood Continues to Push to Expand Their Users’ Possibilities


Robinhood (HOOD) has taken another step toward users having the ability to trade from their platform around the clock, seven days a week. It announced that the online brokerage service is extending its premarket and after-hours trading to provide a 13-hour window. Robinhood’s stated mission has always been to revolutionize the markets and bring more people into the financial system. Yesterday’s (March 29) announcement is another step toward that goal.

The company said this is an important step toward 24/7 equities investing; their new extended hours will allow users to trade from 7 am until 8pm. This adds four hours for users to transact. Its extended trading hours had been from 9 am to 9:30 am. ET and 4 pm to 6 pm ET.

 In a Blog post the online stockbroker that introduced transaction free trades in 2014, added crypto in 2018, fractional shares in 2019, automatic investments in 2020, and 24/7 customer support in 2021 said about their mission to revolutionize the markets, “Today’s launch is just another step on this journey, and we’re just getting started.”


Robinhood has studied their data and said that they have, “…seen a community of Robinhood early birds and night owls who log in exclusively outside of regular market hours.” They believe the new extended trading hours, leading toward 24/7, will provide more opportunities to more customers to manage their portfolio at a convenient time for them.

The stock jumped 24%, its third-best trading day since the company went public last summer.

A Word of Caution

Trading is typically thinner pre and post-market. While access may be helpful, until there are a large number of transactions taking place, extended-hours trading can be riskier than the regular session. At the same time, it may also provide opportunities or dislocations worth considering. These risks would presumably lessen as extended hours volume increases.

Paul Hoffman

Managing Editor, Channelchek


Suggested Reading


Regulators May Add New Guard Rails to Temper Investment Risk


AMC Entertainment’s Plot Twist Gets Even More Interesting to Investors


Sources

https://robinhood.com/us/en/support/articles/extendedhours-trading/

https://blog.robinhood.com/


Stay up to date. Follow us:


The Yield Curve as a Leading Indicator Has Been Compromised


What is an Inverting Yield Curve and Does it Mean We’re Heading for a Recession?


One key predictor of downturns in the economy is what is known as the yield curve. This typically refers to the market for what the US government borrows, by issuing bonds and other securities that mature over different time horizons ranging from weeks to 30 years.

Each of these securities has its own yield (or interest rate), which moves up and down in inverse proportion to the security’s market value – so when bonds are trading at high prices, their yields will be low and vice versa. You can draw a chart that plots the yields of securities at each maturity date to see how they relate to one another, and this is known as the yield curve.

In normal times, as compensation for higher risk, investors expect higher rates of interest for money they lend over a longer time horizon. To reflect this, the yield curve normally slopes up. When it instead slopes down – in other words, when it inverts – it is a sign that investors are more pessimistic about the long term than the short term: they think a downturn or a recession is coming soon.

This is because they expect the Federal Reserve, the US central bank, is going to cut short-term interest rates in the future to stimulate a struggling economy (as opposed to raising rates to cool down an economy that is overheating).

Most closely watched is the relationship between two-year and ten-year US treasury debt. The so-called spread between these two metrics can be seen in the chart below, with the gray areas indicating recessions that have followed shortly after.


Spread Between Two-Year and Ten-Year Treasuries


Source: St Louis Fed


As you can see, the yields of these two securities are getting very close to being the same, and the trend suggests that the two-year could soon have a higher yield – meaning the curve is inverting. The key question is, does an inverted yield curve hint at an upcoming downturn? Not necessarily. Let me explain why.

Inflation Expectations

One complication is that bond yields don’t only reflect what investors think about future economic growth. They also buy or sell debt securities depending on what they think is going to happen to inflation. It’s generally assumed that prices will rise in the years ahead, and investors need to be compensated for bearing that risk since higher inflation will erode their future purchasing power. For this reason, bond yields contain an element of inflation premium, normally with an increasingly higher premium for bonds with longer maturity dates.

The following chart shows the spread between the inflation expectations built into 10-year and 2-year Treasuries. The fact that it is in negative territory suggests the market thinks that inflation may fall, and this may also explain why yields on longer-dated Treasuries are lower than on shorter-dated ones. And although inflation would fall in the event of an economic slowdown or recession, there could be a situation where inflation fell but the economy remained buoyant. Hence a yield curve inversion doesn’t have to mean that we are up against an imminent recession.


Inflation Expectations (Ten-Year vs. Two-Year Treasuries)


Source: St Louis Fed


Quantitative Easing

Another factor that is potentially affecting the yield curve is the Federal Reserve’s moves to buy government debt as part of its quantitative easing program (QE). The idea behind QE is that by buying long-term bonds, the Fed is able to keep long-term interest rates low, which decreases the rates on mortgages and other loans, thereby stimulating the economy. Conversely, when sold, lending rates will go up and economic activity will be reduced.

Earlier in March, the Fed started raising the benchmark US interest rate and stopped the asset purchases under the QE program that it launched in 2020 in response to the COVID pandemic. But it also indicated that it would only start selling these assets after several months of hiking the benchmark rate. Since the benchmark rate is a short-term rate, the yield curve inverting might indicate market expectations that short-term interest rates will be higher than long-term ones for the foreseeable future.


Which Yield Curve Should We Consider?

It is also sometimes argued that two-year/ten-year spreads are not the most useful relationships to watch and that instead, one should focus on yields at the shorter end of the yield curve. In this setup, if you look at the difference in yields between two-year and three-month treasuries, it is actually steepening: in other words, it is hinting that economic growth is going to increase in the short term.

Economists sometimes argue that these near-term yield curve movements have stronger predictive power than those further out. At the very least, the fact that these are saying something different shows the need to be careful because different data about treasury yields can depict a different (or even opposite) picture depending on what time horizon you are considering.


Spread Between Two-Year and Three-Month Treasury Yields


Source: St Louis Fed

To summarise, it doesn’t necessarily follow that an inverted yield curve will be followed by a recession. It certainly could mean that, in which case unemployment would likely rise and inflation would potentially come down more quickly than many are expecting. But for now, it’s too early to say. The debt market is certainly signaling that change is coming, though it’s often easier to say in hindsight what it meant in hindsight.


This article was republished with permission from The Conversation, a news site dedicated to sharing ideas from academic experts. It represents the research-based findings and thoughts of Luciano Rispoli Teaching Fellow in Economics, University of Surrey.


Suggested Reading


How Rising Rates Could Make Brokers Like Robinhood More Profitable


The Detrimental Impact of Fed Policy on Savers


Was the Inflation of 1982 Like Today’s?


What is the Yield Curve?


Stay up to date. Follow us:


Release – QuoteMedia Announces 22 Revenue Growth for 2021


QuoteMedia Announces 22% Revenue Growth for 2021

Research, News, and Market Data on QuoteMedia


PHOENIX, March 30, 2022 (GLOBE NEWSWIRE) — QuoteMedia, Inc. (OTCQB: QMCI), a leading provider of market data and financial applications, announced financial results for the fiscal year ended December 31, 2021.

QuoteMedia provides banks, brokerage firms, private equity firms, financial planners and sophisticated investors with a more economical, higher quality alternative source of stock market data and related research information. We compete with several larger legacy organizations and a modest community of other smaller companies.  QuoteMedia provides comprehensive market data services, including streaming data feeds, on-demand request-based data (XML/JSON), web content solutions (financial content for website integration) and applications such as Quotestream Professional desktop and mobile.

Highlights for fiscal 2021 include the following:

  • Annual revenue increased to $15,174,372 in 2021 from $12,402,224 in 2020, an increase of $2,772,148 (22%).
  • Net income for 2021 was $212,372 compared to a net loss of $646,324 in 2020, an improvement in profitability of $858,696.
  • Adjusted EBITDA for 2021 was $1,649,679 compared to $734,068 in 2020, an improvement of $915,611.

“This was an enormously successful year for QuoteMedia, and we are very pleased with our results,” said Robert J. Thompson, Chairman of the Board. “We experienced strong growth across virtually every success metric, including revenue growth, profitability and market share; and we also grew and improved our product lines, data coverage and infrastructure. We are even more excited about the year to come, as we expect to maintain this momentum and improve upon the results we achieved in 2022.

“2022 has started on a positive footing. QuoteMedia entered into preliminary agreements with two large multinational financial institutions to start a range of services while definitive multi-year agreements are being finalized. Based on those new contracts and our other clients currently under contract, we expect our revenue growth in fiscal 2022 to be comparable to the 22% annual revenue growth rate we achieved in 2021; and we expect to significantly improve upon the $212,372 net income figure reported in 2021.

“Additionally, because of the efforts and investments we made to improve our infrastructure, security, and business continuity management over the last year, we anticipate achieving our SOC2 Type II certification in the coming months. SOC2 certification provides independent assurance that an organization maintains a high level of information security, data integrity and business resiliency. This certification will allow QuoteMedia to make even greater gains in market share, as it is increasingly becoming a requirement for those providing services to large financial institutions.

“2021 was a very good year for QuoteMedia, and 2022 looks like it may be even better.”

QuoteMedia will host a conference call Wednesday, March 30, 2022 at 2:00 PM Eastern Time to discuss the 2021 financial results and provide a business update.

Conference Call Details:

Date: March 30, 2022

Time: 2:00 PM Eastern

Dial-in number: 866-831-8713

Conference ID: QUOTEMEDIA

An audio rebroadcast of the call will be available later at: www.quotemedia.com

About QuoteMedia

QuoteMedia is a leading software developer and cloud-based syndicator of financial market information and streaming financial data solutions to media, corporations, online brokerages, and financial services companies. The Company licenses interactive stock research tools such as streaming real-time quotes, market research, news, charting, option chains, filings, corporate financials, insider reports, market indices, portfolio management systems, and data feeds. QuoteMedia provides industry leading market data solutions and financial services for companies such as the Nasdaq Stock Exchange, TMX Group (TSX Stock Exchange), Canadian Securities Exchange (CSE), London Stock Exchange Group, FIS, U.S. Bank, Broadridge Financial Systems, JPMorgan Chase, CI Financial, Canaccord Genuity Corp., Hilltop Securities, HD Vest, Stockhouse, Zacks Investment Research, General Electric, Boeing, Bombardier, Telus International, Business Wire, PR Newswire, FolioFN, Regal Securities, ChoiceTrade, Cetera Financial Group, Dynamic Trend, Inc., Qtrade Financial, CNW Group, IA Private Wealth, Ally Invest, Inc., Suncor, Virtual Brokers, Leede Jones Gable, Firstrade Securities, Charles Schwab, First Financial, Cirano, Equisolve, Stock-Trak, Mergent, Cision, Day Trade Dash and others. Quotestream®, QModTM and Quotestream ConnectTM are trademarks of QuoteMedia. For more information, please visit www.quotemedia.com .

Statements about QuoteMedia’s future expectations, including future revenue, earnings, and transactions, as well as all other statements in this press release other than historical facts are “forward-looking statements” within the meaning of the Private Securities Litigation Reform Act of 1995. QuoteMedia intends that such forward-looking statements be subject to the safe harbors created thereby. These statements involve risks and uncertainties that are identified from time to time in the Company’s SEC reports and filings and are subject to change at any time. QuoteMedia’s actual results and other corporate developments could differ materially from that which has been anticipated in such statements.

Below are the specific forward-looking statements included in this press release:

  • Based on those new contracts and our other clients currently under contract, we expect our revenue growth in fiscal 2022 to be comparable to the 22% annual revenue growth rate we achieved in 2021; and we expect to significantly improve upon the $212,372 net income figure reported in 2021.
  • Additionally, because of the efforts and investments we made to improve our infrastructure, security, and business continuity management over the last year, we anticipate achieving our SOC2 Type II certification in the coming months. SOC2 certification provides independent assurance that an organization maintains a high level of information security, data integrity and business resiliency. This certification will allow QuoteMedia to make even greater gains in market share, as it is increasingly becoming a requirement for those providing services to large financial institutions.
  • 2021 was a very good year for QuoteMedia, and 2022 looks like it may be even better.

QuoteMedia Investor Relations
Brendan Hopkins
Email: investors@quotemedia.com
Call: (407) 645-5295

Note 1 on Non-GAAP Financial Measures

We believe that Adjusted EBITDA, as a non-GAAP pro forma financial measure, provides meaningful information to investors in terms of enhancing their understanding of our operating performance and results, as it allows investors to more easily compare our financial performance on a consistent basis compared to the prior year periods. This non-GAAP financial measure also corresponds with the way we expect investment analysts to evaluate and compare our results. Any non-GAAP pro forma financial measures should be considered only as supplements to, and not as substitutes for or in isolation from, or superior to, our other measures of financial information prepared in accordance with GAAP, such as net income attributable to QuoteMedia, Inc.

We define and calculate Adjusted EBITDA as net income attributable to QuoteMedia, Inc., plus: 1) depreciation and amortization, 2) stock compensation expense, 3) interest expense, 4) foreign exchange loss (or minus a foreign exchange gain), and 5) income tax expense. We disclose Adjusted EBITDA because we believe it is a useful metric by which to compare the performance of our business from period to period. We understand that measures similar to Adjusted EBITDA are broadly used by analysts, rating agencies, investors and financial institutions in assessing our performance. Accordingly, we believe that the presentation of Adjusted EBITDA provides useful information to investors. The table below provides a reconciliation of Adjusted EBITDA to net income attributable to QuoteMedia, Inc., the most directly comparable GAAP financial measure.

QuoteMedia, Inc. Adjusted EBITDA Reconciliation to Net Loss

2021 2020
Net income (loss) $ 212,372 $ (646,324 )
Depreciation and amortization 1,640,245 1,331,910
Stock-based compensation 31,876 37,872
Interest expense 2,641 4,582
Foreign exchange loss (107,382 ) 3,791
Income tax expense 3,184 2,237
PPP loan forgiveness (133,257 )
Adjusted EBITDA $ 1,649,679 $ 734,068