Grindrod Shipping (GRIN) – Price Weakness Creates Attractive Opportunity

Tuesday, March 08, 2022

Grindrod Shipping (GRIN)
Price Weakness Creates Attractive Opportunity

Grindrod Shipping, originated in South Africa with roots dating back to 1910. The company is based in Singapore, with offices around the world including, London, Durban, Cape Town, Tokyo and Rotterdam. Its primary listing is on Nasdaq and secondary listing on the JSE.

Grindrod Shipping owns and operates a diversified fleet of owned, long-term chartered and joint-venture dry-bulk and liquid-bulk vessels across the globe.

Poe Fratt, Senior Research Analyst, Logistics, Noble Capital Markets, Inc.

Refer to the full report for the price target, fundamental analysis, and rating.

    Recent stock price weakness warranted? We don’t think so and see no fundamental reason for the more than 12% drop, including more than 6% yesterday, seen since hitting a multi-year high of $27.10 last Thursday. The weakness is even more surprising since a competitor highlighted solid Supra market fundamentals last Friday.

    Positive bias to 2022 EBITDA and dividend estimates.  Due to strong 4Q2021 results, high 1Q2022 forward cover and management color on the recent earnings call, our 2022 EBITDA estimate is $202.0 million based on TCE rates of $25.5k/day for Supras/Ultras and $22.1k/day for Handys. 1Q2022 is off to a good start with forward cover of 1,474 Supra/Ultra operating days booked at $24.4k/day and 1,103 Handy …


This Company Sponsored Research is provided by Noble Capital Markets, Inc., a FINRA and S.E.C. registered broker-dealer (B/D).

*Analyst certification and important disclosures included in the full report. NOTE: investment decisions should not be based upon the content of this research summary. Proper due diligence is required before making any investment decision. 

Vectrus (VEC) – A Transformational Combination Reports 4Q21 Results

Tuesday, March 08, 2022

Vectrus (VEC)
A Transformational Combination; Reports 4Q21 Results

Vectrus Inc is a U.S.-based company that provides services to the U.S. government. It operates as one segment and offer facility and logistics services and information technology and network communications services. The information technology and network communications capabilities consist of communications systems operations and maintenance, management and service support, systems installation and activation, system-of-systems engineering and software development, and mission support for the department of defense. The facility and logistics service include airfield management, ammunition management, civil engineering, communications, emergency services, life support activities, public works, security, transportation operations and others.

Joe Gomes, Senior Research Analyst, Noble Capital Markets, Inc.

Joshua Zoepfel, Research Associate, Noble Capital Markets, Inc.

Refer to the full report for the price target, fundamental analysis, and rating.

    Vertex Combination. Yesterday, Vectrus announced it is combining with The Vertex Company in an all-stock merger that values Vertex at $2.1 billion. The combined company will offer significantly expanded technology and service capabilities, delivering a comprehensive suite of integrated solutions and critical service offerings to support national security readiness and modernization initiatives around the world.

    Through the $2.5 billion, 7% Margin Goal.  With pro forma 2021 combined revenue of $3.4 billion and adjusted EBITDA of $283 million, or an 8.3% margin, Vectrus will exceed its $2.5 billion, 7% adjusted EBITDA margin goal. Significantly, the combined entity’s $11.3 billion backlog provides high revenue visibility with the potential of increased adjusted EBITDA margin going forward …


This research is provided by Noble Capital Markets, Inc., a FINRA and S.E.C. registered broker-dealer (B/D).

*Analyst certification and important disclosures included in the full report. NOTE: investment decisions should not be based upon the content of this research summary. Proper due diligence is required before making any investment decision. 

Indonesia Energy Corp (INDO) – Rating lowered in response to meteoric rise in stock price

Tuesday, March 08, 2022

Indonesia Energy Corp (INDO)
Rating Lowered In Response To Meteoric Rise In Stock Price

Indonesia Energy Corp Ltd is an oil and gas exploration and production company focused on Indonesia. It holds two oil and gas assets through its subsidiaries in Indonesia: one producing block (the Kruh Block) and one exploration block (the Citarum Block). The Kruh Block is located to the northwest of Pendopo, Pali, South Sumatra. The Citarum Block is located to the south of Jakarta.

Michael Heim, Senior Research Analyst, Noble Capital Markets, Inc.

Refer to the full report for the price target, fundamental analysis, and rating.

    The shares of INDO have risen from $2.90 at the beginning of the year to $62.46 (up 2054%) briefly trading above $86 at one point. Most of the rise has come in the last five trading days with the stock beginning last week at $13.30. The impetus for the rise was a jump in oil prices (up from $101 to $120 last five trading days). However, the jump in the shares of INDO far surpasses that justified by the rise in oil prices. We would remind investors that there is little to report recently from an operational point of view regarding the company.

    The stock price has soared past our price target of $15, which was raised just last Tuesday.  We warned at the time of our price target increase that the shares of INDO are thinly traded and can be volatile. We also said that the increase in our price target was using up our gun powder and that future target increases would be difficult. Now that the stock has risen to a level more than five times …


This Company Sponsored Research is provided by Noble Capital Markets, Inc., a FINRA and S.E.C. registered broker-dealer (B/D).

*Analyst certification and important disclosures included in the full report. NOTE: investment decisions should not be based upon the content of this research summary. Proper due diligence is required before making any investment decision. 

Release – Avivagen Secures New Influential Customer in Mexico


Avivagen Secures New Influential Customer in Mexico

Research, News, and Market Data on Avivagen


Ottawa, ON /Business Wire/ March 8, 2022 /– Avivagen Inc.  (TSXV:VIV, OTCQB:VIVXF) (“Avivagen”), a life sciences corporation focused on developing and commercializing products for livestock, companion animal and human applications that safely enhances feed intake and supports immune function, thereby supporting general health and performance, is pleased to announce that a large, influential and industry-leading poultry producer in Mexico has placed an order for its OxC-beta Livestock™ product, through Avivagen’s Mexican consultant Meyenberg International Group.

The sale follows a successful customer evaluation trial confirming that OxC-betaTM Livestock increased productivity, flock health, uniformity and improved skin pigmentation within its operations. This small initial order is expected to be delivered in Q2.  Based on discussions with the customer, Avivagen anticipates receiving increasingly larger orders in the coming quarters as the customer implements OxC-beta in an increasing number of its contract farms.

“This new purchase, while modest,  is continued proof that once large and reputable food producers begin to trial OxC-beta, they consistently see strong results in improved health and production,” says Kym Anthony, Chief Executive Officer, Avivagen. “We’re excited to increase our reach in Mexico, and we expect our relationship with this high-profile customer to grow over the coming months.”

The sale has twofold significance. First, this customer is a relatively large producer with the capacity to regularly use a considerable quantity of OxC-beta in its operations. Thus, they represent an important potential recurring revenue stream for Avivagen. Secondly, the company is a prominent member of ANFACA, a producer association with a large membership based in Jalisco, Mexico. The adoption of OxC-beta in their operations provides other potential customers in the region with validation of the product’s effectiveness under local conditions and will help facilitate additional new sales.

The Mexico Animal feed market is expected to expand to more than US$8 billion by 2025. Growth in the Mexico poultry industry is noted as a key driver of that growth.[i]

About Avivagen
Avivagen is a life sciences corporation focused on developing and commercializing products for livestock, companion animal and human applications that, by safely supporting immune function, promote general health and performance.  It is a public corporation traded on the TSX Venture Exchange under the symbol VIV and is headquartered in Ottawa, Canada, based in partnership facilities of the National Research Council of Canada. For more information, visit www.avivagen.com. The contents of the website are expressly not incorporated by reference in this press release.

About OxC-beta™ Technology and OxC-beta™ Livestock
Avivagen’s OxC-beta™ technology is derived from Avivagen discoveries about ?-carotene and other carotenoids, compounds that give certain fruits and vegetables their bright colours. Through support of immune function the technology provides a non-antibiotic means of promoting health and growth. OxC-beta™ Livestock is a proprietary product shown to be an effective and economic alternative to the antibiotics commonly added to livestock feeds. The product is currently available for sale in the United States, Philippines, Mexico, Taiwan, New Zealand, Thailand, Brazil, Australia, and Malaysia.

Avivagen’s OxC-beta™ Livestock product is safe, effective and could fulfill the global mandate to remove all in-feed antibiotics as growth promoters. Numerous international livestock trials with poultry and swine using OxC-beta™ Livestock have proven that the product performs as well as, and, sometimes, in some aspects, better than in-feed antibiotics.

Forward Looking Statements
This news release includes certain forward-looking statements that are based upon the current expectations of management. Forward-looking statements involve risks and uncertainties associated with the business of Avivagen Inc. and the environment in which the business operates. Any statements contained herein that are not statements of historical facts may be deemed to be forward-looking, including those identified by the expressions “aim”, “anticipate”, “appear”, “believe”, “consider”, “could”, “estimate”, “expect”, “if”, “intend”, “goal”, “hope”, “likely”, “may”, “plan”, “possibly”, “potentially”, “pursue”, “seem”, “should”, “whether”, “will”, “would” and similar expressions.

Statements set out in this news release relating to the expectations for the new customer to order more and larger orders of Avivagen product, the anticipated benefits of the new customer relationship to Avivagen, future growth and prospects for Avivagen and the possibility for OxC-beta™ Livestock to replace antibiotics in livestock feeds as growth promoters are forward-looking statements. These forward-looking statements are subject to a number of risks and uncertainties that could cause actual results or events to differ materially from current expectations. For instance, the new customer is under no obligation to order Avivagen products in the future and could stop ordering at any time, the benefits Avivagen anticipates from this new customer relationship may not be realized, Avivagen’s products may not gain market acceptance or regulatory approval in new jurisdictions or for new applications and may not be widely accepted as a replacement for antibiotics as growth promoters in livestock feeds due to many factors, many of which are outside of Avivagen’s control.  Readers are referred to the risk factors associated with the business of Avivagen set out in Avivagen’s most recent management’s discussion and analysis of financial condition available at www.SEDAR.com. Except as required by law, Avivagen assumes no obligation to update the forward-looking statements, or to update the reasons why actual results could differ from those reflected in the forward-looking statements.

Neither TSX Venture Exchange nor its Regulation Services Provider (as that term is defined in the policies of the TSX Venture Exchange) accepts responsibility for the adequacy or accuracy of this release.

For more information:
Avivagen Inc.
Drew Basek
Director of Investor Relations
100 Sussex Drive, Ottawa, Ontario, Canada K1A 0R6 Phone: 416-540-0733
E-mail: d.basek@avivagen.com

Kym Anthony
Chief Executive Officer
100 Sussex Drive, Ottawa, Ontario, Canada K1A 0R6 Head Office Phone: 613-949-8164
Website: www.avivagen.com

Source: Avivagen

Release – Defense Metals Corp. Continues to Drill High Grade at Wicheeda


Defense Metals Corp. Continues to Drill High Grade at Wicheeda With 3.23% Total Rare Earth Oxide Over 162 Metres; Including 4.21% Over 45 Metres From Surface

News, and Market Data on Defense Metals


News Release – Vancouver, British Columbia –March 8, 2022:Defense Metals Corp. (“Defense Metals” or the “Company”) (TSX-V:DEFN / OTCQB:DFMTF / FSE:35D) is pleased to announce results for an additional six diamond drill holes totalling 845 metres from the Company’s 29 hole, 5,349 metre diamond drill program completed during fall 2021. Drill holes WI21-39 and WI21-40 collared from the same pad, and holes WI21-41 through WI21-44 sited 100 metres north were designed to further delineate the Wicheeda Rare Earth Element (REE) deposit.

Drill hole WI21-40 returned 3.23% TREO (total rare earth oxide) over 162 metres[1] Along with previously reported drill hole WI21-33 on section grading 3.17% TREO over 196 metres, these two holes yielded the highest-grade x width of the 2021 drill program to date. In addition to significant composite mineralized widths, these holes continue to demonstrate the presence of higher-grade zones of carbonatite at surface and at depth extending below the current resource pit shell.

The Company continues to receive additional assay results from the 2021 Wicheeda REE Deposit resource expansion and delineation campaign that will be released in the coming days and weeks.

Luisa Moreno, President, and Director of Defense Metals commented: “Drilling at depth within the northern Wicheeda Deposit has intersected significant new zones of high-grade REE mineralization with the potential to expand the mineral resource, and importantly may also contribute to supporting higher grades across the range of potential mine life.”

Resource infill drill hole WI21-39 (-60o dip / 285o azimuth) returned assays of 2.62% TREO over 110 metres1andin conjunction with WI21-36 and WI21-37 completes sectional drilling within the northern quarter of the Wicheeda Deposit confirming the presence of high-grade dolomite carbonatite within 2019 near surface drill holes to a vertical depth of 175 metres and horizontal width of 160 metres (Table 1 and Figure 1).

Delineation drill hole WI21-40 (-60o dip / 285o azimuth) intersected mineralized dolomite carbonate from surface grading 3.23% TREO over 162 metres1; including higher grade intervals from surface of 4.21% TREO over 44.75 metres1, and at depth of 3.67% TREO over 71 metres1 extending 15 metres below the current resource pit shell (Figure 2). Importantly drill holes WI21-33, WI21-36, and WI21-40 establish the presence of a previously unrecognized zone of high-grade dolomite carbonate at depth within the northeast quadrant of the Wicheeda Deposit. Mineralized zones within WI21-40W and WI21-33 extend downhole 60 and 80 metres respectively below the current resource, and 15 and 32 metres below the resource pit shell providing the potential to expand mineral resources.

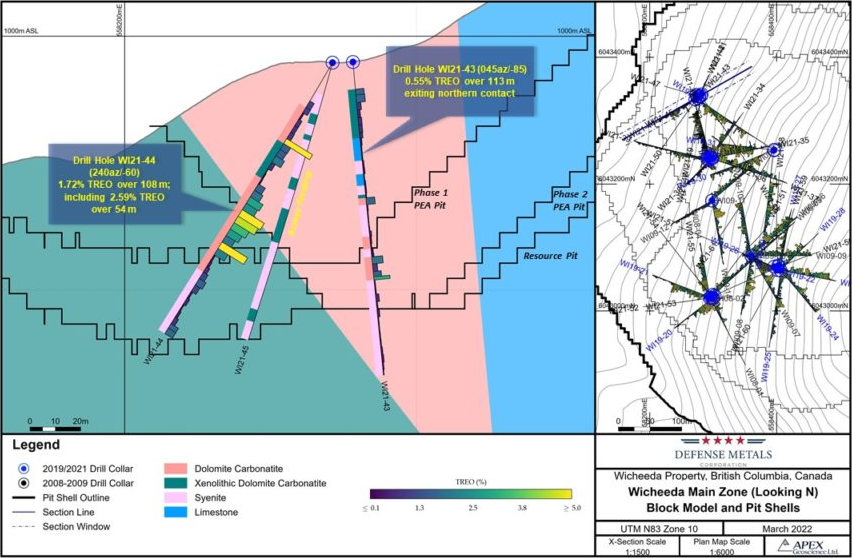
Drill hole WI21-44 (-60o dip / 240o azimuth) collared 100metres to the north intersected a mixed interval of dolomite carbonatite near surface and REE mineralized syenite at depth high averaging 1.72% TREO over 108 metres; including 2.59% TREO over 54 metres near surface (Figure 3).

[1]TREO % sum of CeO2, La2O3, Nd2O3, Pr6O11, Sm2O3, Eu2O3, Gd2O3, Tb4O7, Dy2O3 and Ho2O3.


[1] The true width of REE mineralization is estimated to be 70-100% of the drilled interval.

Table 1. Wicheeda REE Deposit 2021 Diamond Drill Intercepts

Hole ID From (m) To (m) Interval (m) TREO[1] (%) Ce2O(%) La2O(%) Nd2O(%) Pr2O(%) Sm2O(ppm) Gd2O3 (ppm) Eu2O3 (ppm) Dy2O3 (ppm) Tb4O7 (ppm) Ho2O3 (ppm)
WI21-39 (285/-60) 4 114 110 2.62 1.28 0.87 0.30 0.10 320 158 73 42 13 5
and 114 224.8 110.8 0.72 0.35 0.21 0.10 0.03 129 75 31 30 8 4
WI21-40 (345/-65) 2.75 165 162.25 3.23 1.57 1.11 0.36 0.13 370 158 70 39 13 4
including 2.75 47.5 44.75 4.21 2.05 1.46 0.46 0.16 452 197 92 61 18 7
including 96 167 71 3.67 1.79 1.26 0.41 0.14 411 173 75 35 13 3
WI21-43 (045/-85) 10.75 124.1 113.35 0.55 0.26 0.17 0.07 0.02 121 84 33 35 9 5
WI21-44 (240/-60) 17.5 125.6 108.1 1.72 0.83 0.57 0.20 0.07 266 141 69 47 14 6
including 35 89 54 2.59 1.24 0.87 0.29 0.10 384 205 102 70 20 9
WI21-33 (350/-80) 5.00 201.00 196 3.17 1.52 1.07 0.37 0.13 382 181 81 42 14 4
including 5.00 55.25 50.25 3.63 1.74 1.26 0.41 0.14 396 181 84 52 16 6
including 146.00 201.00 55.00 4.29 2.07 1.48 0.47 0.17 489 232 112 52 18 5
WI21-34 (040/-55) 3.00 117.00 114.00 2.97 1.46 1.02 0.33 0.11 323 134 58 23 9 2
including 3.00 70.00 67.00 3.84 1.89 1.34 0.41 0.15 379 160 69 29 11 3
WI21-35 (080/-55) 1.20 121.00 119.80 3.87 1.87 1.34 0.43 0.15 434 200 88 52 17 6
WI21-36 (108/-80) 1.10 174.00 172.90 2.34 1.14 0.78 0.27 0.09 293 134 59 35 11 4
including 1.10 35.65 34.55 3.45 1.66 1.21 0.38 0.13 374 170 72 37 13 4
including 136.00 174.00 38.00 3.02 1.46 1.05 0.33 0.12 337 157 68 40 13 4
WI21-37 (108/-45) 2.00 139.85 137.85 3.19 1.56 1.10 0.35 0.12 351 144 66 30 11 3
including 2.00 57.00 55.00 4.00 1.96 1.38 0.42 0.15 427 164 76 35 12 3
WI21-38 (220/-70) 1.35 82.00 80.65 3.08 1.50 1.07 0.33 0.12 346 154 70 40 13 4
including 1.35 24.75 23.4 6.01 2.91 2.14 0.62 0.23 607 246 114 60 20 6

A series of short drill holes WI21-41 (-55o dip / 025o azimuth), WI21-42 (-70o dip / 025o azimuth), and WI21-43 (-85o dip / 045o azimuth) totalling 285 metres successfully delineated the northeast margin of the deposit. Drill hole WI21-43 intersected several carbonate dykes, syenite and limestone host rocks above resource cut-off averaging 0.55% TREO over 113 metres (Figure 3).    

Figure 1. Drill Section Holes WI21-36, WI21-37, and WI21-39

Figure 2. Drill Section Holes WI21-33, WI21-36, and WI21-40

Figure 3. Drill Section Holes WI21-43 and WI21-44

About the Wicheeda REE Property

The 100% owned 2,008-hectare Wicheeda REE Property, located approximately 80 km northeast of the city of Prince George, British Columbia, is readily accessible by all-weather gravel roads and is near infrastructure, including power transmission lines, the CN railway, and major highways.

The Wicheeda REE Project yielded a robust 2021 PEA that demonstrated an after-tax net present value (NPV@8%) of $517 million, and 18% IRR[1]. A unique advantage of the Wicheeda REE Project is the production of a saleable high-grade flotation-concentrate. The PEA contemplates a 1.8 Mtpa (million tonnes per year) mill throughput open pit mining operation with 1.75:1 (waste:mill feed) strip ratio over a 19 year mine (project) life producing and average of 25,423 tonnes REO annually. A Phase 1 initial pit strip ratio of 0.63:1 (waste:mill feed) would yield rapid access to higher grade surface mineralization in year 1 and payback of $440 million initial capital within 5 years.

Methodology and QA/QC

The analytical work reported on herein was performed by ALS Canada Ltd. (ALS) at Langley (sample preparation) and Vancouver (ICP-MS fusion), B.C. ALS is an ISO-IEC 17025:2017 and ISO 9001:2015 accredited geoanalytical laboratory and is independent of the Defense Metals and the QP. Drill core samples were subject to crushing at a minimum of 70% passing 2 mm, followed by pulverizing of a 250-gram split to 85% passing 75 microns. A 0.1-gram sample pulp was then subject to multi-element ICP-MS analysis via lithium-borate fusion to determine individual REE content (ME-MS81h). Defense Metals follows industry standard procedures for the work carried out on the Wicheeda Project, with a quality assurance/quality control (QA/QC) program. Blank, duplicate, and standard samples were inserted into the sample sequence sent to the laboratory for analysis. Defense Metals detected no significant QA/QC issues during review of the data.

Qualified Person

The scientific and technical information contained in this news release as it relates to the Wicheeda REE Project has been reviewed and approved by Kristopher J. Raffle, P.Geo. (BC) Principal and Consultant of APEX Geoscience Ltd. of Edmonton, AB, a director of Defense Metals and a “Qualified Person” as defined in NI 43-101. Mr. Raffle verified the data disclosed which includes a review of the sampling, analytical and test data underlying the information and opinions contained therein.  

About Defense Metals Corp.

Defense Metals Corp. is a mineral exploration and development company focused on the acquisition, exploration and development of mineral deposits containing metals and elements commonly used in the electric power market, defense industry, national security sector and in the production of green energy technologies, such as, rare earths magnets used in wind turbines and in permanent magnet motors for electric vehicles. Defense Metals owns 100% of the Wicheeda Rare Earth Element Property located near Prince George, British Columbia, Canada. Defense Metals Corp. trades in Canada under the symbol “DEFN” on the TSX Venture Exchange, in the United States, under “DFMTF” on the OTCQB and in Germany on the Frankfurt Exchange under “35D”.

For further information, please contact:

Todd Hanas, Bluesky Corporate Communications Ltd.

Vice President, Investor Relations

Tel: (778) 994 8072

Email: todd@blueskycorp.ca

Neither the TSX Venture Exchange nor its Regulation Services Provider (as that term is defined in the policies of the TSX Venture Exchange) accepts responsibility for the adequacy or accuracy of this news release.

Cautionary Statement Regarding “Forward-Looking” Information

This news release contains “forward?looking information or statements” within the meaning of applicable securities laws, which may include, without limitation, statements relating to advancing the Wicheeda REE Project, drill results including anticipated timeline of such results/assays, the Company’s plans for its Wicheeda REE Project, expanded resource and scale of expanded resource, expected results and outcomes, the technical, financial and business prospects of the Company, its project and other matters. All statements in this news release, other than statements of historical facts, that address events or developments that the Company expects to occur, are forward-looking statements. Although the Company believes the expectations expressed in such forward-looking statements are based on reasonable assumptions, such statements are not guarantees of future performance and actual results may differ materially from those in the forward-looking statements. Such statements and information are based on numerous assumptions regarding present and future business strategies and the environment in which the Company will operate in the future, including the price of rare earth elements, the anticipated costs and expenditures, the ability to achieve its goals, that general business and economic conditions will not change in a material adverse manner, that financing will be available if and when needed and on reasonable terms. Such forward-looking information reflects the Company’s views with respect to future events and is subject to risks, uncertainties and assumptions, including the risks and uncertainties relating to the interpretation of exploration results, risks related to the inherent uncertainty of exploration and cost estimates, the potential for unexpected costs and expenses and those other risks filed under the Company’s profile on SEDAR at www.sedar.com. While such estimates and assumptions are considered reasonable by the management of the Company, they are inherently subject to significant business, economic, competitive and regulatory uncertainties and risks. Factors that could cause actual results to differ materially from those in forward looking statements include, but are not limited to, continued availability of capital and financing and general economic, market or business conditions, adverse weather and climate conditions, failure to maintain or obtain all necessary government permits, approvals and authorizations, failure to maintain community acceptance (including First Nations), risks relating to unanticipated operational difficulties (including failure of equipment or processes to operate in accordance with specifications or expectations, cost escalation, unavailability of materials and equipment, government action or delays in the receipt of government approvals, industrial disturbances or other job action, and unanticipated events related to health, safety and environmental matters), risks relating to inaccurate geological and engineering assumptions, decrease in the price of rare earth elements, the impact of Covid-19 or other viruses and diseases on the Company’s ability to operate, an inability to predict and counteract the effects of COVID-19 on the business of the Company, including but not limited to, the effects of COVID-19 on the price of commodities, capital market conditions, restriction on labour and international travel and supply chains, loss of key employees, consultants, or directors, increase in costs, delayed drilling results, litigation, and failure of counterparties to perform their contractual obligations. The Company does not undertake to update forward?looking statements or forward?looking information, except as required by law.


[1] Independent Preliminary Economic Assessment for the Wicheeda Rare Earth Element Project, British Columbia, Canada, dated January 6, 2022, with an effective date of November 7, 2021, and prepared by SRK Consulting (Canada) Inc. is filed under Defense Metals Corp.’s Issuer Profile on SEDAR (www.sedar.com).

C-Suite Interview with Aurania Resources (AUIAF) CEO, President, and Chairman Keith Barron


Noble Capital Markets Senior Research Analyst Mark Reichman sits down with Aurania Resources CEO, President, and Chairman Keith Barron.

Research, News, and Advanced Market Data on AUIAF


View all C-Suite Interviews


The 2022 C-Suite Interview series is now available on major podcast platforms

About Aurania

Aurania is a mineral exploration company engaged in the identification, evaluation, acquisition and exploration of mineral property interests, with a focus on precious metals and copper. Its flagship asset, The Lost Cities – Cutucu Project, is located in the Jurassic Metallogenic Belt in the eastern foothills of the Andes mountain range of southeastern Ecuador.

Release – Alvopetro Announces 2021 Year End Reserves With a 52 Increase In 2P NPV Before Tax


Alvopetro Announces 2021 Year End Reserves With a 52% Increase In 2P NPV Before Tax

News, and Market Data on Alvopetro Energy


CALGARY, ABMarch 8, 2022 /CNW/ – Alvopetro Energy Ltd. (TSXV:ALV) (OTCQX: ALVOF) announces our reserves as at December 31, 2021 with total proved plus probable (“2P”) reserves of 8.7 mmboe and a before tax net present value discounted at 10% of $297.0 million.  The before tax net present value of our 2P reserves (discounted at 10%) increased by 52% from December 31, 2020, primarily due to increases in forecasted natural gas prices. 2P reserve volumes decreased by 9% due to 2021 production. In addition, Alvopetro announces the December 31, 2021 assessment of the Company’s Murucututu natural gas resource (previously referred to as the Gomo natural gas resource) with risked best estimate contingent resource of 3.5 mmboe and risked best estimate prospective resource of 12.1 mmboe, both of which are virtually unchanged from December 31, 2020.  The Murucututu natural gas contingent and prospective resource values (risked best estimate net present value before tax, discounted at 10%) increased by 61% to $60.7 million and by 44% to $208.7 million, respectively.  The reserves and resources data set forth herein is based on an independent reserves and resources assessment and evaluation prepared by GLJ Ltd. (“GLJ”) dated March 7, 2022 with an effective date of December 31, 2021 (the “GLJ Reserves and Resources Report”).  

All references herein to $ refer to United States dollars, unless otherwise stated.

December 31, 2021 GLJ Reserves and Resource Report Highlights

  • 2P net present value before tax discounted at 10% increased 52% to $297.0 million primarily due to higher forecasted commodity prices.
  • Proved reserves (“1P”) and 2P reserves decreased to 4.4 mmboe (-13%) and 8.7 mmboe (-9%) respectively, due to 2021 production volumes.
  • This represents a 2P Net Asset Value of CAD$11.20/share ($8.77/share).
  • Risked best estimate contingent and risked best estimate prospective resource of 3.5 mmboe and 12.1 mmboe, respectively were consistent with prior year with an increase of 61% and 44% respectively on risked best estimate before tax net present value discounted at 10%, due primarily to higher forecasted commodity prices.

Corey Ruttan, President and Chief Executive Officer, commented:

“Our 2021 year-end reserves and resource evaluations highlight the strong profitability from our Caburé natural gas field and the long-term potential of our Murucututu project. The increase in forecasted cash flows reflects the impact of global commodity prices on our forecasted natural gas prices under our long-term gas sales agreement and our most recent price increase effective February 1, 2022. Our 2022 capital program is focused on natural gas exploration and development aimed at expanding our production and reserve base and maximizing the utilization of our strategic midstream infrastructure that is concurrently being expanded to a capacity of at least 500,000 m3/d (17.7 mmcfpd).”

SUMMARY

December 31, 2021 Gross Reserve and Gross Resource Volumes: (1)(5)(6)(7)(8)(9)(10)(11)(14)

December 31, 2021 Reserves (Gross)

Total Proved(1P)

Total Proved plus Probable(2P)

Total Proved plus Probable plus Possible (3P)

(Mboe)

(Mboe)

(Mboe)

Caburé Property

3,224

5,141

6,796

Murucututu Property

1,024

3,286

5,974

Other Properties

173

310

606

Total Company Reserves

4,421

8,737

13,376

See ‘Footnotes’ section at the end of this news release

December 31, 2021 Murucututu Resources (Gross)

Low Estimate

Best Estimate

 High Estimate

(Mboe)

(Mboe)

(Mboe)

Risked Contingent Resource

Risked Prospective Resource

2,715

6,555

3,465

12,127

5,697

17,937

See ‘Footnotes’ section at the end of this news release

Net present value before tax discounted at 10%:(2)(5)(6)(7)(8)(9)(10)(11)(12)(13)

Reserves

1P

2P

3P

(MUS)

(MUS)

(MUS)

Caburé Property

150,414

216,859

265,483

Murucututu Property

20,239

72,307

135,821

Other Properties

3,107

7,833

15,418

Total Company

173,759

297,000

416,723

See ‘Footnotes’ section at the end of this news release

Murucututu Resource

Low Estimate

Best Estimate

 High Estimate

(MUS)

(MUS)

(MUS)

Risked Contingent Resource

Risked Prospective Resource

48,505

100,348

60,669

208,677

108,043

312,055

See ‘Footnotes’ section at the end of this news release

NET ASSET VALUE

Following the December 31, 2021 reserves evaluation, based on the before tax net present value of Alvopetro’s 2P reserves (discounted at 10%), our total net asset value is $297.3 millionCAD$11.20 per common share outstanding.  Our 2P net asset value of $297.3 million is before including the before tax net present value (discounted at 10%) of our risked best estimate risked contingent resource of $60.7 million and our risked prospective resource of $208.7 million from the Murucututu natural gas field.

Net Asset Value (in MUS, other than per share amounts)

1P

2P

3P

Before Tax Net Present Value, discounted at 10% (MUS)

173,759

297,000

416,723

Working capital net of debt – as at September 30, 2021(a)(b)

294

294

294

Total Net Asset Value(b),(c)(d)

174,053

297,294

417,017

CAD per basic share(e)

6.56

11.20

15.71

a)

Working capital net of debt is computed as the Company’s net working capital the carrying amount of the Company’s Credit Facility, decreased by net working capital surplus, as of September 30, 2021.

b)

Non-GAAP measure. See ‘Non-GAAP Measures‘ in this news release.

c)

Alvopetro has reflected the contractual obligations pursuant to our September 2018 Gas Treatment Agreement with Enerflex, including the equipment rental component of the agreement which is treated as a right of use asset and reflected as a capital lease obligation on our financial statements. As the future capital lease payments reduce the forecasted future net revenue in all reserves categories, the capital lease obligation as reflected on the Company’s financial statements has not been included in the table above.

d)

The net asset value reflected above includes the present value of before tax cash flows from the Company’s reserves only. No amounts have been included with respect to contingent or prospective resource volumes.

e)

Converted to Canadian dollars (“CAD”) based on the exchange rate on March 7, 2022. The per share calculation is computed based on 33.9 million common shares outstanding as of March 7, 2022.

PRICING ASSUMPTIONS – FORECAST PRICES AND COSTS 

GLJ employed the following pricing and inflation rate assumptions as of January 1, 2022 in the GLJ Reserves and Resources Report in estimating reserves and resources data using forecast prices and costs.

Year

Brent Blend Crude Oil FOB North Sea ($/Bbl) 

National Balancing Point (UK)($/mmbtu)

NYMEX Henry Hub Near Month Contract($/mmbtu)

Alvopetro-Bahiagas Gas Contract$/mmbtu(Current Year)

Alvopetro-Bahiagas Gas Contract$/mmbtu(Previous Year)

Change from prior year

2022

76.00

20.75

3.80

9.51

6.40

49%

2023

72.51

12.00

3.50

10.09

6.65

52%

2024

71.24

8.50

3.15

9.86

6.89

43%

2025

72.66

8.67

3.21

9.00

7.14

26%

2026

74.12

8.84

3.28

8.89

7.31

22%

2027

75.59

9.02

3.34

8.99

7.45

21%

2028

77.11

9.20

3.41

9.15

7.59

21%

2029

78.66

9.39

3.48

9.33

7.74

21%

2030

80.22

9.57

3.55

9.52

7.90

21%

2031*

81.83

9.76

3.62

9.71

8.06

20%

*Escalated at 2% per year thereafter

As of February 1, 2022, Alvopetro’s contracted natural gas price under the terms of our long-term gas sales agreement is based on the ceiling price within the contract and is forecasted to remain at the ceiling price until 2024. The forecasted prices in the GLJ Reserves and Resource Report do not reflect the most recent increase in global commodity prices which further extends the period under which Alvopetro’s contracted price will be at the ceiling in the contract.  The ceiling price incorporates assumed US inflation of 5% in 2022, 3% in 2023 and 2% thereafter.

GLJ RESERVES AND RESOURCES REPORT 

The GLJ Reserves and Resources Report has been prepared in accordance with the standards contained in the Canadian Oil and Gas Evaluation Handbook (“COGEH”) that are consistent with the standards of National Instrument 51-101 (“NI 51-101”). GLJ is a qualified reserves evaluator as defined in NI 51-101. The GLJ Reserves and Resources Report was an evaluation of all reserves of Alvopetro including our Caburé and Caburé Leste natural gas fields (collectively referred to as our Caburé natural gas field), our Murucututu natural gas project (previously referred to as Gomo), as well as our Bom Lugar and Mãe-da-lua oil fields. The GLJ Reserves and Resources Report also includes an evaluation of the gas resources of our Murucututu natural gas.  In addition to the reserves assigned to our two existing Murucututu wells (197-1 and 183-1) and two additional development locations, contingent resource was assigned to the area in proximity to our existing Murucututu reserves, deemed to be discovered.  The area mapped by 3D seismic west and north of the area defined as contingent was assigned prospective resource. Additional reserves and resources information as required under NI 51-101 will be included in the Company’s Annual Information Form for the 2021 fiscal year which will be filed on SEDAR by April 30, 2022.

December 31, 2021 Reserves Information:

Summary of Reserves (1)(3)(4)(5)(7)(8)

Light & Medium Oil

Residue Gas

Natural Gas Liquids

Oil Equivalent

Company Gross

Company Net

Company Gross

Company Net

Company Gross

CompanyNet

Company Gross

Company Net

(Mbbl)

(Mbbl)

(MMcf)

(MMcf)

(Mbbl)

(Mbbl)

(Mboe)

(Mboe)

Proved

Producing

0

0

18,267

17,287

180

171

3,224

3,052

Developed Non-Producing

26

23

2,095

1,953

52

48

427

397

Undeveloped

147

138

3,254

3,012

80

74

770

714

Total Proved

173

161

23,616

22,252

312

294

4,421

4,163

      Probable

137

128

22,731

21,331

390

365

4,316

4,048

Total Proved plus Probable

310

289

46,347

43,583

702

659

8,737

8,212

      Possible

296

277

23,401

21,866

443

413

4,639

4,334

Total Proved plus Probable plus Possible

606

565

69,748

65,448

1,146

1,072

13,376

12,545

See ‘Footnotes’ section at the end of this news release

Summary of Before Tax Net Present Value of Future Net Revenue – MUS (2)(5)(7)(8)(12)(13)

Undiscounted

5%

10%

15%

20%

Proved

Producing

175,800

162,812

150,414

139,568

130,152

Developed Non-Producing

13,952

10,341

7,977

6,411

5,327

Undeveloped

35,028

22,103

15,369

11,298

8,559

Total Proved

224,780

195,256

173,759

157,277

144,037

       Probable

267,646

168,096

123,240

96,623

78,449

Total Proved plus Probable

492,425

363,352

297,000

253,900

222,486

       Possible

316,880

175,731

119,723

89,422

70,217

Total Proved plus Probable plus Possible

809,305

539,083

416,723

343,322

292,703

See ‘Footnotes’ section at the end of this news release

Summary of After Tax Net Present Value of Future Net Revenue – MUS (2)(5)(7)(8)(12)(13)

Undiscounted

5%

10%

15%

20%

Proved

Producing

158,208

146,984

136,050

126,439

118,078

Developed Non-Producing

11,493

8,683

6,730

5,402

4,469

Undeveloped

26,984

17,474

12,283

9,039

6,802

Total Proved

196,686

173,141

155,064

140,880

129,349

       Probable

207,798

135,466

100,859

79,563

64,708

Total Proved plus Probable

404,484

308,607

255,923

220,443

194,057

       Possible

241,128

139,526

97,153

73,331

57,863

Total Proved plus Probable plus Possible

645,612

448,133

353,076

293,774

251,919

See ‘Footnotes’ section at the end of this news release

Future Development Costs (2)(5)(7)(8)(12)(13)

The table below sets out the total development costs deducted in the estimation in the GLJ Reserves and Resources Report of future net revenue attributable to proved reserves, proved plus probable reserves and proved plus probable plus possible reserves (using forecast prices and costs), by field. Total development costs include capital costs for drilling and facility and pipeline expenditures but excludes abandonment and reclamation costs.

Under each reserve category, Alvopetro has elected to reflect 100% of the contractual obligations pursuant to our Gas Treatment Agreement with Enerflex, including all operating, capital, and related financing costs for the full duration of the agreement. These costs are mainly attributable to the Caburé field and also represent the majority of the future development costs for the Caburé field in the table below. The future costs associated with equipment rental are also reflected as a capital lease obligation on our financial statements other than future anticipated equipment rental costs associated with the facility expansion, which will be reflected once completed.

The future development costs for the Murucututu field in the proved category are for the remaining costs anticipated in 2022 for the pipeline and field facility development to tie-in the 183(1) well to Alvopetro’s midstream assets, as well as a development location. In the probable and possible categories, there are future development costs for an additional development location and the stimulation and tie-in of the 197(1) well. Also included in the Murucututu future development costs for all reserve categories are a portion of the anticipated contractual obligations associated with the expansion of the gas treatment facility. The future development costs for Bom Lugar in the proved category include costs for a directional wellbore and facilities upgrade. A second directional well is included in the future development costs for the possible category for Bom Lugar. Future development costs at the Mãe-da-lua field relate to a stimulation of the existing producing well.

MUS, Undiscounted

2022

2024

2024

2025

2026

Remaining

Total

Proved

Caburé Natural Gas Field 

3,000

1,730

1,730

1,730

5,096

13,286

Murucututu Gas Field

10,550

433

441

11,424

Bom Lugar Oil Field

333

2,771

3,104

Mãe-da-lua Oil Field

439

439

Total Proved

13,883

5,373

2,171

1,730

5,096

28,253

Proved Plus Probable

Caburé Natural Gas Field

3,000

1,730

1,730

1,730

1,730

4,237

14,157

Murucututu Gas Field

16,350

1,463

441

450

459

468

19,631

Bom Lugar Oil Field

333

3,517

3,850

Mãe-da-lua Oil Field

0

439

439

Total Proved Plus Probable

19,638

7,149

2,171

2,180

2,189

4,705

38,078

Proved Plus Probable Plus Possible

Caburé Natural Gas Field

3,000

1,730

1,730

1,730

1,730

5,786

15,706

Murucututu Gas Field

16,350

1,463

441

450

459

946

20,109

Bom Lugar Oil Field

333

7,514

7,847

Mãe-da-lua Oil Field

0

439

439

Total Proved Plus Probable Plus Possible

19,683

11,146

2,171

2,180

2,189

6,732

44,101

See ‘Footnotes’ section at the end of this news release

Reconciliation of Alvopetro’s Gross Reserves (Before Royalty) (1)(5)(7)(8)(13)


Proved(Mboe)


Probable(Mboe)


Proved Plus Probable(Mboe)


Possible(Mboe)

Proved plus Probable plus Possible

(Mboe)

December 31, 2020


5,108

4,485

9,593

4,615

14,209

Extensions

176

(176)

Technical Revisions

(12)

11

(1)

24

23

Economic Factors

9

(4)

5

5

Production

(861)

(861)

(861)

December 31, 2021

4,421

4,316

8,737

4,639

13,376

See ‘Footnotes’ section at the end of this news release

December 31, 2021 Murucututu Contingent Resources Information:

Summary of Unrisked Company Gross Contingent Resources (1)(3)(4)(5)(7)(10)(11)

Development Pending Economic Contingent Resources

Low Estimate

Best Estimate

 High Estimate

Residue gas (MMcf)

15,719

20,061

32,984

Natural gas liquids (Mbbl)

389

496

815

Oil equivalent (Mboe)

3,008

3,839

6,313

See ‘Footnotes’ section at the end of this news release.

Summary of Before Tax Net Present Value of Future Net Revenue of Unrisked Contingent Resources- MUS (2)(5)(10)(11)(12)(13)

Undiscounted

5%

10%

15%

20%

Low Estimate

158,700

84,965

53,745

37,370

27,487

Best Estimate

222,759

109,139

67,223

46,563

34,432

High Estimate

415,317

193,940

119,715

84,746

64,509

See ‘Footnotes’ section at the end of this news release.

The GLJ Contingent Resource Report for Murucututu assumes capital deployment during 2023 for the drilling of wells and expansion of facilities, with total project costs of $23.9 million and first commercial production in 2023. There can be no certainty that the project will developed on the timelines discussed herein. Development of the project is dependent on several contingencies as further described in this news release.  The information presented herein is based on company net project development costs.

Summary of Development Pending Risked Company Gross Contingent Resources(1)(3)(4)(5)(7)(10)(11)

The GLJ Reserves and Resources Report estimates the Chance of Development as the product of two main contingencies associated with the project development, which are: 1) the probability of corporate sanctioning, which GLJ estimates at 95%; 2) the probability finalization of a development plan, which GLJ estimates at 95%. The product of these two contingencies is 90%.   As there is no risk related to discovery, the Chance of Commerciality for the contingent resource is therefore 90% which is the risk factor that has been applied to the Development Risked company gross contingent resources and the net present value figures reported below.

Low Estimate

Best Estimate

 High Estimate

Residue gas (MMcf)

14,187

18,105

29,768

Natural Gas Liquids (Mbbl)

351

448

736

Oil equivalent (Mboe)

2,715

3,465

5,697

See ‘Footnotes’ section at the end of this news release.

Summary of Development Pending Risked Before Tax Net Present Value of Future Net Revenue of Contingent Resources- MUS(2)(5)(10)(11)(12)(13)

Undiscounted

5%

10%

15%

20%

Low Estimate

143,226

76,681

48,505

33,726

24,807

Best Estimate

201,040

98,498

60,669

42,023

31,074

High Estimate

374,824

175,031

108,043

76,483

58,219

See ‘Footnotes’ section at the end of this news release.

December 31, 2021 Murucututu Prospective Resources Information:

Summary of Unrisked Company Gross Prospective Resources (1)(3)(4)(5)(7)(9)(11)

Prospective Resources

Low

Best

High

Residue gas (MMcf)

42,228

78,126

115,553

Natural gas liquids (Mbbl)

1,044

1,931

2,856

Oil equivalent (Mboe)

8,082

14,952

22,115

See ‘Footnotes’ section at the end of this news release.

Summary of Before Tax Net Present Value of Future Net Revenue of Unrisked Prospective Resources- MUS (2)(5)(9)(11)(12)(13)

Undiscounted

5%

10%

15%

20%

Low Estimate

474,489

220,405

123,722

77,245

51,350

Best Estimate

1,005,490

449,220

257,284

167,675

117,555

High Estimate

1,584,857

678,025

384,741

252,103

178,690

See ‘Footnotes’ section at the end of this news release.

The GLJ Prospective Resource Report for Murucututu assumes capital deployment starting 2024 for the drilling of wells, expansion of field facilities, and additional pipeline capacity, with total project costs of $66.1 million and first commercial production in 2024. There can be no certainty that the project will developed on the timelines discussed herein. Development of the project is dependent on several contingencies as further described in this news release.  The information presented herein is based on company project development costs.

The GLJ Reserves and Resources Report estimates the Chance of Commerciality as the product between the Chance of Discovery and the Chance of Development. The Chance of Discovery of the prospective resources has been assessed at 90%, while the Chance of Development has been assessed as the same as for the Contingent Resources described above at 90%. The resulting Chance of Commerciality is 81%, which has been applied to the company gross unrisked prospective resources and the net present value figures reported below.   

Summary of Development Risked Company Gross Prospective Resources(1)(3)(4)(5)(7)(9)(11)

The GLJ Reserves and Resources Report estimates the Chance of Commerciality as the product between the Chance of Discovery and the Chance of Development. The Chance of Discovery of the prospective resources has been assessed at 90%, while the Chance of Development has been assessed as the same as for the Contingent Resources described above at 90%. The resulting Chance of Commerciality is 81%, which has been applied to the company gross unrisked prospective resources and the net present value figures reported below.   

Low

Best

High

Residue gas (MMcf)

34,250

63,366

93,723

Natural gas liquids (Mboe)

847

1,566

2,317

Oil equivalent (Mboe)

6,555

12,127

17,937

See ‘Footnotes’ section at the end of this news release.

Summary of Development Risked Before Tax Net Present Value of Future Net Revenue of Prospective Resources- MUS(2)(5)(9)(11)(12)(13)

Undiscounted

5%

10%

15%

20%

Low Estimate

384,847

178,765

100,348

62,652

41,649

Best Estimate

815,529

364,352

208,677

135,997

95,346

High Estimate

1,285,440

549,930

312,055

204,475

144,931

See ‘Footnotes’ section at the end of this news release.

Upcoming 2021 Results and Live Webcast

Alvopetro anticipates announcing its 2021 fourth quarter and year-end results on March 17, 2022 after markets close and will host a live webcast to discuss the results at 8:00 am Mountain time, on the March 18, 2022. Details for joining the event are as follows:

DATE: March 18, 2022TIME: 8:00 AM Mountain/10:00 AM EasternLINK: https://zoom.us/j/99386897923  DIAL-IN NUMBERS: https://zoom.us/u/aixrWbAbO  WEBINAR ID: 993 8689 7923

The webcast will include a question and answer period. Online participants will be able to ask questions through the Zoom portal. Dial-in participants can email questions directly to socialmedia@alvopetro.com.

Corporate Presentation

Alvopetro’s updated corporate presentation is available on our website at:

http://www.alvopetro.com/corporate-presentation

FOOTNOTES

(1)

Mboe = thousands of barrels of oil equivalent.

(2)

MUS = 000’s of U.S. dollars.

(3)

Mbbl = thousands of barrels.

(4)

MMcf = Million cubic feet.

(5)

References to Company Gross reserves or Company Gross Resources means the total working interest share of remaining recoverable reserves or resources owned by Alvopetro before deductions of royalties payable to others and without including any royalty interests owned by Alvopetro. 

(6)

References to “Other Properties” refers to the Company’s Bom Lugar and Mae-da-lua oil fields.

(7)

The tables above are a summary of the reserves of Alvopetro and the net present value of future net revenue attributable to such reserves as evaluated in the GLJ Reserves and Resources Report based on forecast price and cost assumptions. The tables summarize the data contained in the GLJ Reserves and Resources Report and as a result may contain slightly different numbers than such report due to rounding. Also due to rounding, certain columns may not add exactly.

(8)

Possible reserves are those additional reserves that are less certain to be recovered than probable reserves.  There is a 10% probability that the quantities actually recovered will equal or exceed the sum of proved plus probable plus possible reserves.

(9)

Prospective Resources – Prospective Resources are defined in the COGE Handbook as those quantities of petroleum estimated, as of a given date, to be potentially recoverable from undiscovered accumulations by application of future development projects.  Prospective resources have both an associated chance of discovery and a chance of development.  There is no certainty that any portion of the prospective resources will be discovered and even if discovered, there is no certainty that it will be commercially viable to produce any portion. Prospective Resources are further subdivided in accordance with the level of certainty associated with recoverable estimates assuming their discovery as described in footnote 11.

(10)

Contingent Resources are defined in the COGE Handbook as those quantities of petroleum estimated, as of a given date, to be potentially recoverable from known accumulations using established technology or technology under development, but are not currently considered to be commercially recoverable due to one or more contingencies. Contingencies may include factors such as economic, legal, environmental, political and regulatory matters or a lack of markets. It is also appropriate to classify as contingent resources the estimated discovered recoverable quantities associated with a project in the early evaluation stage.  Contingent Resources are further classified in accordance with the level of certainty associated with the estimates as described in footnote 11 and may be subclassified based on project maturity and/or characterized by their economic status. The Contingent Resources estimated in the GLJ Reserves and Resources Report are classified as “economic contingent resources”, which are those contingent resources that are currently economically recoverable.  All such resources are further sub-classified with a project status of “development pending”, meaning that resolution of the final conditions for development are being actively pursued. The recovery estimates of the Company’s contingent resources provided herein are estimates only and there is no guarantee that the estimated resources will be recovered. There is uncertainty that it will be commercially viable to produce any portion of the resources. Actual recovered resource may be greater than or less than the estimates provided herein.

(11)

Low Estimate: This is considered to be a conservative estimate of the quantity that will actually be recovered. It is likely that the actual remaining quantities recovered will exceed the low estimate. If probabilistic methods are used, there should be at least a 90 percent probability (P90) that the quantities actually recovered will equal or exceed the low estimate.

Best Estimate: This is considered to be the best estimate of the quantity that will actually be recovered. It is equally likely that the actual remaining quantities recovered will be greater or less than the best estimate. If probabilistic methods are used, there should be at least a 50 percent probability (P50) that the quantities actually recovered will equal or exceed the best estimate.

High Estimate: This is considered to be an optimistic estimate of the quantity that will actually be recovered. It is unlikely that the actual remaining quantities recovered will exceed the high estimate. If probabilistic methods are used, there should be at least a 10 percent probability (P10) that the quantities actually recovered will equal or exceed the high estimate.

(12)

The net present value of future net revenue attributable to Alvopetro’s reserves and resources are stated without provision for interest costs and general and administrative costs, but after providing for estimated royalties, production costs, development costs, other income, future capital expenditures, well abandonment and reclamation costs for only those wells assigned reserves and material dedicated gathering systems and facilities. The net present values of future net revenue attributable to the Alvopetro’s reserves and resources estimated by GLJ do not represent the fair market value of those reserves. Other assumptions and qualifications relating to costs, prices for future production and other matters are summarized herein. The recovery and reserve and resource estimates of the Company’s reserves and resources provided herein are estimates only and there is no guarantee that the estimated reserves and resources will be recovered. Actual reserves and resources may be greater than or less than the estimates provided herein.

(13)

GLJ’s January 1, 2022 escalated price forecast is used in the determination of future gas sales prices under Alvopetro’s long-term gas sales agreement and for all forecasted oil sales and natural gas liquids sales. See https://www.gljpc.com/sites/default/files/pricing/jan22.pdf  for GLJ’s price forecast.

(14)

The GLJ Reserves and Resources Report was an evaluation of the Company’s contingent and prospective resource of the Company’s Murucututu natural gas project and excluded an evaluation of the 183-B1 and 182-C1 exploration prospects which were evaluated by GLJ in an independent resource assessment dated September 4, 2020 with an effective date of July 31, 2020. For further details, see our September 8, 2020 press release and the annual information for the year-ended December 31, 2020 which has been filed on SEDAR.

Alvopetro Energy Ltd.’s vision is to become a leading independent upstream and midstream operator in Brazil. Our strategy is to unlock the on-shore natural gas potential in the state of Bahia in Brazil, building off the development of our Caburé natural gas field and our strategic midstream infrastructure.

Neither the TSX Venture Exchange nor its Regulation Services Provider (as that term is defined in the policies of the TSX Venture Exchange) accepts responsibility for the adequacy or accuracy of this news release.

All amounts contained in this news release are in United States dollars, except as otherwise noted.

Oil and Natural Gas Reserves. The disclosure in this news release summarizes certain information contained in the GLJ Reserves and Resources Report but represents only a portion of the disclosure required under NI 51-101. Full disclosure with respect to the Company’s reserves as at December 31, 2021 will be contained in the Company’s annual information form for the year ended December 31, 2021 which will be filed on SEDAR (www.sedar.com) on or before April 30, 2022. All net present values in this press release are based on estimates of future operating and capital costs and GLJ’s forecast prices as of December 31, 2021. The reserves definitions used in this evaluation are the standards defined by COGEH reserve definitions and are consistent with NI 51-101 and used by GLJ. The net present values of future net revenue attributable to the Alvopetro’s reserves estimated by GLJ do not represent the fair market value of those reserves. Other assumptions and qualifications relating to costs, prices for future production and other matters are summarized herein. The recovery and reserve estimates of the Company’s reserves provided herein are estimates only and there is no guarantee that the estimated reserves will be recovered. Actual reserves may be greater than or less than the estimates provided herein. Possible reserves are those additional reserves that are less certain to be recovered than probable reserves. There is a 10% probability that the quantities actually recovered will equal or exceed the sum of proved plus probable plus possible reserves.

Contingent Resources. This news release discloses estimates of Alvopetro’s contingent resources and the net present value associated with net revenues associated with the production of such contingent resources as included in the GLJ Reserves and Resources Report. There is no certainty that it will be commercially viable to produce any portion of such contingent resources and the estimated future net revenues do not necessarily represent the fair market value of such contingent resources. Estimates of contingent resources involve additional risks over estimates of reserves. Full disclosure with respect to the Company’s contingent resources as at December 31, 2021 will be contained in the Company’s annual information form for the year ended December 31, 2021 which will be filed on SEDAR (www.sedar.com) on or before April 30, 2022.

Prospective Resources – This news release discloses estimates of Alvopetro’s prospective resources included in the GLJ Reserves and Resources Report. There is no certainty that any portion of the prospective resources will be discovered and even if discovered, there is no certainty that it will be commercially viable to produce any portionEstimates of prospective resources involve additional risks over estimates of reserves. The accuracy of any resources estimate is a function of the quality and quantity of available data and of engineering interpretation and judgment. While resources presented herein are considered reasonable, the estimates should be accepted with the understanding that reservoir performance subsequent to the date of the estimate may justify revision, either upward or downward. Full disclosure with respect to the Company’s prospective resources as at December 31, 2021 will be contained in the Company’s annual information form for the year ended December 31, 2021 which will be filed on SEDAR (www.sedar.com) on or before April 30, 2022.

Abbreviations:

1P

=

proved reserves

2P

=

proved plus probable reserves

3P

=

proved plus probable plus possible reserves

CAD$

=

Canadian dollars

F&D

=

finding and development costs

FDC

=

future development costs;

Mboe

=

thousand barrels of oil equivalent

MMbtu

=

million British Thermal Units

MMcf

=

million cubic feet

MMcf/d

=

million cubic feet per day

MMboe

=

million barrels of oil equivalent

MMUS

=

millions of U.S. dollars

MUS

=

thousands of U.S. dollars


BOE Disclosure. The term barrels of oil equivalent (“boe”) may be misleading, particularly if used in isolation. A boe conversion ratio of six thousand cubic feet per barrel (6Mcf/bbl) of natural gas to barrels of oil equivalence is based on an energy equivalency conversion method primarily applicable at the burner tip and does not represent a value equivalency at the wellhead. All boe conversions in this news release are derived from converting gas to oil in the ratio mix of six thousand cubic feet of gas to one barrel of oil.

Forward-Looking Statements and Cautionary Language. This news release contains “forward-looking information” within the meaning of applicable securities laws. The use of any of the words “will”, “expect”, “intend” and other similar words or expressions are intended to identify forward-looking information. Forward–looking statements involve significant risks and uncertainties, should not be read as guarantees of future performance or results, and will not necessarily be accurate indications of whether or not such results will be achieved. A number of factors could cause actual results to vary significantly from the expectations discussed in the forward-looking statements. These forward-looking statements reflect current assumptions and expectations regarding future events. Accordingly, when relying on forward-looking statements to make decisions, Alvopetro cautions readers not to place undue reliance on these statements, as forward-looking statements involve significant risks and uncertainties. More particularly and without limitation, this news release contains forward-looking information concerning the plans relating to the Company’s operational activities and the expected natural gas price, gas sales and gas deliveries under Alvopetro’s long-term gas sales agreement. The forward–looking statements are based on certain key expectations and assumptions made by Alvopetro, including but not limited to equipment availability, the timing of regulatory licenses and approvals, the success of future drilling, completion, testing, recompletion and development activities, the outlook for commodity markets and ability to access capital markets, the impact of the COVID-19 pandemic, the performance of producing wells and reservoirs, well development and operating performance, foreign exchange rates, general economic and business conditions, weather and access to drilling locations, the availability and cost of labour and services, environmental regulation, including regulation relating to hydraulic fracturing and stimulation, the ability to monetize hydrocarbons discovered, the regulatory and legal environment and other risks associated with oil and gas operations. The reader is cautioned that assumptions used in the preparation of such information, although considered reasonable at the time of preparation, may prove to be incorrect. Actual results achieved during the forecast period will vary from the information provided herein as a result of numerous known and unknown risks and uncertainties and other factors.  Although Alvopetro believes that the expectations and assumptions on which such forward-looking information is based are reasonable, undue reliance should not be placed on the forward-looking information because Alvopetro can give no assurance that it will prove to be correct. Readers are cautioned that the foregoing list of factors is not exhaustive. Additional information on factors that could affect the operations or financial results of Alvopetro are included in our annual information form which may be accessed on Alvopetro’s SEDAR profile at www.sedar.com. The forward-looking information contained in this news release is made as of the date hereof and Alvopetro undertakes no obligation to update publicly or revise any forward-looking information, whether as a result of new information, future events or otherwise, unless so required by applicable securities laws.

Non-GAAP Measures. This news release contains financial terms that are not considered measures under International Financial Reporting Standards (“IFRS”), such as working capital net of debt and net asset value. Working capital net of debt is computed as current assets less the sum of current liabilities and the carrying amount of the Company’s credit facility. Net asset value is computed based on the before-tax net present value of the Company’s proved plus probable reserves, discounted at 10%, increased by the Company’s working capital net of debt.  The non-GAAP measures do not have standardized meanings under IFRS and therefore are unlikely to be comparable to similar measures presented by other issuers. While these measures may be common in the oil and gas industry, the Company’s use of these terms may not be comparable to similarly defined measures presented by other companies. The non-GAAP measures referred to in this report should not be considered an alternative to, or more meaningful than measures prescribed by IFRS and they are not meant to enhance the Company’s reported financial performance or position.  For more information with respect to financial measures which have not been defined by GAAP, including reconciliations to the closest comparable GAAP measure, see the “Non-GAAP Measures” section of the Company’s most recent MD&A which may be accessed through the SEDAR website at www.sedar.com.

SOURCE Alvopetro Energy Ltd.

Can Icahn and Buffett Both be Right on Occidental Petroleum


Carl Icahn Selling into Warren Buffet’s Buying, Can they Both be Right?


“We started buying on Monday, and we bought all we could,” Warren Buffett told CNBC. The Berkshire Hathaway CEO was discussing a new 91.2 million share stake his company took in Occidental Petroleum (OXY). At the same time, Carl Icahn, another renowned investor, has been selling shares of OXY. Can they both be right?


Warren Buffet on OXY

Buffett pulled the trigger on $4.5 billion of Occidental, an energy exploration and production company, last week.  This gives Berkshire close to a 10% stake in the company. This is an increase in exposure for Berkshire as it also has positions worth $10 billion of preferred shares, along with warrants to buy 83.9 million common shares exercisable at $59.62.

Berkshires 2021 annual report showed they held $144 billion in cash and equivalents.

Carl Icahn on OXY

Billionaire investor Carl Icahn, sold his remaining lot of OXY last week. According to The Wall Street Journal, Icahn made about $1 billion on Occidental stock and still holds about 15 million in warrants (OXY WS). The warrants, which trade at around $34, have an exercise price of $22 a share (current level $57-$58).

Icahn still continues to have exposure to the energy sector through a roughly 6.4% stake worth $2 billion in Cheniere Energy (LNG), a liquefied natural gas producer, and a controlling interest worth $1 billion in CVR Energy (CVI), a petroleum refiner.

The activist investor became involved with Occidental in 2019 around the same time as Buffett. He urged the company to not pursue the debt-financed deal for Anadarko, which Buffett was for and helped enable with loans. Berkshire’s warrants and preferred shares were part of financing the arrangement.


Buffett vs Icahn

When you find two legendary investors taking opposite sides of the same trade at the same time, in a sector that is moving quickly, it’s worth stopping to try to understand why. Berkshire Hathaway’s Buffet, who is 91, was a heavy buyer of OXY while Carl Icahn, 86, was selling a huge position put on in 2019.

Description:
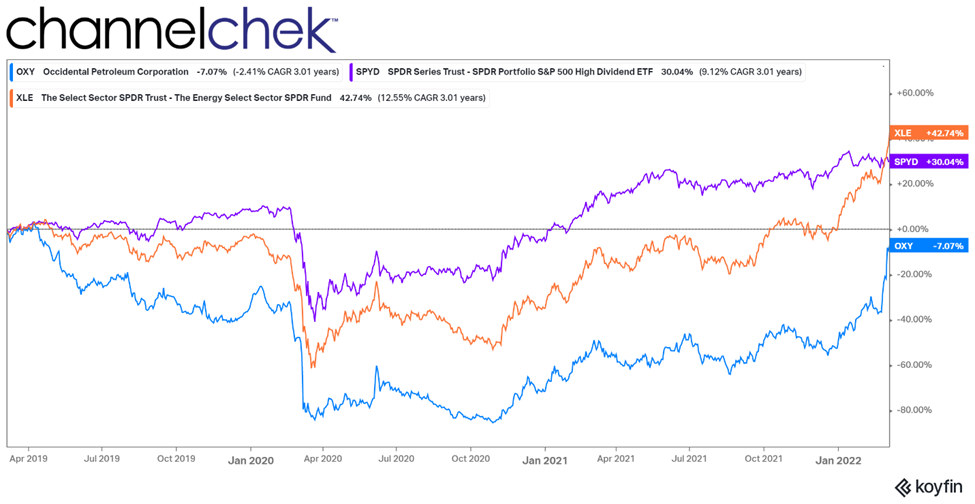
Since March 2019 OXY has consistently performed below the energy sector and S&P 500


There have been other times when one of these two was buying into the other’s selling. In 2016, Icahn exited a position in Apple (AAPL) he had held for about three years. Also, in 2016 Buffett began scaling into Apple. Icahn made a reported $2 billion profit on 180 million shares of Apple. It is unclear if the redeployment of the proceeds of this sale outpaced the earnings that would have occurred if he held Apple, which has grown 500% since.

Apple has been Buffett’s biggest public market win in the past decade. Berkshire holds about 900 million shares worth $145 billion, more than four times its cost.

Investment Styles

As an activist investor, Icahn’s primary methodology is to own a significant enough amount of a company to influence how the company is run. If a profit presents itself, he is likely to take it. Such was the case with the doubling of OXY in two months’ time this year.

Berkshire’s portfolio is mostly non-public companies it owns outright. As for publicly traded stocks, Buffett’s style is to be patient waiting for value in terms of price and potential.  Buffett has described his favorite holding period as “forever.”

Berkshire is also cash-heavy and should like to deploy $80 billion, but has been priced out of stocks and acquisitions for several years now. With recent market weakness, there may be some big purchases on the horizon.

Take-Away

Investors have different time frames and risk tolerance. More active traders like Icahn may sell if they see other opportunities where they believe the capital could produce a better return, whereas Berkshire’s longer-term view and huge cash position, could make their transactions based on a totally different set of factors. For Berkshire, this purchase may be as easy to understand as asking “do we expect OXY to perform better than cash.”


Paul Hoffman

Managing Editor, Channelchek


Suggested Reading


Using Warren Buffett’s SEC Filing as an Oracle


Cathie Wood Says Benchmark Funds are Where the Risk Is


Michael Burry vs Cathie Wood is Not an Even Competition


Warren Buffett vs Elon Musk, Who’s Right


Sources

https://www.channelchek.com/news-channel/Pros_and_Cons_of_a_Company_Like_Berkshire_Hathaway_in_your_Portfolio

https://www.cnbc.com/2022/03/05/berkshire-hathaway-reveals-5-billion-stake-in-oil-giant-occidental-petroleum.html

https://www.sec.gov/Archives/edgar/data/315090/000089924322009579/xslF345X03/doc4.xml

https://www.barrons.com/articles/warren-buffett-was-buying-occidental-carl-icahn-was-selling-who-will-be-right-51646672487?mod=hp_columnists


Stay up to date. Follow us:


EV Inflation Outpacing Traditional Cars


Image: Ron Frazer (Flickr)


How the Cost of Owning a New EV Could Also Climb Quickly


Ford (F) recently decided to split off its electric vehicle division (EV). It said it will spend $50 billion over the next five years and expects to build 2 million electric cars in 2026. General Motors (GM) announced that they are building a facility in Canada to produce cathode-active material for EV batteries. Tesla’s total 2021 sales were up 87% over the prior year. This would all seem to be occurring at a time when cheaper to operate cars are needed most, as the cost of fueling internal combustion vehicles has risen so much. But have price increases to owning EVs also climbed to the point of increasing the cost of operation?

Background

For Tesla (TSLA), Rivian (RIVN), Lucid (LCID) and other EV companies, higher oil prices would seem to add demand for their alternative products.  But natural resources used in car manufacturing, especially EVs have been driven higher. Increased prices for nickel, steel, lithium, and other metals and minerals critical to car manufacturing impact EV production costs. Crude for weight-reducing plastics that are especially important in EVs, along with the chip supply shortage, makes the math favoring EVs less appealing than it may appear on the surface. 

Skyrocketing crude oil prices have made it make it instantly more expensive for gas and diesel vehicles to travel each mile relative to anytime over the past 21 years. Does this make EVs much more attractive for cost-conscious drivers? 


As U.S. crude is now well over $100 per barrel, with prices continuing to rise, U.S. average gasoline prices in early March exceeded $4.17 a gallon.  These are the highest levels since 2001.

If one is considering selling their traditional car and purchasing an EV, the sticker price of the EV may be increasing quite a bit over the previous year, and likely much quicker than gas-powered cars.

Inflation Problem

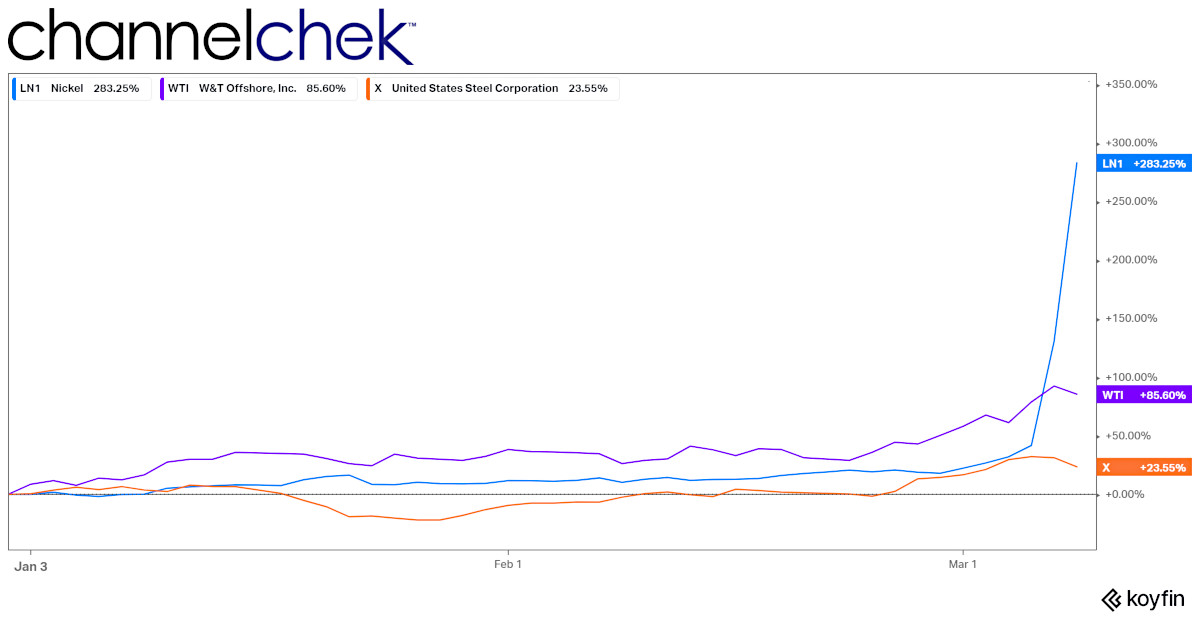
The blue line in the chart above marked LN1 represents the percentage increase in Nickel. The futures price for LN1 has risen 283% year-to-date. The cost of nickel accounts for a third of the price of a battery.  The orange line is steel used in both traditional autos and EVs, and the purple line is crude prices, it reflects the cost of the raw materials for lightweight plastic, which is relied upon in EVs more than traditional cars.

Other critical metals used in a lithium-ion battery are also skyrocketing. Benchmark lithium prices have gained about 75% this year. Cobalt prices are up more than 10%. And, depending on the type of battery, iron could also be used.

Minerals inflation has added roughly $2,000 to the average price of an EV so far in 2022, according to Barron’s. Their analysts tried to quantify the cost to EV margins a/o March 8). The Barron’s analysts concluded nickel prices alone could pull 2% off gross profit per car (based on spot prices).

Prices are higher, EVs are heavily impacted, and it is something buyers and manufacturers will have to grapple with. Additionally, investors need to pay attention. EV manufacturer Rivian Automotive (RIVN) announced a large price hike on March 1, the stock then sold off 13.5% on a day when the S&P 500 rose 1.9%.

Take-Away

The economics of running out and selling an internal combustion engine vehicle for a new electric car is constantly changing and a little less appealing than it had been. In addition to all the shared components between traditional and EVs, the cost of batteries is heading higher, and so are the prices of steel, aluminum, copper, and other things that go into any car. Raising prices may decrease sales, and this is a concern for investors.


Paul Hoffman

Managing Editor, Channelchek

Suggested Reading


The Future of Electric Vehicles


Copper Facing an Onslaught of Demand


Nancy Pelosi’s Coattail Investors Get an Update


Raw Materials and the Scalability of Tesla

Sources

https://www.barrons.com/articles/rivian-raises-prices-increase-hike-stock-51646230528?mod=md_stockoverview_news&mod=article_inline

https://www.barrons.com/market-data/stocks/rivn

https://www.barrons.com/articles/things-to-know-today-51646648813

WWW.Koyfin.com


Stay up to date. Follow us:


Can Icahn and Buffett Both be Right on Occidental Petroleum?


Carl Icahn Selling into Warren Buffet’s Buying, Can they Both be Right?


“We started buying on Monday, and we bought all we could,” Warren Buffett told CNBC. The Berkshire Hathaway CEO was discussing a new 91.2 million share stake his company took in Occidental Petroleum (OXY). At the same time, Carl Icahn, another renowned investor, has been selling shares of OXY. Can they both be right?


Warren Buffet on OXY

Buffett pulled the trigger on $4.5 billion of Occidental, an energy exploration and production company, last week.  This gives Berkshire close to a 10% stake in the company. This is an increase in exposure for Berkshire as it also has positions worth $10 billion of preferred shares, along with warrants to buy 83.9 million common shares exercisable at $59.62.

Berkshires 2021 annual report showed they held $144 billion in cash and equivalents.

Carl Icahn on OXY

Billionaire investor Carl Icahn, sold his remaining lot of OXY last week. According to The Wall Street Journal, Icahn made about $1 billion on Occidental stock and still holds about 15 million in warrants (OXY WS). The warrants, which trade at around $34, have an exercise price of $22 a share (current level $57-$58).

Icahn still continues to have exposure to the energy sector through a roughly 6.4% stake worth $2 billion in Cheniere Energy (LNG), a liquefied natural gas producer, and a controlling interest worth $1 billion in CVR Energy (CVI), a petroleum refiner.

The activist investor became involved with Occidental in 2019 around the same time as Buffett. He urged the company to not pursue the debt-financed deal for Anadarko, which Buffett was for and helped enable with loans. Berkshire’s warrants and preferred shares were part of financing the arrangement.


Buffett vs Icahn

When you find two legendary investors taking opposite sides of the same trade at the same time, in a sector that is moving quickly, it’s worth stopping to try to understand why. Berkshire Hathaway’s Buffet, who is 91, was a heavy buyer of OXY while Carl Icahn, 86, was selling a huge position put on in 2019.

Description:
Since March 2019 OXY has consistently performed below the energy sector and S&P 500


There have been other times when one of these two was buying into the other’s selling. In 2016, Icahn exited a position in Apple (AAPL) he had held for about three years. Also, in 2016 Buffett began scaling into Apple. Icahn made a reported $2 billion profit on 180 million shares of Apple. It is unclear if the redeployment of the proceeds of this sale outpaced the earnings that would have occurred if he held Apple, which has grown 500% since.

Apple has been Buffett’s biggest public market win in the past decade. Berkshire holds about 900 million shares worth $145 billion, more than four times its cost.

Investment Styles

As an activist investor, Icahn’s primary methodology is to own a significant enough amount of a company to influence how the company is run. If a profit presents itself, he is likely to take it. Such was the case with the doubling of OXY in two months’ time this year.

Berkshire’s portfolio is mostly non-public companies it owns outright. As for publicly traded stocks, Buffett’s style is to be patient waiting for value in terms of price and potential.  Buffett has described his favorite holding period as “forever.”

Berkshire is also cash-heavy and should like to deploy $80 billion, but has been priced out of stocks and acquisitions for several years now. With recent market weakness, there may be some big purchases on the horizon.

Take-Away

Investors have different time frames and risk tolerance. More active traders like Icahn may sell if they see other opportunities where they believe the capital could produce a better return, whereas Berkshire’s longer-term view and huge cash position, could make their transactions based on a totally different set of factors. For Berkshire, this purchase may be as easy to understand as asking “do we expect OXY to perform better than cash.”


Paul Hoffman

Managing Editor, Channelchek


Suggested Reading


Using Warren Buffett’s SEC Filing as an Oracle


Cathie Wood Says Benchmark Funds are Where the Risk Is


Michael Burry vs Cathie Wood is Not an Even Competition


Warren Buffett vs Elon Musk, Who’s Right


Sources

https://channelchek.vercel.app/news-channel/Pros_and_Cons_of_a_Company_Like_Berkshire_Hathaway_in_your_Portfolio

https://www.cnbc.com/2022/03/05/berkshire-hathaway-reveals-5-billion-stake-in-oil-giant-occidental-petroleum.html

https://www.sec.gov/Archives/edgar/data/315090/000089924322009579/xslF345X03/doc4.xml

https://www.barrons.com/articles/warren-buffett-was-buying-occidental-carl-icahn-was-selling-who-will-be-right-51646672487?mod=hp_columnists


Stay up to date. Follow us:


Alvopetro Announces 2021 Year End Reserves With a 52% Increase In 2P NPV Before Tax


Alvopetro Announces 2021 Year End Reserves With a 52% Increase In 2P NPV Before Tax

News, and Market Data on Alvopetro Energy


CALGARY, ABMarch 8, 2022 /CNW/ – Alvopetro Energy Ltd. (TSXV:ALV) (OTCQX: ALVOF) announces our reserves as at December 31, 2021 with total proved plus probable (“2P”) reserves of 8.7 mmboe and a before tax net present value discounted at 10% of $297.0 million.  The before tax net present value of our 2P reserves (discounted at 10%) increased by 52% from December 31, 2020, primarily due to increases in forecasted natural gas prices. 2P reserve volumes decreased by 9% due to 2021 production. In addition, Alvopetro announces the December 31, 2021 assessment of the Company’s Murucututu natural gas resource (previously referred to as the Gomo natural gas resource) with risked best estimate contingent resource of 3.5 mmboe and risked best estimate prospective resource of 12.1 mmboe, both of which are virtually unchanged from December 31, 2020.  The Murucututu natural gas contingent and prospective resource values (risked best estimate net present value before tax, discounted at 10%) increased by 61% to $60.7 million and by 44% to $208.7 million, respectively.  The reserves and resources data set forth herein is based on an independent reserves and resources assessment and evaluation prepared by GLJ Ltd. (“GLJ”) dated March 7, 2022 with an effective date of December 31, 2021 (the “GLJ Reserves and Resources Report”).  

All references herein to $ refer to United States dollars, unless otherwise stated.

December 31, 2021 GLJ Reserves and Resource Report Highlights

  • 2P net present value before tax discounted at 10% increased 52% to $297.0 million primarily due to higher forecasted commodity prices.
  • Proved reserves (“1P”) and 2P reserves decreased to 4.4 mmboe (-13%) and 8.7 mmboe (-9%) respectively, due to 2021 production volumes.
  • This represents a 2P Net Asset Value of CAD$11.20/share ($8.77/share).
  • Risked best estimate contingent and risked best estimate prospective resource of 3.5 mmboe and 12.1 mmboe, respectively were consistent with prior year with an increase of 61% and 44% respectively on risked best estimate before tax net present value discounted at 10%, due primarily to higher forecasted commodity prices.

Corey Ruttan, President and Chief Executive Officer, commented:

“Our 2021 year-end reserves and resource evaluations highlight the strong profitability from our Caburé natural gas field and the long-term potential of our Murucututu project. The increase in forecasted cash flows reflects the impact of global commodity prices on our forecasted natural gas prices under our long-term gas sales agreement and our most recent price increase effective February 1, 2022. Our 2022 capital program is focused on natural gas exploration and development aimed at expanding our production and reserve base and maximizing the utilization of our strategic midstream infrastructure that is concurrently being expanded to a capacity of at least 500,000 m3/d (17.7 mmcfpd).”

SUMMARY

December 31, 2021 Gross Reserve and Gross Resource Volumes: (1)(5)(6)(7)(8)(9)(10)(11)(14)

December 31, 2021 Reserves (Gross)

Total Proved(1P)

Total Proved plus Probable(2P)

Total Proved plus Probable plus Possible (3P)

(Mboe)

(Mboe)

(Mboe)

Caburé Property

3,224

5,141

6,796

Murucututu Property

1,024

3,286

5,974

Other Properties

173

310

606

Total Company Reserves

4,421

8,737

13,376

See ‘Footnotes’ section at the end of this news release

December 31, 2021 Murucututu Resources (Gross)

Low Estimate

Best Estimate

 High Estimate

(Mboe)

(Mboe)

(Mboe)

Risked Contingent Resource

Risked Prospective Resource

2,715

6,555

3,465

12,127

5,697

17,937

See ‘Footnotes’ section at the end of this news release

Net present value before tax discounted at 10%:(2)(5)(6)(7)(8)(9)(10)(11)(12)(13)

Reserves

1P

2P

3P

(MUS)

(MUS)

(MUS)

Caburé Property

150,414

216,859

265,483

Murucututu Property

20,239

72,307

135,821

Other Properties

3,107

7,833

15,418

Total Company

173,759

297,000

416,723

See ‘Footnotes’ section at the end of this news release

Murucututu Resource

Low Estimate

Best Estimate

 High Estimate

(MUS)

(MUS)

(MUS)

Risked Contingent Resource

Risked Prospective Resource

48,505

100,348

60,669

208,677

108,043

312,055

See ‘Footnotes’ section at the end of this news release

NET ASSET VALUE

Following the December 31, 2021 reserves evaluation, based on the before tax net present value of Alvopetro’s 2P reserves (discounted at 10%), our total net asset value is $297.3 millionCAD$11.20 per common share outstanding.  Our 2P net asset value of $297.3 million is before including the before tax net present value (discounted at 10%) of our risked best estimate risked contingent resource of $60.7 million and our risked prospective resource of $208.7 million from the Murucututu natural gas field.

Net Asset Value (in MUS, other than per share amounts)

1P

2P

3P

Before Tax Net Present Value, discounted at 10% (MUS)

173,759

297,000

416,723

Working capital net of debt – as at September 30, 2021(a)(b)

294

294

294

Total Net Asset Value(b),(c)(d)

174,053

297,294

417,017

CAD per basic share(e)

6.56

11.20

15.71

a)

Working capital net of debt is computed as the Company’s net working capital the carrying amount of the Company’s Credit Facility, decreased by net working capital surplus, as of September 30, 2021.

b)

Non-GAAP measure. See ‘Non-GAAP Measures‘ in this news release.

c)

Alvopetro has reflected the contractual obligations pursuant to our September 2018 Gas Treatment Agreement with Enerflex, including the equipment rental component of the agreement which is treated as a right of use asset and reflected as a capital lease obligation on our financial statements. As the future capital lease payments reduce the forecasted future net revenue in all reserves categories, the capital lease obligation as reflected on the Company’s financial statements has not been included in the table above.

d)

The net asset value reflected above includes the present value of before tax cash flows from the Company’s reserves only. No amounts have been included with respect to contingent or prospective resource volumes.

e)

Converted to Canadian dollars (“CAD”) based on the exchange rate on March 7, 2022. The per share calculation is computed based on 33.9 million common shares outstanding as of March 7, 2022.

PRICING ASSUMPTIONS – FORECAST PRICES AND COSTS 

GLJ employed the following pricing and inflation rate assumptions as of January 1, 2022 in the GLJ Reserves and Resources Report in estimating reserves and resources data using forecast prices and costs.

Year

Brent Blend Crude Oil FOB North Sea ($/Bbl) 

National Balancing Point (UK)($/mmbtu)

NYMEX Henry Hub Near Month Contract($/mmbtu)

Alvopetro-Bahiagas Gas Contract$/mmbtu(Current Year)

Alvopetro-Bahiagas Gas Contract$/mmbtu(Previous Year)

Change from prior year

2022

76.00

20.75

3.80

9.51

6.40

49%

2023

72.51

12.00

3.50

10.09

6.65

52%

2024

71.24

8.50

3.15

9.86

6.89

43%

2025

72.66

8.67

3.21

9.00

7.14

26%

2026

74.12

8.84

3.28

8.89

7.31

22%

2027

75.59

9.02

3.34

8.99

7.45

21%

2028

77.11

9.20

3.41

9.15

7.59

21%

2029

78.66

9.39

3.48

9.33

7.74

21%

2030

80.22

9.57

3.55

9.52

7.90

21%

2031*

81.83

9.76

3.62

9.71

8.06

20%

*Escalated at 2% per year thereafter

As of February 1, 2022, Alvopetro’s contracted natural gas price under the terms of our long-term gas sales agreement is based on the ceiling price within the contract and is forecasted to remain at the ceiling price until 2024. The forecasted prices in the GLJ Reserves and Resource Report do not reflect the most recent increase in global commodity prices which further extends the period under which Alvopetro’s contracted price will be at the ceiling in the contract.  The ceiling price incorporates assumed US inflation of 5% in 2022, 3% in 2023 and 2% thereafter.

GLJ RESERVES AND RESOURCES REPORT 

The GLJ Reserves and Resources Report has been prepared in accordance with the standards contained in the Canadian Oil and Gas Evaluation Handbook (“COGEH”) that are consistent with the standards of National Instrument 51-101 (“NI 51-101”). GLJ is a qualified reserves evaluator as defined in NI 51-101. The GLJ Reserves and Resources Report was an evaluation of all reserves of Alvopetro including our Caburé and Caburé Leste natural gas fields (collectively referred to as our Caburé natural gas field), our Murucututu natural gas project (previously referred to as Gomo), as well as our Bom Lugar and Mãe-da-lua oil fields. The GLJ Reserves and Resources Report also includes an evaluation of the gas resources of our Murucututu natural gas.  In addition to the reserves assigned to our two existing Murucututu wells (197-1 and 183-1) and two additional development locations, contingent resource was assigned to the area in proximity to our existing Murucututu reserves, deemed to be discovered.  The area mapped by 3D seismic west and north of the area defined as contingent was assigned prospective resource. Additional reserves and resources information as required under NI 51-101 will be included in the Company’s Annual Information Form for the 2021 fiscal year which will be filed on SEDAR by April 30, 2022.

December 31, 2021 Reserves Information:

Summary of Reserves (1)(3)(4)(5)(7)(8)

Light & Medium Oil

Residue Gas

Natural Gas Liquids

Oil Equivalent

Company Gross

Company Net

Company Gross

Company Net

Company Gross

CompanyNet

Company Gross

Company Net

(Mbbl)

(Mbbl)

(MMcf)

(MMcf)

(Mbbl)

(Mbbl)

(Mboe)

(Mboe)

Proved

Producing

0

0

18,267

17,287

180

171

3,224

3,052

Developed Non-Producing

26

23

2,095

1,953

52

48

427

397

Undeveloped

147

138

3,254

3,012

80

74

770

714

Total Proved

173

161

23,616

22,252

312

294

4,421

4,163

      Probable

137

128

22,731

21,331

390

365

4,316

4,048

Total Proved plus Probable

310

289

46,347

43,583

702

659

8,737

8,212

      Possible

296

277

23,401

21,866

443

413

4,639

4,334

Total Proved plus Probable plus Possible

606

565

69,748

65,448

1,146

1,072

13,376

12,545

See ‘Footnotes’ section at the end of this news release

Summary of Before Tax Net Present Value of Future Net Revenue – MUS (2)(5)(7)(8)(12)(13)

Undiscounted

5%

10%

15%

20%

Proved

Producing

175,800

162,812

150,414

139,568

130,152

Developed Non-Producing

13,952

10,341

7,977

6,411

5,327

Undeveloped

35,028

22,103

15,369

11,298

8,559

Total Proved

224,780

195,256

173,759

157,277

144,037

       Probable

267,646

168,096

123,240

96,623

78,449

Total Proved plus Probable

492,425

363,352

297,000

253,900

222,486

       Possible

316,880

175,731

119,723

89,422

70,217

Total Proved plus Probable plus Possible

809,305

539,083

416,723

343,322

292,703

See ‘Footnotes’ section at the end of this news release

Summary of After Tax Net Present Value of Future Net Revenue – MUS (2)(5)(7)(8)(12)(13)

Undiscounted

5%

10%

15%

20%

Proved

Producing

158,208

146,984

136,050

126,439

118,078

Developed Non-Producing

11,493

8,683

6,730

5,402

4,469

Undeveloped

26,984

17,474

12,283

9,039

6,802

Total Proved

196,686

173,141

155,064

140,880

129,349

       Probable

207,798

135,466

100,859

79,563

64,708

Total Proved plus Probable

404,484

308,607

255,923

220,443

194,057

       Possible

241,128

139,526

97,153

73,331

57,863

Total Proved plus Probable plus Possible

645,612

448,133

353,076

293,774

251,919

See ‘Footnotes’ section at the end of this news release

Future Development Costs (2)(5)(7)(8)(12)(13)

The table below sets out the total development costs deducted in the estimation in the GLJ Reserves and Resources Report of future net revenue attributable to proved reserves, proved plus probable reserves and proved plus probable plus possible reserves (using forecast prices and costs), by field. Total development costs include capital costs for drilling and facility and pipeline expenditures but excludes abandonment and reclamation costs.

Under each reserve category, Alvopetro has elected to reflect 100% of the contractual obligations pursuant to our Gas Treatment Agreement with Enerflex, including all operating, capital, and related financing costs for the full duration of the agreement. These costs are mainly attributable to the Caburé field and also represent the majority of the future development costs for the Caburé field in the table below. The future costs associated with equipment rental are also reflected as a capital lease obligation on our financial statements other than future anticipated equipment rental costs associated with the facility expansion, which will be reflected once completed.

The future development costs for the Murucututu field in the proved category are for the remaining costs anticipated in 2022 for the pipeline and field facility development to tie-in the 183(1) well to Alvopetro’s midstream assets, as well as a development location. In the probable and possible categories, there are future development costs for an additional development location and the stimulation and tie-in of the 197(1) well. Also included in the Murucututu future development costs for all reserve categories are a portion of the anticipated contractual obligations associated with the expansion of the gas treatment facility. The future development costs for Bom Lugar in the proved category include costs for a directional wellbore and facilities upgrade. A second directional well is included in the future development costs for the possible category for Bom Lugar. Future development costs at the Mãe-da-lua field relate to a stimulation of the existing producing well.

MUS, Undiscounted

2022

2024

2024

2025

2026

Remaining

Total

Proved

Caburé Natural Gas Field 

3,000

1,730

1,730

1,730

5,096

13,286

Murucututu Gas Field

10,550

433

441

11,424

Bom Lugar Oil Field

333

2,771

3,104

Mãe-da-lua Oil Field

439

439

Total Proved

13,883

5,373

2,171

1,730

5,096

28,253

Proved Plus Probable

Caburé Natural Gas Field

3,000

1,730

1,730

1,730

1,730

4,237

14,157

Murucututu Gas Field

16,350

1,463

441

450

459

468

19,631

Bom Lugar Oil Field

333

3,517

3,850

Mãe-da-lua Oil Field

0

439

439

Total Proved Plus Probable

19,638

7,149

2,171

2,180

2,189

4,705

38,078

Proved Plus Probable Plus Possible

Caburé Natural Gas Field

3,000

1,730

1,730

1,730

1,730

5,786

15,706

Murucututu Gas Field

16,350

1,463

441

450

459

946

20,109

Bom Lugar Oil Field

333

7,514

7,847

Mãe-da-lua Oil Field

0

439

439

Total Proved Plus Probable Plus Possible

19,683

11,146

2,171

2,180

2,189

6,732

44,101

See ‘Footnotes’ section at the end of this news release

Reconciliation of Alvopetro’s Gross Reserves (Before Royalty) (1)(5)(7)(8)(13)


Proved(Mboe)


Probable(Mboe)


Proved Plus Probable(Mboe)


Possible(Mboe)

Proved plus Probable plus Possible

(Mboe)

December 31, 2020


5,108

4,485

9,593

4,615

14,209

Extensions

176

(176)

Technical Revisions

(12)

11

(1)

24

23

Economic Factors

9

(4)

5

5

Production

(861)

(861)

(861)

December 31, 2021

4,421

4,316

8,737

4,639

13,376

See ‘Footnotes’ section at the end of this news release

December 31, 2021 Murucututu Contingent Resources Information:

Summary of Unrisked Company Gross Contingent Resources (1)(3)(4)(5)(7)(10)(11)

Development Pending Economic Contingent Resources

Low Estimate

Best Estimate

 High Estimate

Residue gas (MMcf)

15,719

20,061

32,984

Natural gas liquids (Mbbl)

389

496

815

Oil equivalent (Mboe)

3,008

3,839

6,313

See ‘Footnotes’ section at the end of this news release.

Summary of Before Tax Net Present Value of Future Net Revenue of Unrisked Contingent Resources- MUS (2)(5)(10)(11)(12)(13)

Undiscounted

5%

10%

15%

20%

Low Estimate

158,700

84,965

53,745

37,370

27,487

Best Estimate

222,759

109,139

67,223

46,563

34,432

High Estimate

415,317

193,940

119,715

84,746

64,509

See ‘Footnotes’ section at the end of this news release.

The GLJ Contingent Resource Report for Murucututu assumes capital deployment during 2023 for the drilling of wells and expansion of facilities, with total project costs of $23.9 million and first commercial production in 2023. There can be no certainty that the project will developed on the timelines discussed herein. Development of the project is dependent on several contingencies as further described in this news release.  The information presented herein is based on company net project development costs.

Summary of Development Pending Risked Company Gross Contingent Resources(1)(3)(4)(5)(7)(10)(11)

The GLJ Reserves and Resources Report estimates the Chance of Development as the product of two main contingencies associated with the project development, which are: 1) the probability of corporate sanctioning, which GLJ estimates at 95%; 2) the probability finalization of a development plan, which GLJ estimates at 95%. The product of these two contingencies is 90%.   As there is no risk related to discovery, the Chance of Commerciality for the contingent resource is therefore 90% which is the risk factor that has been applied to the Development Risked company gross contingent resources and the net present value figures reported below.

Low Estimate

Best Estimate

 High Estimate

Residue gas (MMcf)

14,187

18,105

29,768

Natural Gas Liquids (Mbbl)

351

448

736

Oil equivalent (Mboe)

2,715

3,465

5,697

See ‘Footnotes’ section at the end of this news release.

Summary of Development Pending Risked Before Tax Net Present Value of Future Net Revenue of Contingent Resources- MUS(2)(5)(10)(11)(12)(13)

Undiscounted

5%

10%

15%

20%

Low Estimate

143,226

76,681

48,505

33,726

24,807

Best Estimate

201,040

98,498

60,669

42,023

31,074

High Estimate

374,824

175,031

108,043

76,483

58,219

See ‘Footnotes’ section at the end of this news release.

December 31, 2021 Murucututu Prospective Resources Information:

Summary of Unrisked Company Gross Prospective Resources (1)(3)(4)(5)(7)(9)(11)

Prospective Resources

Low

Best

High

Residue gas (MMcf)

42,228

78,126

115,553

Natural gas liquids (Mbbl)

1,044

1,931

2,856

Oil equivalent (Mboe)

8,082

14,952

22,115

See ‘Footnotes’ section at the end of this news release.

Summary of Before Tax Net Present Value of Future Net Revenue of Unrisked Prospective Resources- MUS (2)(5)(9)(11)(12)(13)

Undiscounted

5%

10%

15%

20%

Low Estimate

474,489

220,405

123,722

77,245

51,350

Best Estimate

1,005,490

449,220

257,284

167,675

117,555

High Estimate

1,584,857

678,025

384,741

252,103

178,690

See ‘Footnotes’ section at the end of this news release.

The GLJ Prospective Resource Report for Murucututu assumes capital deployment starting 2024 for the drilling of wells, expansion of field facilities, and additional pipeline capacity, with total project costs of $66.1 million and first commercial production in 2024. There can be no certainty that the project will developed on the timelines discussed herein. Development of the project is dependent on several contingencies as further described in this news release.  The information presented herein is based on company project development costs.

The GLJ Reserves and Resources Report estimates the Chance of Commerciality as the product between the Chance of Discovery and the Chance of Development. The Chance of Discovery of the prospective resources has been assessed at 90%, while the Chance of Development has been assessed as the same as for the Contingent Resources described above at 90%. The resulting Chance of Commerciality is 81%, which has been applied to the company gross unrisked prospective resources and the net present value figures reported below.   

Summary of Development Risked Company Gross Prospective Resources(1)(3)(4)(5)(7)(9)(11)

The GLJ Reserves and Resources Report estimates the Chance of Commerciality as the product between the Chance of Discovery and the Chance of Development. The Chance of Discovery of the prospective resources has been assessed at 90%, while the Chance of Development has been assessed as the same as for the Contingent Resources described above at 90%. The resulting Chance of Commerciality is 81%, which has been applied to the company gross unrisked prospective resources and the net present value figures reported below.   

Low

Best

High

Residue gas (MMcf)

34,250

63,366

93,723

Natural gas liquids (Mboe)

847

1,566

2,317

Oil equivalent (Mboe)

6,555

12,127

17,937

See ‘Footnotes’ section at the end of this news release.

Summary of Development Risked Before Tax Net Present Value of Future Net Revenue of Prospective Resources- MUS(2)(5)(9)(11)(12)(13)

Undiscounted

5%

10%

15%

20%

Low Estimate

384,847

178,765

100,348

62,652

41,649

Best Estimate

815,529

364,352

208,677

135,997

95,346

High Estimate

1,285,440

549,930

312,055

204,475

144,931

See ‘Footnotes’ section at the end of this news release.

Upcoming 2021 Results and Live Webcast

Alvopetro anticipates announcing its 2021 fourth quarter and year-end results on March 17, 2022 after markets close and will host a live webcast to discuss the results at 8:00 am Mountain time, on the March 18, 2022. Details for joining the event are as follows:

DATE: March 18, 2022TIME: 8:00 AM Mountain/10:00 AM EasternLINK: https://zoom.us/j/99386897923  DIAL-IN NUMBERS: https://zoom.us/u/aixrWbAbO  WEBINAR ID: 993 8689 7923

The webcast will include a question and answer period. Online participants will be able to ask questions through the Zoom portal. Dial-in participants can email questions directly to socialmedia@alvopetro.com.

Corporate Presentation

Alvopetro’s updated corporate presentation is available on our website at:

http://www.alvopetro.com/corporate-presentation

FOOTNOTES

(1)

Mboe = thousands of barrels of oil equivalent.

(2)

MUS = 000’s of U.S. dollars.

(3)

Mbbl = thousands of barrels.

(4)

MMcf = Million cubic feet.

(5)

References to Company Gross reserves or Company Gross Resources means the total working interest share of remaining recoverable reserves or resources owned by Alvopetro before deductions of royalties payable to others and without including any royalty interests owned by Alvopetro. 

(6)

References to “Other Properties” refers to the Company’s Bom Lugar and Mae-da-lua oil fields.

(7)

The tables above are a summary of the reserves of Alvopetro and the net present value of future net revenue attributable to such reserves as evaluated in the GLJ Reserves and Resources Report based on forecast price and cost assumptions. The tables summarize the data contained in the GLJ Reserves and Resources Report and as a result may contain slightly different numbers than such report due to rounding. Also due to rounding, certain columns may not add exactly.

(8)

Possible reserves are those additional reserves that are less certain to be recovered than probable reserves.  There is a 10% probability that the quantities actually recovered will equal or exceed the sum of proved plus probable plus possible reserves.

(9)

Prospective Resources – Prospective Resources are defined in the COGE Handbook as those quantities of petroleum estimated, as of a given date, to be potentially recoverable from undiscovered accumulations by application of future development projects.  Prospective resources have both an associated chance of discovery and a chance of development.  There is no certainty that any portion of the prospective resources will be discovered and even if discovered, there is no certainty that it will be commercially viable to produce any portion. Prospective Resources are further subdivided in accordance with the level of certainty associated with recoverable estimates assuming their discovery as described in footnote 11.

(10)

Contingent Resources are defined in the COGE Handbook as those quantities of petroleum estimated, as of a given date, to be potentially recoverable from known accumulations using established technology or technology under development, but are not currently considered to be commercially recoverable due to one or more contingencies. Contingencies may include factors such as economic, legal, environmental, political and regulatory matters or a lack of markets. It is also appropriate to classify as contingent resources the estimated discovered recoverable quantities associated with a project in the early evaluation stage.  Contingent Resources are further classified in accordance with the level of certainty associated with the estimates as described in footnote 11 and may be subclassified based on project maturity and/or characterized by their economic status. The Contingent Resources estimated in the GLJ Reserves and Resources Report are classified as “economic contingent resources”, which are those contingent resources that are currently economically recoverable.  All such resources are further sub-classified with a project status of “development pending”, meaning that resolution of the final conditions for development are being actively pursued. The recovery estimates of the Company’s contingent resources provided herein are estimates only and there is no guarantee that the estimated resources will be recovered. There is uncertainty that it will be commercially viable to produce any portion of the resources. Actual recovered resource may be greater than or less than the estimates provided herein.

(11)

Low Estimate: This is considered to be a conservative estimate of the quantity that will actually be recovered. It is likely that the actual remaining quantities recovered will exceed the low estimate. If probabilistic methods are used, there should be at least a 90 percent probability (P90) that the quantities actually recovered will equal or exceed the low estimate.

Best Estimate: This is considered to be the best estimate of the quantity that will actually be recovered. It is equally likely that the actual remaining quantities recovered will be greater or less than the best estimate. If probabilistic methods are used, there should be at least a 50 percent probability (P50) that the quantities actually recovered will equal or exceed the best estimate.

High Estimate: This is considered to be an optimistic estimate of the quantity that will actually be recovered. It is unlikely that the actual remaining quantities recovered will exceed the high estimate. If probabilistic methods are used, there should be at least a 10 percent probability (P10) that the quantities actually recovered will equal or exceed the high estimate.

(12)

The net present value of future net revenue attributable to Alvopetro’s reserves and resources are stated without provision for interest costs and general and administrative costs, but after providing for estimated royalties, production costs, development costs, other income, future capital expenditures, well abandonment and reclamation costs for only those wells assigned reserves and material dedicated gathering systems and facilities. The net present values of future net revenue attributable to the Alvopetro’s reserves and resources estimated by GLJ do not represent the fair market value of those reserves. Other assumptions and qualifications relating to costs, prices for future production and other matters are summarized herein. The recovery and reserve and resource estimates of the Company’s reserves and resources provided herein are estimates only and there is no guarantee that the estimated reserves and resources will be recovered. Actual reserves and resources may be greater than or less than the estimates provided herein.

(13)

GLJ’s January 1, 2022 escalated price forecast is used in the determination of future gas sales prices under Alvopetro’s long-term gas sales agreement and for all forecasted oil sales and natural gas liquids sales. See https://www.gljpc.com/sites/default/files/pricing/jan22.pdf  for GLJ’s price forecast.

(14)

The GLJ Reserves and Resources Report was an evaluation of the Company’s contingent and prospective resource of the Company’s Murucututu natural gas project and excluded an evaluation of the 183-B1 and 182-C1 exploration prospects which were evaluated by GLJ in an independent resource assessment dated September 4, 2020 with an effective date of July 31, 2020. For further details, see our September 8, 2020 press release and the annual information for the year-ended December 31, 2020 which has been filed on SEDAR.

Alvopetro Energy Ltd.’s vision is to become a leading independent upstream and midstream operator in Brazil. Our strategy is to unlock the on-shore natural gas potential in the state of Bahia in Brazil, building off the development of our Caburé natural gas field and our strategic midstream infrastructure.

Neither the TSX Venture Exchange nor its Regulation Services Provider (as that term is defined in the policies of the TSX Venture Exchange) accepts responsibility for the adequacy or accuracy of this news release.

All amounts contained in this news release are in United States dollars, except as otherwise noted.

Oil and Natural Gas Reserves. The disclosure in this news release summarizes certain information contained in the GLJ Reserves and Resources Report but represents only a portion of the disclosure required under NI 51-101. Full disclosure with respect to the Company’s reserves as at December 31, 2021 will be contained in the Company’s annual information form for the year ended December 31, 2021 which will be filed on SEDAR (www.sedar.com) on or before April 30, 2022. All net present values in this press release are based on estimates of future operating and capital costs and GLJ’s forecast prices as of December 31, 2021. The reserves definitions used in this evaluation are the standards defined by COGEH reserve definitions and are consistent with NI 51-101 and used by GLJ. The net present values of future net revenue attributable to the Alvopetro’s reserves estimated by GLJ do not represent the fair market value of those reserves. Other assumptions and qualifications relating to costs, prices for future production and other matters are summarized herein. The recovery and reserve estimates of the Company’s reserves provided herein are estimates only and there is no guarantee that the estimated reserves will be recovered. Actual reserves may be greater than or less than the estimates provided herein. Possible reserves are those additional reserves that are less certain to be recovered than probable reserves. There is a 10% probability that the quantities actually recovered will equal or exceed the sum of proved plus probable plus possible reserves.

Contingent Resources. This news release discloses estimates of Alvopetro’s contingent resources and the net present value associated with net revenues associated with the production of such contingent resources as included in the GLJ Reserves and Resources Report. There is no certainty that it will be commercially viable to produce any portion of such contingent resources and the estimated future net revenues do not necessarily represent the fair market value of such contingent resources. Estimates of contingent resources involve additional risks over estimates of reserves. Full disclosure with respect to the Company’s contingent resources as at December 31, 2021 will be contained in the Company’s annual information form for the year ended December 31, 2021 which will be filed on SEDAR (www.sedar.com) on or before April 30, 2022.

Prospective Resources – This news release discloses estimates of Alvopetro’s prospective resources included in the GLJ Reserves and Resources Report. There is no certainty that any portion of the prospective resources will be discovered and even if discovered, there is no certainty that it will be commercially viable to produce any portionEstimates of prospective resources involve additional risks over estimates of reserves. The accuracy of any resources estimate is a function of the quality and quantity of available data and of engineering interpretation and judgment. While resources presented herein are considered reasonable, the estimates should be accepted with the understanding that reservoir performance subsequent to the date of the estimate may justify revision, either upward or downward. Full disclosure with respect to the Company’s prospective resources as at December 31, 2021 will be contained in the Company’s annual information form for the year ended December 31, 2021 which will be filed on SEDAR (www.sedar.com) on or before April 30, 2022.

Abbreviations:

1P

=

proved reserves

2P

=

proved plus probable reserves

3P

=

proved plus probable plus possible reserves

CAD$

=

Canadian dollars

F&D

=

finding and development costs

FDC

=

future development costs;

Mboe

=

thousand barrels of oil equivalent

MMbtu

=

million British Thermal Units

MMcf

=

million cubic feet

MMcf/d

=

million cubic feet per day

MMboe

=

million barrels of oil equivalent

MMUS

=

millions of U.S. dollars

MUS

=

thousands of U.S. dollars


BOE Disclosure. The term barrels of oil equivalent (“boe”) may be misleading, particularly if used in isolation. A boe conversion ratio of six thousand cubic feet per barrel (6Mcf/bbl) of natural gas to barrels of oil equivalence is based on an energy equivalency conversion method primarily applicable at the burner tip and does not represent a value equivalency at the wellhead. All boe conversions in this news release are derived from converting gas to oil in the ratio mix of six thousand cubic feet of gas to one barrel of oil.

Forward-Looking Statements and Cautionary Language. This news release contains “forward-looking information” within the meaning of applicable securities laws. The use of any of the words “will”, “expect”, “intend” and other similar words or expressions are intended to identify forward-looking information. Forward–looking statements involve significant risks and uncertainties, should not be read as guarantees of future performance or results, and will not necessarily be accurate indications of whether or not such results will be achieved. A number of factors could cause actual results to vary significantly from the expectations discussed in the forward-looking statements. These forward-looking statements reflect current assumptions and expectations regarding future events. Accordingly, when relying on forward-looking statements to make decisions, Alvopetro cautions readers not to place undue reliance on these statements, as forward-looking statements involve significant risks and uncertainties. More particularly and without limitation, this news release contains forward-looking information concerning the plans relating to the Company’s operational activities and the expected natural gas price, gas sales and gas deliveries under Alvopetro’s long-term gas sales agreement. The forward–looking statements are based on certain key expectations and assumptions made by Alvopetro, including but not limited to equipment availability, the timing of regulatory licenses and approvals, the success of future drilling, completion, testing, recompletion and development activities, the outlook for commodity markets and ability to access capital markets, the impact of the COVID-19 pandemic, the performance of producing wells and reservoirs, well development and operating performance, foreign exchange rates, general economic and business conditions, weather and access to drilling locations, the availability and cost of labour and services, environmental regulation, including regulation relating to hydraulic fracturing and stimulation, the ability to monetize hydrocarbons discovered, the regulatory and legal environment and other risks associated with oil and gas operations. The reader is cautioned that assumptions used in the preparation of such information, although considered reasonable at the time of preparation, may prove to be incorrect. Actual results achieved during the forecast period will vary from the information provided herein as a result of numerous known and unknown risks and uncertainties and other factors.  Although Alvopetro believes that the expectations and assumptions on which such forward-looking information is based are reasonable, undue reliance should not be placed on the forward-looking information because Alvopetro can give no assurance that it will prove to be correct. Readers are cautioned that the foregoing list of factors is not exhaustive. Additional information on factors that could affect the operations or financial results of Alvopetro are included in our annual information form which may be accessed on Alvopetro’s SEDAR profile at www.sedar.com. The forward-looking information contained in this news release is made as of the date hereof and Alvopetro undertakes no obligation to update publicly or revise any forward-looking information, whether as a result of new information, future events or otherwise, unless so required by applicable securities laws.

Non-GAAP Measures. This news release contains financial terms that are not considered measures under International Financial Reporting Standards (“IFRS”), such as working capital net of debt and net asset value. Working capital net of debt is computed as current assets less the sum of current liabilities and the carrying amount of the Company’s credit facility. Net asset value is computed based on the before-tax net present value of the Company’s proved plus probable reserves, discounted at 10%, increased by the Company’s working capital net of debt.  The non-GAAP measures do not have standardized meanings under IFRS and therefore are unlikely to be comparable to similar measures presented by other issuers. While these measures may be common in the oil and gas industry, the Company’s use of these terms may not be comparable to similarly defined measures presented by other companies. The non-GAAP measures referred to in this report should not be considered an alternative to, or more meaningful than measures prescribed by IFRS and they are not meant to enhance the Company’s reported financial performance or position.  For more information with respect to financial measures which have not been defined by GAAP, including reconciliations to the closest comparable GAAP measure, see the “Non-GAAP Measures” section of the Company’s most recent MD&A which may be accessed through the SEDAR website at www.sedar.com.

SOURCE Alvopetro Energy Ltd.

Defense Metals Corp. Continues to Drill High Grade at Wicheeda With 3.23% Total Rare Earth Oxide Over 162 Metres; Including 4.21% Over 45 Metres From Surface


Defense Metals Corp. Continues to Drill High Grade at Wicheeda With 3.23% Total Rare Earth Oxide Over 162 Metres; Including 4.21% Over 45 Metres From Surface

News, and Market Data on Defense Metals


News Release – Vancouver, British Columbia –March 8, 2022:Defense Metals Corp. (“Defense Metals” or the “Company”) (TSX-V:DEFN / OTCQB:DFMTF / FSE:35D) is pleased to announce results for an additional six diamond drill holes totalling 845 metres from the Company’s 29 hole, 5,349 metre diamond drill program completed during fall 2021. Drill holes WI21-39 and WI21-40 collared from the same pad, and holes WI21-41 through WI21-44 sited 100 metres north were designed to further delineate the Wicheeda Rare Earth Element (REE) deposit.

Drill hole WI21-40 returned 3.23% TREO (total rare earth oxide) over 162 metres[1] Along with previously reported drill hole WI21-33 on section grading 3.17% TREO over 196 metres, these two holes yielded the highest-grade x width of the 2021 drill program to date. In addition to significant composite mineralized widths, these holes continue to demonstrate the presence of higher-grade zones of carbonatite at surface and at depth extending below the current resource pit shell.

The Company continues to receive additional assay results from the 2021 Wicheeda REE Deposit resource expansion and delineation campaign that will be released in the coming days and weeks.

Luisa Moreno, President, and Director of Defense Metals commented: “Drilling at depth within the northern Wicheeda Deposit has intersected significant new zones of high-grade REE mineralization with the potential to expand the mineral resource, and importantly may also contribute to supporting higher grades across the range of potential mine life.”

Resource infill drill hole WI21-39 (-60o dip / 285o azimuth) returned assays of 2.62% TREO over 110 metres1andin conjunction with WI21-36 and WI21-37 completes sectional drilling within the northern quarter of the Wicheeda Deposit confirming the presence of high-grade dolomite carbonatite within 2019 near surface drill holes to a vertical depth of 175 metres and horizontal width of 160 metres (Table 1 and Figure 1).

Delineation drill hole WI21-40 (-60o dip / 285o azimuth) intersected mineralized dolomite carbonate from surface grading 3.23% TREO over 162 metres1; including higher grade intervals from surface of 4.21% TREO over 44.75 metres1, and at depth of 3.67% TREO over 71 metres1 extending 15 metres below the current resource pit shell (Figure 2). Importantly drill holes WI21-33, WI21-36, and WI21-40 establish the presence of a previously unrecognized zone of high-grade dolomite carbonate at depth within the northeast quadrant of the Wicheeda Deposit. Mineralized zones within WI21-40W and WI21-33 extend downhole 60 and 80 metres respectively below the current resource, and 15 and 32 metres below the resource pit shell providing the potential to expand mineral resources.

Drill hole WI21-44 (-60o dip / 240o azimuth) collared 100metres to the north intersected a mixed interval of dolomite carbonatite near surface and REE mineralized syenite at depth high averaging 1.72% TREO over 108 metres; including 2.59% TREO over 54 metres near surface (Figure 3).

[1]TREO % sum of CeO2, La2O3, Nd2O3, Pr6O11, Sm2O3, Eu2O3, Gd2O3, Tb4O7, Dy2O3 and Ho2O3.


[1] The true width of REE mineralization is estimated to be 70-100% of the drilled interval.

Table 1. Wicheeda REE Deposit 2021 Diamond Drill Intercepts

Hole ID From (m) To (m) Interval (m) TREO[1] (%) Ce2O(%) La2O(%) Nd2O(%) Pr2O(%) Sm2O(ppm) Gd2O3 (ppm) Eu2O3 (ppm) Dy2O3 (ppm) Tb4O7 (ppm) Ho2O3 (ppm)
WI21-39 (285/-60) 4 114 110 2.62 1.28 0.87 0.30 0.10 320 158 73 42 13 5
and 114 224.8 110.8 0.72 0.35 0.21 0.10 0.03 129 75 31 30 8 4
WI21-40 (345/-65) 2.75 165 162.25 3.23 1.57 1.11 0.36 0.13 370 158 70 39 13 4
including 2.75 47.5 44.75 4.21 2.05 1.46 0.46 0.16 452 197 92 61 18 7
including 96 167 71 3.67 1.79 1.26 0.41 0.14 411 173 75 35 13 3
WI21-43 (045/-85) 10.75 124.1 113.35 0.55 0.26 0.17 0.07 0.02 121 84 33 35 9 5
WI21-44 (240/-60) 17.5 125.6 108.1 1.72 0.83 0.57 0.20 0.07 266 141 69 47 14 6
including 35 89 54 2.59 1.24 0.87 0.29 0.10 384 205 102 70 20 9
WI21-33 (350/-80) 5.00 201.00 196 3.17 1.52 1.07 0.37 0.13 382 181 81 42 14 4
including 5.00 55.25 50.25 3.63 1.74 1.26 0.41 0.14 396 181 84 52 16 6
including 146.00 201.00 55.00 4.29 2.07 1.48 0.47 0.17 489 232 112 52 18 5
WI21-34 (040/-55) 3.00 117.00 114.00 2.97 1.46 1.02 0.33 0.11 323 134 58 23 9 2
including 3.00 70.00 67.00 3.84 1.89 1.34 0.41 0.15 379 160 69 29 11 3
WI21-35 (080/-55) 1.20 121.00 119.80 3.87 1.87 1.34 0.43 0.15 434 200 88 52 17 6
WI21-36 (108/-80) 1.10 174.00 172.90 2.34 1.14 0.78 0.27 0.09 293 134 59 35 11 4
including 1.10 35.65 34.55 3.45 1.66 1.21 0.38 0.13 374 170 72 37 13 4
including 136.00 174.00 38.00 3.02 1.46 1.05 0.33 0.12 337 157 68 40 13 4
WI21-37 (108/-45) 2.00 139.85 137.85 3.19 1.56 1.10 0.35 0.12 351 144 66 30 11 3
including 2.00 57.00 55.00 4.00 1.96 1.38 0.42 0.15 427 164 76 35 12 3
WI21-38 (220/-70) 1.35 82.00 80.65 3.08 1.50 1.07 0.33 0.12 346 154 70 40 13 4
including 1.35 24.75 23.4 6.01 2.91 2.14 0.62 0.23 607 246 114 60 20 6

A series of short drill holes WI21-41 (-55o dip / 025o azimuth), WI21-42 (-70o dip / 025o azimuth), and WI21-43 (-85o dip / 045o azimuth) totalling 285 metres successfully delineated the northeast margin of the deposit. Drill hole WI21-43 intersected several carbonate dykes, syenite and limestone host rocks above resource cut-off averaging 0.55% TREO over 113 metres (Figure 3).    

Figure 1. Drill Section Holes WI21-36, WI21-37, and WI21-39

Figure 2. Drill Section Holes WI21-33, WI21-36, and WI21-40

Figure 3. Drill Section Holes WI21-43 and WI21-44

About the Wicheeda REE Property

The 100% owned 2,008-hectare Wicheeda REE Property, located approximately 80 km northeast of the city of Prince George, British Columbia, is readily accessible by all-weather gravel roads and is near infrastructure, including power transmission lines, the CN railway, and major highways.

The Wicheeda REE Project yielded a robust 2021 PEA that demonstrated an after-tax net present value (NPV@8%) of $517 million, and 18% IRR[1]. A unique advantage of the Wicheeda REE Project is the production of a saleable high-grade flotation-concentrate. The PEA contemplates a 1.8 Mtpa (million tonnes per year) mill throughput open pit mining operation with 1.75:1 (waste:mill feed) strip ratio over a 19 year mine (project) life producing and average of 25,423 tonnes REO annually. A Phase 1 initial pit strip ratio of 0.63:1 (waste:mill feed) would yield rapid access to higher grade surface mineralization in year 1 and payback of $440 million initial capital within 5 years.

Methodology and QA/QC

The analytical work reported on herein was performed by ALS Canada Ltd. (ALS) at Langley (sample preparation) and Vancouver (ICP-MS fusion), B.C. ALS is an ISO-IEC 17025:2017 and ISO 9001:2015 accredited geoanalytical laboratory and is independent of the Defense Metals and the QP. Drill core samples were subject to crushing at a minimum of 70% passing 2 mm, followed by pulverizing of a 250-gram split to 85% passing 75 microns. A 0.1-gram sample pulp was then subject to multi-element ICP-MS analysis via lithium-borate fusion to determine individual REE content (ME-MS81h). Defense Metals follows industry standard procedures for the work carried out on the Wicheeda Project, with a quality assurance/quality control (QA/QC) program. Blank, duplicate, and standard samples were inserted into the sample sequence sent to the laboratory for analysis. Defense Metals detected no significant QA/QC issues during review of the data.

Qualified Person

The scientific and technical information contained in this news release as it relates to the Wicheeda REE Project has been reviewed and approved by Kristopher J. Raffle, P.Geo. (BC) Principal and Consultant of APEX Geoscience Ltd. of Edmonton, AB, a director of Defense Metals and a “Qualified Person” as defined in NI 43-101. Mr. Raffle verified the data disclosed which includes a review of the sampling, analytical and test data underlying the information and opinions contained therein.  

About Defense Metals Corp.

Defense Metals Corp. is a mineral exploration and development company focused on the acquisition, exploration and development of mineral deposits containing metals and elements commonly used in the electric power market, defense industry, national security sector and in the production of green energy technologies, such as, rare earths magnets used in wind turbines and in permanent magnet motors for electric vehicles. Defense Metals owns 100% of the Wicheeda Rare Earth Element Property located near Prince George, British Columbia, Canada. Defense Metals Corp. trades in Canada under the symbol “DEFN” on the TSX Venture Exchange, in the United States, under “DFMTF” on the OTCQB and in Germany on the Frankfurt Exchange under “35D”.

For further information, please contact:

Todd Hanas, Bluesky Corporate Communications Ltd.

Vice President, Investor Relations

Tel: (778) 994 8072

Email: todd@blueskycorp.ca

Neither the TSX Venture Exchange nor its Regulation Services Provider (as that term is defined in the policies of the TSX Venture Exchange) accepts responsibility for the adequacy or accuracy of this news release.

Cautionary Statement Regarding “Forward-Looking” Information

This news release contains “forward?looking information or statements” within the meaning of applicable securities laws, which may include, without limitation, statements relating to advancing the Wicheeda REE Project, drill results including anticipated timeline of such results/assays, the Company’s plans for its Wicheeda REE Project, expanded resource and scale of expanded resource, expected results and outcomes, the technical, financial and business prospects of the Company, its project and other matters. All statements in this news release, other than statements of historical facts, that address events or developments that the Company expects to occur, are forward-looking statements. Although the Company believes the expectations expressed in such forward-looking statements are based on reasonable assumptions, such statements are not guarantees of future performance and actual results may differ materially from those in the forward-looking statements. Such statements and information are based on numerous assumptions regarding present and future business strategies and the environment in which the Company will operate in the future, including the price of rare earth elements, the anticipated costs and expenditures, the ability to achieve its goals, that general business and economic conditions will not change in a material adverse manner, that financing will be available if and when needed and on reasonable terms. Such forward-looking information reflects the Company’s views with respect to future events and is subject to risks, uncertainties and assumptions, including the risks and uncertainties relating to the interpretation of exploration results, risks related to the inherent uncertainty of exploration and cost estimates, the potential for unexpected costs and expenses and those other risks filed under the Company’s profile on SEDAR at www.sedar.com. While such estimates and assumptions are considered reasonable by the management of the Company, they are inherently subject to significant business, economic, competitive and regulatory uncertainties and risks. Factors that could cause actual results to differ materially from those in forward looking statements include, but are not limited to, continued availability of capital and financing and general economic, market or business conditions, adverse weather and climate conditions, failure to maintain or obtain all necessary government permits, approvals and authorizations, failure to maintain community acceptance (including First Nations), risks relating to unanticipated operational difficulties (including failure of equipment or processes to operate in accordance with specifications or expectations, cost escalation, unavailability of materials and equipment, government action or delays in the receipt of government approvals, industrial disturbances or other job action, and unanticipated events related to health, safety and environmental matters), risks relating to inaccurate geological and engineering assumptions, decrease in the price of rare earth elements, the impact of Covid-19 or other viruses and diseases on the Company’s ability to operate, an inability to predict and counteract the effects of COVID-19 on the business of the Company, including but not limited to, the effects of COVID-19 on the price of commodities, capital market conditions, restriction on labour and international travel and supply chains, loss of key employees, consultants, or directors, increase in costs, delayed drilling results, litigation, and failure of counterparties to perform their contractual obligations. The Company does not undertake to update forward?looking statements or forward?looking information, except as required by law.


[1] Independent Preliminary Economic Assessment for the Wicheeda Rare Earth Element Project, British Columbia, Canada, dated January 6, 2022, with an effective date of November 7, 2021, and prepared by SRK Consulting (Canada) Inc. is filed under Defense Metals Corp.’s Issuer Profile on SEDAR (www.sedar.com).