Price Moves When Warren Buffett Buys and Sells (Based on May 16 SEC Filing)


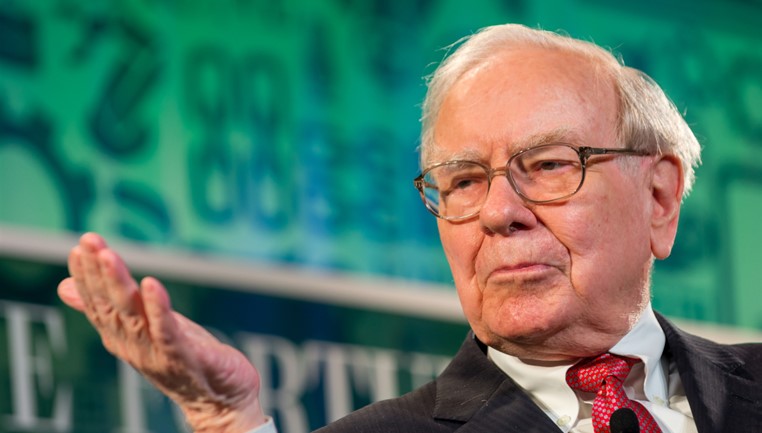
Image Credit: Fortune Live Media (Flickr)


The Big Price Impact on Stocks After Warren Buffett’s Most Active Buying Spree

Warren Buffett and Berkshire Hathaway (BRK.A, BRK.B) were actively spending down the company’s large pool of cash last quarter, just as they promised during their recent annual meeting. This makes sense as some stock prices are lower than they have been in years, and a few sectors are showing they could have plenty of upside potential. It makes even more sense when you consider that Berkshire Hathaway was sitting on $144 billion in cash. The inflation rate is now running above 8% and eroding the value of every unearning penny.

Jumping into the market can be costly if wrong, but investor’s ‘dry powder’ is being eroded with increased costs by the day – finding a place for money to grow by at least the inflation rate would seem prudent. The analysts at Berkshire Hathaway are certainly aware of this.

The positive impact of Berkshire showing confidence in a company is often all that is needed to exceed the near non-earnings holding a cash position. Below we look at three Berkshire Hathaway changed positions as reported on May 16, and then compare the stock’s price moves versus the overall market.

Where Did They Gain Exposure

As revealed by the companies 13F filed on May 16, as of March 31 Berkshire Hathaway added Citigroup (C), Paramount Global (PARA), and sold Verizon (VZ). There were older positions added to as well, such as Chevron (CVX), and Activision Blizzard (ATVI). But for the purpose of showing the power of Buffett’s believing a stock is attractive, or in Verizon’s case, no longer attractive, we’ll take a look at the market moves of these companies as of 1pm the day after the 13F was made public.


Source: Koyfin

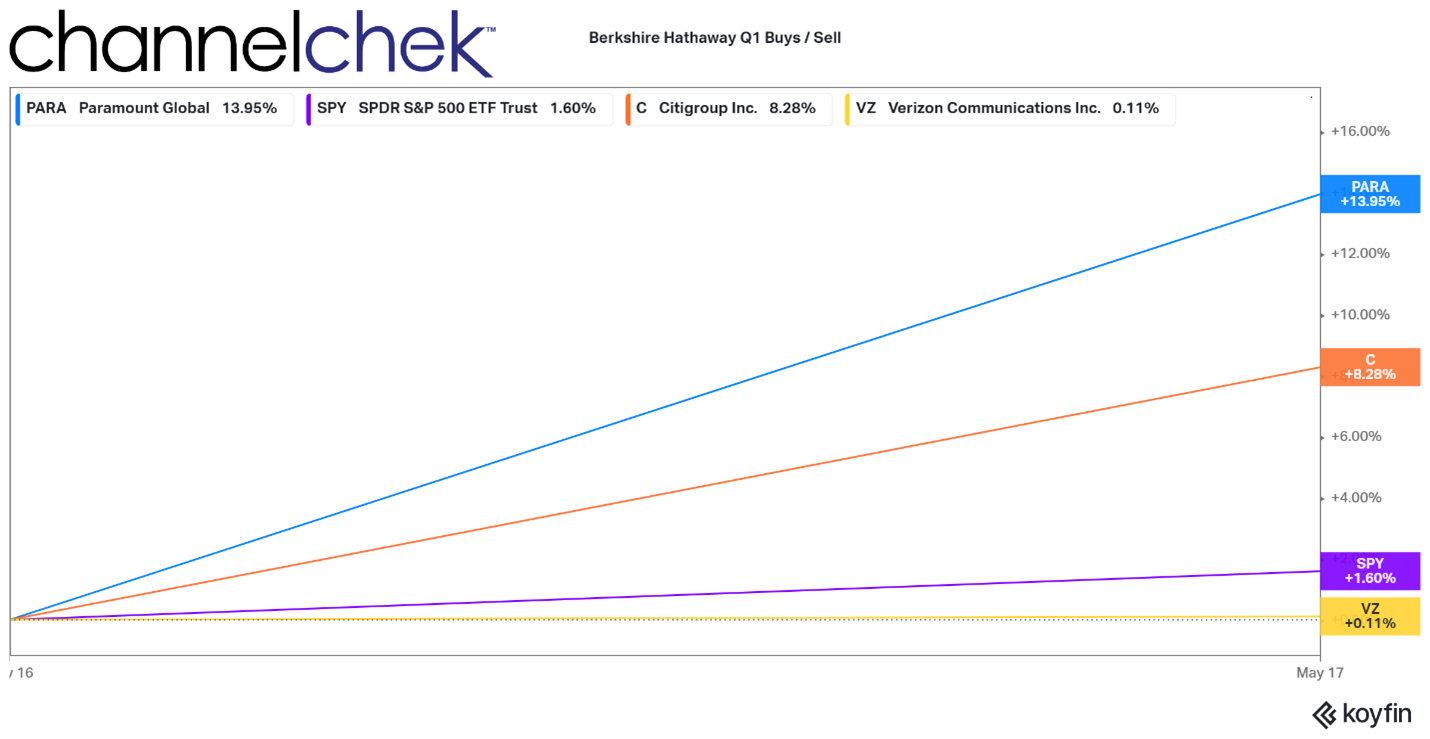
The above chart of Citibank, Paramount Global, and
Verizon from the beginning trading on Monday compares the stocks to the S&P
500 performance during the same short period.


The S&P, as reflected during the short period in this chart, beginning on the date of Berkshire’s 13F filing, shows the S&P 500 up 1.60%. This is substantial in a year when the index has mostly been delivering red to investors. Verizon was the most noteworthy sale of Buffett as they brought their position near zero. The company’s stock rose only 0.11%, well below the S&P benchmark performance.

As for the positions opened during the first quarter by Berkshire Hathaway, Citicorp shot up 8.28%. Paramount Global reacted even more strongly, rising double digits to 13.95%. 

Lessons

While an SEC-registered portfolio new holdings are kept close to the vest before reported in order to avoid insider trading problems, listening to what someone like Warren Buffett is saying at annual meetings and at other times can allow you to get a sense if they have been active, and in what industries. More important, is whether they are active buying or selling. For an investor that is holding a stock which a well-followed investor has decided to sell, can cause significant underperformance for at least the near term.

Other Pertinent Info from the 13F Filing

During the first quarter of 2022, the value of Berkshire’s US stock portfolio rose by 10% to $364 billion. Buffett had indicated the firm he manages has been struggling to find bargains in recent years. He blamed this on stocks swelling to record highs, fierce competition from private equity firms, and SPACs which increased competition and costs of acquisitions. Even Berkshire’s own rising stock price made it unappealing as a company stock buy-back.

A change of appetite took place in the first quarter of 2022. Berkshire bought $51 billion worth of equities and sold less than $10 billion in stocks. Its net cash reduction of $41 billion helped slash its cash pile by 28% to $106 billion. Q1 2022 marked one of the most active buying periods in Berkshire Hathaway’s history.

Take-Away

Well known, successful investors can either make a winner out of your holding or cause it to trade at a pace below the market. While knowing and trading on information before it is made public can get you in trouble, investors like Buffett do provide guidance. These hints as to their thinking and likely direction may help investors somewhat. This is why it always makes sense to know what they’re saying – it isn’t fun holding something they just reported sold, and the tailwind they create when you’re long the same company can be profitable.

Paul Hoffman

Managing Editor, Channelchek

Suggested Content


Using Warren Buffett’s SEC Filing as an Oracle


Cathie Wood Says Benchmark Funds are Where the Risk Is


Is the SEC conducting “Unfounded Investigations” of Elon Musk?


Warren Buffett vs Elon Musk, Who’s Right?

Sources

https://www.sec.gov/Archives/edgar/data/1067983/000095012322006442/xslForm13F_X01/primary_doc.xml

https://whalewisdom.com/filer/berkshire-hathaway-inc#google_vignette

www.koyfin.com

Stay up to date. Follow us:


Michael Burry’s Stock Market Holdings (Filed May 16, 2022)


Image Credit: Pixabay (Pexels)


Michael Burry’s Latest Portfolio Brings the FAANGS Out

On Monday, May 16, Michael Burry filed his company’s holdings report with the SEC. Relative to the previous quarter, there was significant reshuffling. While it’s rare to get an explanation of his thinking beyond an occasional tweet of warning or tweet of frustration, his quarterly positions report is worth reviewing. It lends a rare clue as to what the celebrated hedge fund manager is expecting.

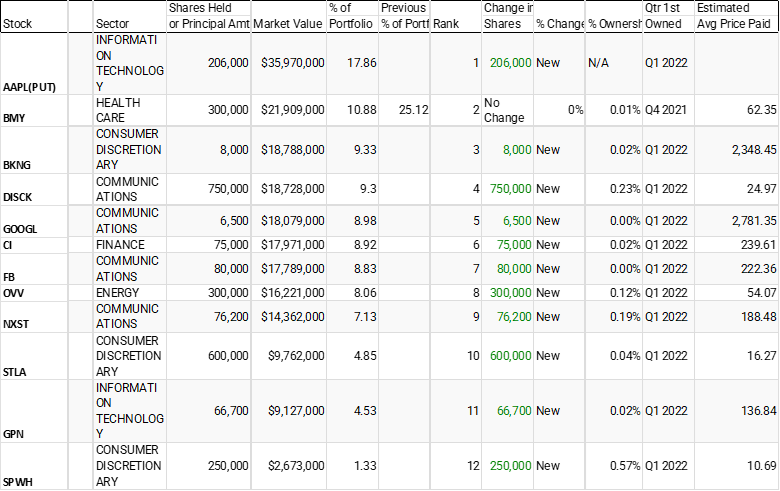
Michael Burry’s thinking, reflected in Scion Asset Management’s 13F holdings (a/o March 31), are shown below. Following the holdings we offer company descriptions and some thinking related to a few of the holdings.


Source: WhaleWisdom

Why it Matters

The positions in Scions portfolio are usually few, quite deliberate, and not the result of herd thinking. During the prior quarter (Q4 2021), among the scant positions were two public prison stocks ($GEO and $CXW). While many pundits and YouTube “gurus” hazarded a guess as to what Burry may have expected to occur with crime, the positions may have had nothing to do with an expected need for jail cells. Following the stock tickers links above to the Channelchek reports discloses that public policy on for-profit prisons is in flux. The positions may have just been a play on policy direction.

Burry’s investment universe is broader than the average self-directed investor and even deeper than the average hedge fund manager. The positions report reflect just those required to be disclosed in an SEC 13F filing. With this in mind, out of the entire universe of public securities Scion could hold, there are only a dozen that Burry’s portfolio felt were worthy at the end of the first quarter. One is a Put position which effectively makes him short the stock and possibly expecting more red than green, but not necessarily.


Holdings Breakdown

Scion has a Put on Apple (AAPL) with contracts to control 206,000 shares. The portfolio is also long shares of two other megacap high-tech stocks adding to a similar notional amount. Of the three, based on price earnings ratio, Apple is by far the most expensive. Apple’s P/E is at 23.7 earnings, while Google/Alphabet (GOOGL) is trading at a much lower PE of 20.7x, and Facebook/Meta (FB) is even lower yet at 15.1x price to earnings. This AAPL Put may not be a bet against Apple as much as it is a play that FAANG stocks should trade with multiples more in-line with each other. If this is the case, he’s not looking to hit a home run, but instead looking for movement either down by Apple, or up by the two other FAANG stocks to net incremental capital gains.

Since the 4Q of 2021, he has held Bristol Myers Squibb (BMY).  Year-to-date 2022 the biopharmaceutical company is up 19% vs the S&P 500 which is down 9.8%. Discover Network C shares (DISCK) is his fourth largest by market value. The C shares of Discovery allow no voting rights. Discovery’s A shares allow one vote per share, and B shares 10 votes per share.

Moving down the list shows a very diversified portfolio of long positions including Cigna (CI) a health care insurer, Ovintiv (OVV) a Canadian based fossil fuel company trading at 8x earnings, and Nexstar Media (NXST) which is a media company that owns television broadcast networks not unlike DISCK.

Stellantis NV (STLA) is a Dutch automaker trading on the NYSE and London exchanges. It owns the Chrysler and Jeep brands as well as Alpha Romeo, Peugeot, and Maserati. STLA pays above-average annual dividends. It declared a dividend on February 25, with an ex-dividend date of April 19. The period covered in Scion’s 13F is through March 31. 

In the consumer discretionary category Scion’s portfolio held two companies month-end that stand to benefit as consumers fill their need to travel and play outdoors. Bookings.com (BKNG) which is a huge online travel website and retailer Sportsman’s Warehouse (SPWH) which is a small-cap value stock trading at only 3.75x earnings.

The last is a payment tech company called Global Payments (GPN). The company’s product line runs the full gamut of electronic merchant payment products.

 Take-Away

Dr. Michael J. Burry has an excellent record of spotting investment opportunities before the rest of the market. His picks are as disparate as the mortgage market in 2008 and GameStop (GME) in 2020.

The portfolio reported by the SEC on May 16, reflecting March 31 quarter-end holdings does not have a strong theme. The most talked-about position has been the Puts on Apple. As mentioned, that play may be more complicated and be a hedge involving other long holdings.

Sign-up to receive Channelchek updates in your inbox.

Paul Hoffman

Managing Editor, Channelchek

Suggested Content


Michael Burry Sees Positive in Elon Musk’s Twitter Stake


Why Michael Burry has Better Opportunity Than Cathie Wood


Is the Index Bubble Michael Burry Warned About Still Looming?


Michael Burry’s Stock Market Holdings (Filed Feb 14, 2022)

Sources

https://www.sec.gov/Archives/edgar/data/0001768023/000156761922010751/xslForm13F_X01/primary_doc.xml

https://whalewisdom.com/filer/scion-asset-management-llc#tabholdings_tab_link

www.koyfin.com

Stay up to date. Follow us:


Alvopetro Energy (ALVOF) – A strong quarter as higher prices take effect

Monday, May 16, 2022

Alvopetro Energy (ALVOF)
A strong quarter as higher prices take effect

Alvopetro Energy Ltd.’s vision is to become a leading independent upstream and midstream operator in Brazil. Our strategy is to unlock the on-shore natural gas potential in the state of Bahia in Brazil, building off the development of our Caburé natural gas field and our strategic midstream infrastructure.

Michael Heim, CFA, Senior Research Analyst, Noble Capital Markets, Inc.

Refer to the full report for the price target, fundamental analysis, and rating.

First quarter results reflect higher prices. Revenues in the 2022 first quarter were $14.0m versus $6.9m and our $13.4m projection. Higher revenues reflect a 15% increase in production and a 48% increase in prices ($10.03/mcf). As a result of higher prices, operating netbacks rose to $53.94/boe from $28.52/boe. This is one of the best netbacks in the industry. 

Cash flow is soaring. Funds from operations rose to $10.9m versus $4.8m. The company has been active with its cash flow increasing its capital expenditures, paying down debt, and raising the dividend. Working capital less debt switched over to a positive position a few quarters ago and is now $7.3 million. With debt levels soon to be eliminated, the stakeholder focus will soon shift to equity shareholders. We expect additional dividend increases in upcoming quarters and would not be surprised to see the company initiate a share repurchase program in 2023….

This Company Sponsored Research is provided by Noble Capital Markets, Inc., a FINRA and S.E.C. registered broker-dealer (B/D).

*Analyst certification and important disclosures included in the full report. NOTE: investment decisions should not be based upon the content of this research summary. Proper due diligence is required before making any investment decision. 

Codere Online (CDRO) – Is The Market Bigger Than Expected?

Monday, May 16, 2022

Codere Online (CDRO)
Is The Market Bigger Than Expected?

Codere Online refers, collectively, to Codere Online Luxembourg, S.A. and its subsidiaries. Codere Online launched in 2014 as part of the renowned casino operator Codere Group. Codere Online offers online sports betting and online casino through its state-of-the art website and mobile application. Codere currently operates in its core markets of Spain, Italy, Mexico, Colombia, Panama and the City of Buenos Aires (Argentina). Codere Online’s online business is complemented by Codere Group’s physical presence throughout Latin America, forming the foundation of the leading omnichannel gaming and casino presence in the region.

Michael Kupinski, Director of Research, Noble Capital Markets, Inc.

Patrick McCann, Research Associate, Noble Capital Markets, Inc.

Refer to the full report for the price target, fundamental analysis, and rating.

Q1 results. The company reported Q1 revenue of €25.5 million, representing 24% year-over-year growth and a strong 15% quarterly sequential revenue growth. The growth was driven primarily by the Mexico market, which grew to €10 million in revenue compared with €6.4 million in the prior year period.

Expanding user base. Monthly active users in the quarter totaled roughly 83,000, up a strong 22% year-over-year. Growth in monthly actives in Mexico, one of its largest markets, was even more impressive, up 31%, the key driver of user growth.  

This Company Sponsored Research is provided by Noble Capital Markets, Inc., a FINRA and S.E.C. registered broker-dealer (B/D).

*Analyst certification and important disclosures included in the full report. NOTE: investment decisions should not be based upon the content of this research summary. Proper due diligence is required before making any investment decision. 

CoreCivic, Inc. (CXW) – Time Has Come Today

Monday, May 16, 2022

CoreCivic, Inc. (CXW)
Time Has Come Today

CoreCivic is a diversified, government-solutions company with the scale and experience needed to solve tough government challenges in flexible, cost-effective ways. We provide a broad range of solutions to government partners that serve the public good through high-quality corrections and detention management, a network of residential and non-residential alternatives to incarceration to help address America’s recidivism crisis, and government real estate solutions. We are the nation’s largest owner of partnership correctional, detention and residential reentry facilities, and believe we are the largest private owner of real estate used by government agencies in the United States. We have been a flexible and dependable partner for government for nearly 40 years. Our employees are driven by a deep sense of service, high standards of professionalism and a responsibility to help government better the public good. Learn more at www.corecivic.com.

Joe Gomes, Senior Research Analyst, Noble Capital Markets, Inc.

Joshua Zoepfel, Research Associate, Noble Capital Markets, Inc.

Refer to the full report for the price target, fundamental analysis, and rating.

A New Credit Facility….Friday, CoreCivic reported it had entered into a New Credit Agreement effectively replacing the Company’s existing senior secured credit facilities. As of March 31st, CoreCivic had $167.5 million due April 2023 under its Term Loan A and $124 million due December 2024 under its Term Loan B outstanding under the old facility. Management indicated the possibility of repaying the Term Loan A out of existing cash once a new facility was in place.

…Equals Time for a Stock Buyback. Management has stated on numerous occasions that once a new credit facility was in place, authorization for a stock buyback program would be submitted to the Board. Given where the stock is currently trading and the strong, stable cash flow generation of the business, we believe the Board will grant such request. We believe a program in the $100 million range, or about 7.5% of the current market cap, would send a strong signal to the market….

This Company Sponsored Research is provided by Noble Capital Markets, Inc., a FINRA and S.E.C. registered broker-dealer (B/D).

*Analyst certification and important disclosures included in the full report. NOTE: investment decisions should not be based upon the content of this research summary. Proper due diligence is required before making any investment decision. 

Digerati Technologies (DTGI) – A Consistent Message To Investors

Monday, May 16, 2022

Digerati Technologies (DTGI)
A Consistent Message To Investors

Digerati Technologies, Inc. (OTCQB: DTGI) is a provider of cloud services specializing in UCaaS (Unified Communications as a Service) solutions for the business market. Through its operating subsidiaries, T3 Communications (T3com.com), Nexogy (Nexogy.com), SkyNet Telecom (Skynettelecom.net) and NextLevel Internet (nextlevelinternet.com), the Company is meeting the global needs of small businesses seeking simple, flexible, reliable, and cost effective communication and network solutions including cloud PBX, cloud telephony, cloud WAN, cloud call center, cloud mobile, and the delivery of digital oxygen on its broadband network.

Michael Kupinski, Director of Research, Noble Capital Markets, Inc.

Patrick McCann, Research Associate, Noble Capital Markets, Inc.

Refer to the full report for the price target, fundamental analysis, and rating.

Non deal road show highlights. This report provides highlights of a non deal road show hosted by Arthur Smith, CEO, to investors in St. Louis last week. Mr. Smith outlined the company’s dual-path of organic growth and a roll-up acquisition strategy. After completing six acquisitions in under 5 years, the company is on a path to achieve a revenue run-rate of $50 million in the medium term. 

Solid business metrics. Mr. Smith indicated a goal to achieve an organic growth rate between 5% and 10% on top of the acquisition-fueled growth. Given the low churn rate of the company’s recent acquisition targets, the overall churn rate is likely to be around a favorable 0.7% in the near term, well below larger peers that lack Digerati’s high-touch customer service. Attracting high-margin recurring revenue streams on multi-year contracts is a competitive advantage for the company….

This Company Sponsored Research is provided by Noble Capital Markets, Inc., a FINRA and S.E.C. registered broker-dealer (B/D).

*Analyst certification and important disclosures included in the full report. NOTE: investment decisions should not be based upon the content of this research summary. Proper due diligence is required before making any investment decision. 

One Stop Systems (OSS) – Keep on Truckin’

Monday, May 16, 2022

One Stop Systems (OSS)
Keep on Truckin’

One Stop Systems, Inc. (OSS) designs and manufactures innovative AI Transportable edge computing modules and systems, including ruggedized servers, compute accelerators, expansion systems, flash storage arrays, and Ion Accelerator™ SAN, NAS, and data recording software for AI workflows. These products are used for AI data set capture, training, and large-scale inference in the defense, oil and gas, mining, autonomous vehicles, and rugged entertainment applications. OSS utilizes the power of PCI Express, the latest GPU accelerators and NVMe storage to build award-winning systems, including many industry firsts, for industrial OEMs and government customers. The company enables AI on the Fly® by bringing AI datacenter performance to ‘the edge,’ especially on mobile platforms, and by addressing the entire AI workflow, from high-speed data acquisition to deep learning, training, and inference. OSS products are available directly or through global distributors. For more information, go to www.onestopsystems.com.

Joe Gomes, Senior Research Analyst, Noble Capital Markets, Inc.

Joshua Zoepfel, Research Associate, Noble Capital Markets, Inc.

Refer to the full report for the price target, fundamental analysis, and rating.

1Q22 Results. One Stop Systems reported record first quarter revenue of $17.1 million, up 28% y-o-y and above management’s $16.8 million guide. We had forecast $16.8 million. GAAP net income of $579,200, or $0.03 per share, versus net income of $41,300, or breakeven per share, last year. Adjusted net income of $978,000, or $0.05 per share, versus $644,000, or $0.03 per share in 1Q21. We had forecast $0.02 and $0.04 respectively.

Disguise, Bressner Driving Results. OSS’s media and entertainment client, Disguise had a record revenue quarter for OSS, with revenue now greater than the pre-COVID environment. The return of in-person events accounted for a significant portion of the revenue increase. Bressner revenue increased 37% y-o-y, driven by ongoing improvement in the European economy as COVID impacts diminish.

This Company Sponsored Research is provided by Noble Capital Markets, Inc., a FINRA and S.E.C. registered broker-dealer (B/D).

*Analyst certification and important disclosures included in the full report. NOTE: investment decisions should not be based upon the content of this research summary. Proper due diligence is required before making any investment decision. 

QuoteMedia Inc. (QMCI) – Pieces Falling into Place

Monday, May 16, 2022

QuoteMedia Inc. (QMCI)
Pieces Falling into Place

QuoteMedia is a leading software developer and cloud-based syndicator of financial market information and streaming financial data solutions to media, corporations, online brokerages, and financial services companies. The Company licenses interactive stock research tools such as streaming real-time quotes, market research, news, charting, option chains, filings, corporate financials, insider reports, market indices, portfolio management systems, and data feeds. QuoteMedia provides industry leading market data solutions and financial services for companies such as the Nasdaq Stock Exchange, TMX Group (TSX Stock Exchange), Canadian Securities Exchange (CSE), London Stock Exchange Group, FIS, U.S. Bank, Broadridge Financial Systems, JPMorgan Chase, CI Financial, Canaccord Genuity Corp., Hilltop Securities, HD Vest, Stockhouse, Zacks Investment Research, General Electric, Boeing, Bombardier, Telus International, Business Wire, PR Newswire, FolioFN, Regal Securities, ChoiceTrade, Cetera Financial Group, Dynamic Trend, Inc., Qtrade Financial, CNW Group, IA Private Wealth, Ally Invest, Inc., Suncor, Virtual Brokers, Leede Jones Gable, Firstrade Securities, Charles Schwab, First Financial, Cirano, Equisolve, Stock-Trak, Mergent, Cision, Day Trade Dash and others. Quotestream®, QModTM and Quotestream ConnectTM are trademarks of QuoteMedia. For more information, please visit www.quotemedia.com.

Michael Kupinski, Director of Research, Noble Capital Markets, Inc.

Patrick McCann, Research Associate, Noble Capital Markets, Inc.

Refer to the full report for the price target, fundamental analysis, and rating.

Q1 meets expectations. The company reported Q1 revenue of $4.26 million, in line with our estimate of $4.29 million. Adj. EBITDA of $0.68 million was roughly in line with our estimate of $0.63 million. Management credited an increase in clients, as well as higher usage per client, as the catalysts for revenue growth in the quarter. Notably, the quarter reflected a significant improvement in gross margins, which were 47.5% and above our expectations of 46.5%. Management indicated that gross margins should approach 50% by year end.

A big win. During the quarter, the company signed a large Canadian bank. Revenue from the deal is not reflected in the quarter, but the revenue ramp from the new client will occur in 2022. 

This Company Sponsored Research is provided by Noble Capital Markets, Inc., a FINRA and S.E.C. registered broker-dealer (B/D).

*Analyst certification and important disclosures included in the full report. NOTE: investment decisions should not be based upon the content of this research summary. Proper due diligence is required before making any investment decision. 

Garibaldi Resources Corp (GGIFF) – Setting Up for a Productive 2022 Drilling Program

Monday, May 16, 2022

Garibaldi Resources Corp (GGIFF)
Setting Up for a Productive 2022 Drilling Program

Garibaldi Resources Corp. is an active Canadian-based junior exploration company focused on creating shareholder value through discoveries and strategic development of its assets in some of the most prolific mining regions in British Columbia and Mexico.

Mark Reichman, Senior Research Analyst, Natural Resources, Noble Capital Markets, Inc.

Refer to the full report for the price target, fundamental analysis, and rating.

Outstanding Casper drill results. Garibaldi Resources released results from exploratory drill holes testing multiple mineralized veins and volcanic rocks at the Casper Quartz Vein System. Five diamond drill holes followed the first four holes for which results were released in February 2021. Eight of the nine holes have intersected significant gold mineralization, with increasing gold grades toward the southeast.

Promising Nickel Mountain target. Building on the company’s 2021 Z-Axis Tipper Electromagnetic (ZTEM) survey that encompassed Garibaldi’s 180-square kilometer Nickel Mountain – Palm Springs Project claim groups, three-dimensional processing identified several new low-resistivity ZTEM responses 5 kilometers northeast of the E&L nickel-copper-cobalt massive sulphide zone, including a new anomaly at the B1 target which has not been drill tested. The B1 target exhibited a consistent ZTEM low resistivity zone coincident with a near surface VTEM conductive anomaly. The ZTEM low resistivity zone extends to depth like the low resistivity zone beneath E&L….

This Company Sponsored Research is provided by Noble Capital Markets, Inc., a FINRA and S.E.C. registered broker-dealer (B/D).

*Analyst certification and important disclosures included in the full report. NOTE: investment decisions should not be based upon the content of this research summary. Proper due diligence is required before making any investment decision. 

Release – Voyager Digital Reports Revenue of US$102.7 Million for the Quarter Ended March 31, 2022


Voyager Digital Reports Revenue of US$102.7 Million for the Quarter Ended March 31, 2022

Research, News, and Market Data on Voyager Digital

NEW YORK, May 16, 2022 /CNW/ – Voyager Digital Ltd. (“Voyager” or the “Company”) (TSX: VOYG) (OTCQX: VYGVF) (FRA: UCD2) one of the fastest-growing, publicly traded cryptocurrency platforms in the United States, today announced revenue and user metrics for the fiscal 2022 third quarter ended March 31, 2022.

“We performed strongly amidst the challenging macroeconomic and lower trading volumes seen across our industry,” said Steve Ehrlich, CEO and Co-founder of Voyager. “Despite market conditions, we continued to deliver customer account and net deposit growth, while continuing to build upon our revenue diversification strategy.”

“With the announcement of the private placement of approximately USD$60 million, the Company has over $225 million of net liquidity, comprised of over $175 million in cash, and approximately $50 million in crypto. With the recent changes to our rewards model and actively addressing our cost structure to ensure an efficient use of capital, we are working toward a goal of returning to positive operating income, after adding back stock-based compensation, in early calendar 2023.  Ehrlich continued, “Additionally, in the quarter we successfully launched our extremely popular moon mode and on-boarded customers to the beta programs for both our debit card and desktop app. The debit card is on target and expected to be deployed to the remainder of the waitlist throughout the quarter and the desktop app is set to be expanded to a wide group of customers.”

The Company announces the following for fiscal 2022 third quarter ended March 31, 2022 Financial and Operational Key Metrics:

  • Revenue for the quarter is $102.7 million, up 70% compared to $60.4 million for the quarter ended March 31, 2021.
  • Operating loss is $43.0 million for the quarter vs an income of $29.8 million for the quarter ended March 31, 2021. Operating loss/income includes stock-based compensation of $5.4 million for the quarter vs $5.3 million for the quarter ended March 31, 2021, respectively.
  • Total verified users on the platform stand at 3.5 million, up 9% from 3.2 million at the quarter ended December 31, 2021.
  • Total funded accounts reached 1,190,000 as of March 31, 2022, up 11% from 1,074,000 at the quarter ended December 31, 2021.
  • Total Assets on Platform decreased to $5.8 billion from $6.0 billion at December 31, 2021.
  • Our headcount increased to 318 as of March 31, 2022, from 250 at December 31, 2021.

All figures are
preliminary and unaudited and subject to final adjustment. All amounts are in
U.S. dollars, unless otherwise indicated.

The company is also pleased to announce Ashwin Prithipaul as Chief Financial Officer. He comes to Voyager with deep financial leadership experience, including as the former CFO of Galaxy Digital. In conjunction with this, Evan Psaropoulos is moving into a new role as Chief Commercial Officer to build out the Company’s revenue diversification as well as partner with the new CFO in creating cost efficiencies.

“In closing, we strongly believe we are in the early stages of global crypto adoption. Voyager remains very well capitalized to strategically grow our business and serve consumers amidst a rapidly evolving crypto landscape,” Ehrlich added.

Conference Call Details

Voyager will discuss its fiscal 2022 third quarter results today, May 16, 2022, via a conference call at 8:00 a.m. Eastern Time. To access the webcast, please register by 
clicking here. A live webcast and a replay will be available on the Investor Relations section of the Company’s website at  https://www.investvoyager.com/investorrelations/overview.  

Forward Looking Statements

Certain information in this press release, including, but not limited to, statements regarding future growth and performance of the business, momentum in the businesses, future adoption of digital assets, and the Company’s anticipated results may constitute forward looking information or forward-looking statements, (collectively referred to as “forward-looking statements”)which can be identified by the use of terms such as “may,” “will,” “should,” “expect,” “anticipate,” “project,” “estimate,” “intend,” “continue” or “believe” (or the negatives) or other similar variations under applicable securities laws. Forward-looking statements involve known and unknown risks, uncertainties and other factors that may cause Voyager’s actual results, performance or achievements to be materially different from any of its future results, performance or achievements expressed or implied by forward-looking statements. Moreover, we operate in a very competitive and rapidly changing environment. New risks emerge from time to time. It is not possible for our management to predict all risks, nor can we assess the impact of all factors on our business or the extent to which any factor, or combination of factors, may cause actual results to differ materially from those contained in any forward-looking statements we may make. In light of these risks, uncertainties, and assumptions, the future events and trends discussed in this press release may not occur and actual results could differ materially and adversely from those anticipated or implied in the forward-looking statements. Forward looking statements are subject to the risk that the global economy, industry, or the Company’s businesses and investments do not perform as anticipated, that revenue or expenses estimates may not be met or may be materially less or more than those anticipated, that trading momentum does not continue or the demand for trading solutions declines, customer acquisition does not increase as planned, product and international expansion do not occur as planned, risks of compliance with laws and regulations that currently apply or become applicable to the business or the interpretation or application of laws and regulations by regulatory authorities, and those other risks contained in the Company’s public filings, including in its Management Discussion and Analysis and its Annual Information Form (AIF). Factors that could cause actual results of the Company and its businesses to differ materially from those described in such forward-looking statements include, but are not limited to, a decline in the digital asset market or general economic conditions; changes in laws or approaches to regulation, regulatory investigations, enforcement actions or other regulatory action or sanction, the failure or delay in the adoption of digital assets and the blockchain ecosystem by institutions; changes in the volatility of crypto currency, changes in demand for Bitcoin and Ethereum, changes in the status or classification of cryptocurrency assets, cybersecurity breaches, a delay or failure in developing infrastructure for the trading businesses or achieving mandates and gaining traction; failure to grow assets on platform, an adverse development with respect to an issuer or party to the transaction or failure to obtain a required regulatory approval. In connection with the forward-looking statements contained in this press release, the Company has made assumptions that no significant events occur outside of the Company’s normal course of business and that current trends in respect of digital assets continue. Readers are cautioned that the key metrics disclosed in this press release, including, without limitation, Assets on Platform and trading volumes fluctuate and may increase and decrease from time to time and that such fluctuations are beyond the Company’s control. Forward-looking statements, past and present performance and trends are not guarantees of future performance, accordingly, you should not put undue reliance on forward-looking statements, current or past performance, or current or past trends. Information identifying assumptions, risks, and uncertainties relating to the Company are contained in its filings with the Canadian securities regulators available at www.sedar.com. The forward-looking statements in this press release are applicable only as of the date of this release or as of the date specified in the relevant forward-looking statement and the Company undertakes no obligation to update any forward-looking statement to reflect events or circumstances after that date or to reflect the occurrence of unanticipated events. The Company assumes no obligation to provide operational updates, except as required by law. If the Company does update one or more forward-looking statements, no inference should be drawn that it will make additional updates with respect to those or other forward-looking statements, unless required by law. Readers are cautioned that past performance is not indicative of future performance and current trends in the business and demand for digital assets may not continue and readers should not put undue reliance on past performance and current trends.  Refer to definition of certain Non-IFRS terms in Management’s Discussion and Analysis including Assets On Platform, Adjusted EBITDA and Adjusted Working Capital.  All figures are in U.S. dollars unless otherwise noted.

About Voyager Digital Ltd.

Voyager Digital Ltd.’s (TSX: 
VOYG) (OTCQX: VYGVF) (FRA: UCD2) US subsidiary, Voyager Digital, LLC, is a fast-growing cryptocurrency platform in the United States founded in 2018 to bring choice, transparency, and cost-efficiency to the marketplace. Voyager offers a secure way to trade over 100 different crypto assets using its easy-to-use mobile application. Through its subsidiary Coinify ApS, Voyager provides crypto payment solutions for both consumers and merchants around the globe. To learn more about the company, please visit https://www.investvoyager.com.

The TSX has not approved
or disapproved of the information contained herein.

Press Contacts

Voyager Digital, Ltd.
Kevin Rodriguez

Investor Relations
(212) 547-8807
krodriguez@investvoyager.com

Voyager Public Relations Team
pr@investvoyager.com

Voyager Digital Ltd.
Interim Condensed Consolidated Statements of Financial Position (Unaudited)
(USD, in thousands)

March 31, 2022

June 30, 2021

Assets

Current assets

Cash and cash equivalents

$            99,406

$            193,933

Cash held for customers

112,413

162,852

Crypto assets held ($895.7 million and $0.0 million restricted, respectively)

3,433,142

2,286,399

Crypto assets loaned

2,022,444

393,561

Crypto assets collateral received

227,339

Investments

31,359

Other current assets

16,111

5,839

Total current assets

5,910,855

3,073,943

Goodwill and intangible assets

79,334

559

Other non-current assets

8,695

2,860

Total assets

$          5,998,884

$          3,077,362

Liabilities

Current liabilities

Crypto assets and fiat payable to customers

$          5,482,009

$          2,807,015

Crypto assets collateral payable

227,339

Crypto assets borrowed

36,832

Warrant liability

6,102

23,810

Other current liabilities

16,155

22,644

Total current liabilities

5,731,605

2,890,301

Other non-current liabilities

9,496

739

Total liabilities

5,741,101

2,891,040

Equity

Share capital

408,353

261,908

Share-based payments reserve

30,570

15,125

Warrant reserve

1,144

3,457

Other comprehensive loss

(347)

Accumulated deficit

(181,937)

(94,168)

Total equity

257,783

186,322

Total liabilities and equity

$          5,998,884

$          3,077,362

Voyager Digital Ltd.
Interim Condensed Consolidated Statements of Comprehensive Income/ (Loss)
(Unaudited)
(USD, in thousands except for shares data)

Three Months Ended March 31,

Nine Months Ended March 31,

2022

2021

2022

2021

Revenues

Transaction revenue

$         33,386

$          53,736

$       163,402

$          57,418

Fees from crypto assets loaned

31,025

6,702

80,892

8,590

Merchant services

18,347

48,148

Staking revenue

14,359

42,788

Other revenue

5,626

13,868

Total revenues

102,743

60,438

349,098

66,008

Operating expenses

Rewards paid to customers

59,321

7,409

182,014

8,949

Marketing and sales

30,367

8,935

82,082

10,288

Cost of merchant services

17,979

47,184

Share-based payments

5,386

5,271

14,506

6,650

Compensation and employee benefits

12,365

2,476

26,984

4,558

Total compensation and employee benefits

17,751

7,747

41,490

11,208

Trade expenses

2,984

726

14,145

1,069

Customer onboarding and service

3,525

2,677

9,179

2,677

Professional and consulting

6,033

1,141

20,371

2,233

General and administrative

7,743

1,957

20,703

5,327

Total operating expenses

145,703

30,592

417,168

41,751

Income/ (loss) before other income/ (loss)

(42,960)

29,846

(68,070)

24,257

Other income/ (loss)

Change in fair value of crypto assets held

(17,516)

12,953

(24,560)

18,440

Change in fair value of investments

18,977

6,114

29,570

Change in fair value of crypto assets borrowed

(30,030)

(13,584)

(36,282)

Change in fair value of warrant liability

9,981

(98,990)

16,825

(116,092)

Fees on crypto assets borrowed

(1,319)

(2,532)

(1,428)

Total other income/ (loss)

(7,535)

(98,409)

(17,737)

(105,792)

Net income/ (loss) before provision/ (benefit) for
income tax

(50,495)

(68,563)

(85,807)

(81,535)

Provision (benefit) for income tax

10,945

1,962

Net income/ (loss)

(61,440)

(68,563)

(87,769)

(81,535)

Other comprehensive income/ (loss)

Foreign currency translation adjustment

(148)

(14)

(347)

(14)

Total comprehensive income/ (loss)

$          (61,588)

$        (68,577)

$       (88,116)

$       (81,549)

Earnings per share

Basic

$           (0.36)

$          (0.49)

$          (0.53)

$          (0.66)

Diluted

$           (0.36)

$          (0.49)

$          (0.53)

$          (0.66)

SOURCE Voyager Digital (Canada) Ltd.

Release – Labrador Gold Announces Early Exercise of Option to Earn 100% of the Kingsway Project


Labrador Gold Announces Early Exercise of Option to Earn 100% of the Kingsway Project

News and Market Data on Labrador Gold Corp

TORONTO, ON, May 16, 2021 – Labrador Gold Corp. (TSX.V : LAB | OTCQX:NKOSF | FNR: 2N6) (“LabGold” or the “Company”) is pleased to announce that it has exercised its option two years early to earn 100% of the three licenses comprising the Kingsway project near Gander, Newfoundland. The Kingsway project is located in the highly prospective central Newfoundland gold belt.

The Kingsway Property is composed of three licenses 027636M and 027637M which were optioned in March 2020 and 023940M optioned in July 2020. Together these three licenses cover approximately 12km of the Appleton Fault Zone along which prospecting and drilling over the past two years by LabGold and New Found Gold has resulted in the discovery of numerous near-surface high grade gold occurrences. Given the prolific nature of this fault zone and the continued success of the Company’s exploration on the property, the Board agreed to accelerate the option payments to acquire the 100% interest.

“It is clear to us that the Kingsway Property will need sustained exploration over the long term to fully understand its potential. The success we have had in just a year and half spent working in the field speaks to the prospectivity of the Appleton Fault Zone and the remainder of the property in general,” said Roger Moss, President and CEO of Labrador Gold. “Acquiring the 100% interest in the property two years earlier than required shows the confidence we have that there is more to come from Kingsway, and we are excited to continue exploring the entire 12km strike length of the Appleton Fault Zone.”

The Company now owns a 100% undivided interest in license 023940M. 
The Company also owns a 100% undivided interest in licenses 027636M and 027637M subject to: 
A 1.0% Net Smelter Returns royalty plus $1 per ounce of gold in the measured and indicated mineral resource categories established in a National Instrument 43-101 technical report for the development of the Property.
Expenditure target payments of $750,000 for each $10 million in exploration expenditures up to $30 million.

Upcoming Webinar

Labrador Gold is also pleased to announce that President and CEO, Roger Moss, will be providing the latest update from the Kingsway project in a live webinar taking place on Monday, May 16th at 1:00PM PT/ 4:00PM ET. To register for the event please click the link below. 

Registration:  https://event.webinarjam.com/channel/LabGold

Qualified Person
Roger Moss, PhD., P.Geo., President and CEO of LabGold, a Qualified Person in accordance with Canadian regulatory requirements as set out in NI 43-101, has read and approved the scientific and technical information that forms the basis for the disclosure contained in this release.

The Company gratefully acknowledges the Newfoundland and Labrador Ministry of Natural Resources’ Junior Exploration Assistance (JEA) Program for its financial support for exploration of the Kingsway property.

About Labrador Gold

Labrador Gold is a Canadian based mineral exploration company focused on the acquisition and exploration of prospective gold projects in Eastern Canada.

Labrador Gold owns a 100% undivided interest in the Kingsway project in the Gander area of Newfoundland. The three licenses comprising the Kingsway project cover approximately 12km of the Appleton Fault Zone which is associated with gold occurrences in the region, including those of New Found Gold immediately to the south of Kingsway. Infrastructure in the area is excellent located just 18km from the town of Gander with road access to the project, nearby electricity and abundant local water. LabGold is drilling a projected 100,000 metres targeting high-grade epizonal gold mineralization along the Appleton Fault Zone following encouraging results including the discovery of near surface gold mineralization at three of three targets drilled to date. The Company has approximately $25 million in working capital and is well funded to carry out the planned program.  

The Hopedale property covers much of the Florence Lake greenstone belts that stretches over 60 km. The belt is typical of greenstone belts around the world but has been underexplored by comparison. Work to date by Labrador Gold show gold anomalies in rocks, soils and lake sediments over a 3 kilometre section of the northern portion of the Florence Lake greenstone belt in the vicinity of the known Thurber Dog gold showing where grab samples assayed up to 7.8g/t gold. In addition, anomalous gold in soil and lake sediment samples occur over approximately 40 km along the southern section of the greenstone belt (see news release dated January 25th 2018 for more details). Labrador Gold now controls approximately 40km strike length of the Florence Lake Greenstone Belt.

The Company has 156,740,526 common shares issued and outstanding and trades on the TSX Venture Exchange under the symbol LAB. 

For more information please contact:             

Roger Moss, President and CEO      Tel: 416-704-8291
Or visit our website at: www.labradorgold.com
@LabGoldCorp

Neither TSX Venture Exchange nor its Regulation Services Provider (as that term is defined in policies of the TSX Venture Exchange) accepts responsibility for the adequacy or accuracy of this release.

Forward-Looking Statements: This news release contains forward-looking statements that involve risks and uncertainties, which may cause actual results to differ materially from the statements made. When used in this document, the words “may”, “would”, “could”, “will”, “intend”, “plan”, “anticipate”, “believe”, “estimate”, “expect” and similar expressions are intended to identify forward-looking statements. Such statements reflect our current views with respect to future events and are subject to risks and uncertainties. Many factors could cause our actual results to differ materially from the statements made, including those factors discussed in filings made by us with the Canadian securities regulatory authorities. Should one or more of these risks and uncertainties, such as actual results of current exploration programs, the general risks associated with the mining industry, the price of gold and other metals, currency and interest rate fluctuations, increased competition and general economic and market factors, occur or should assumptions underlying the forward looking statements prove incorrect, actual results may vary materially from those described herein as intended, planned, anticipated, or expected. We do not intend and do not assume any obligation to update these forward-looking statements, except as required by law. Shareholders are cautioned not to put undue reliance on such forward-looking statements.


Release – EuroDry Ltd. Sets Date for the Release of First Quarter 2022 Results, Conference Call and Webcast


EuroDry Ltd. Sets Date for the Release of First Quarter 2022 Results, Conference Call and Webcast

News and Market Data on EuroDry Ltd.

Athens,
Greece – May 16, 2022
– EuroDry Ltd. (NASDAQ: EDRY, the “Company” or “EuroDry”), an owner and operator of drybulk vessels and provider of seaborne transportation for drybulk cargoes, announced today that it will release its financial results for the first quarter ended March 31, 2022 on Wednesday, May 18, 2022 before market opens in New York. 

On the same day, May 18, 2022 at 10:30 a.m. Eastern Time, the Company’s management will host a conference call and webcast to discuss the results. 

Conference
Call details: 

Participants should dial into the call 10 minutes before the scheduled time using the following numbers: 1 (877) 553-9962 (US Toll Free Dial In), 0(808) 238-0669(UK Toll Free Dial In) or +44(0) 2071 928592 (Standard International Dial In). Please quote “EuroDry” to the operator. 

Audio
Webcast- Slides Presentation

There will be a live and then archived webcast of the conference call and accompanying slides, available through the Company’s website. To listen to the archived audio file, visit our website http://www.eurodry.gr and click on Company Presentations under our Investor Relations page. Participants to the live webcast should register on the website approximately 10 minutes prior to the start of the webcast. 

The slide presentation on the first quarter ended March 31, 2022 will also be available in PDF format 10 minutes prior to the conference call and webcast, accessible on the company’s website (www.eurodry.gr) on the webcast page. Participants to the webcast can download the PDF presentation. 

About
EuroDry Ltd

EuroDry Ltd. was formed on January 8, 2018 under the laws of the Republic of the Marshall Islands to consolidate the drybulk fleet of Euroseas Ltd. into a separate listed public company. EuroDry was spun-off from Euroseas Ltd. on May 30, 2018; it trades on the NASDAQ Capital Market under the ticker EDRY. 

EuroDry operates in the dry cargo, drybulk shipping market. EuroDry’s operations are managed by Eurobulk Ltd., an ISO 9001:2008 and ISO 14001:2004 certified affiliated ship management company and Eurobulk (Far East) Ltd. Inc., which are responsible for the day- to-day commercial and technical management and operations of the vessels. EuroDry employs its vessels on spot and period charters and under pool agreements. 
The Company has a fleet of 11 vessels, including 6 Panamax drybulk carriers, 1 Supramax drybulk carrier, 2 Ultramax drybulk carriers and 2 Kamsarmax drybulk carriers. Eurodry’s 11 drybulk carriers have a total cargo capacity of 802,995 dwt.  

Visit our website www.eurodry.gr 

Company
Contact 

Investor
Relations / Financial Media 

Tasos Aslidis 

Chief Financial Officer 

EuroDry Ltd. 
11 Canterbury Lane, 
Watchung, NJ07069 
Tel. (908) 301-9091 

E-mail: aha@eurodry.gr 

Nicolas Bornozis 

Markella Kara  
Capital Link, Inc. 

230 Park Avenue, Suite 1540 
New York, NY10169 
Tel. (212) 661-7566 

E-mail: eurodry@capitallink.com   

FDA Program May Help Investors Uncover Breakthrough Medical Technology


Image Credit: US Food and Drug Administration (Flickr)


FDA Breakthrough Devices Program Could Aid Investors to Find Opportunities

The FDA Breakthrough Devices Program may be a starting point for investors exploring the medical space. It’s designed to create a quicker path for medical devices that provide more effective treatment or diagnosis of life-threatening or irreversible conditions. There are significant benefits for the companies granted access to the program. Lists of devices after the companies have been granted a marketing authorization are available on the FDA
website
.

While new pharmaceuticals tend to grab headlines quicker than devices, investors looking for public companies, that may be uncorrelated to the pace of US economic growth or the financial markets, may visit the website and then research the companies on Channelchek.

Benefits of the Breakthrough Devices Program

The purpose of the Breakthrough Devices Program is to provide patients and health care providers with timely access to novel medical devices by speeding up their development, assessment, and review. At the same time, it preserves the statutory standards for premarket approval, 510(k) clearance, and De Novo marketing authorization, consistent with the Agency’s mission to protect and promote public health.

Manufacturers have the opportunity to interact with the FDA’s experts through several different program options to efficiently address issues that present themselves during the FDA premarket review phase. This feedback from the FDA helps shorten the agreement phase. The company can also expect a prioritized review of its submission. This can have the effect of speeding the product to market with less cost and fewer problems.


How this Works

Pulling an example from the Channelchek library of
videos
from NobleCon18, we can use Perimeter
Medical Imaging AI
(PYNKF) to understand what a candidate looks like and how it may bring value to the patient, medical provider, and possibly investors.

Perimeter is an early-stage medical device company that expects its flagship product to address unmet cancer treatment needs. Initially, the device is expected to change the way breast cancer is treated and evaluated to improve outcomes and minimize the chance of recurrence or having to reoperate. In order to apply for the FDA designation, Perimeter’s device was indicated for breast cancer. However, the applications are expected to extend well beyond and into other major cancers in the $3.7 billion total market.

This FDA designation makes for a much more clear regulatory pathway. Perimeter meets the first guideline in that its product has unique technology (breakthrough) that is solving problems with a different method on a scalable platform. The procedures are expected to reduce the cost to patients, minimize the need for repeat surgery and be self-funding from the hospitals’ standpoint. This is because about 20 to 25% of cancer patients now need to return for a re-operation that costs approximately $16,000. Hospitals that adopt the Perimeter AI technology could serve patients better and stand to recover their costs while reducing overall patient costs on average.

Take-Away

There are many ways to uncover companies that are “on the move.” Reviewing those the FDA is likely to help along toward a full “go-ahead” is just one of them. For a more detailed look at Perimeter, their unique business model,  and technology, watch the 20-minute video below. For more on understanding the FDA Breakthrough Device Program in order to uncover companies that could change medicine, go to FDA.gov .

To evaluate small and growing companies, explore Channelchek beginning here.

Paul Hoffman

Managing Editor, Channelchek

Suggested Content


Understanding the FDA Medical Device Approval Pathways Helps Investors


The FDA’s CBD and CDP Data Acceleration Program


Perimeter Medical Imaging AI (PYNKF) NobleCon18 Presentation Replay


BioSig Technologies (BSGM) NobleCon18 Presentation Replay

Sources

https://pink.pharmaintelligence.informa.com/PS144170/Half-Of-US-FDAs-Breakthrough-Therapy-Designations-Have-Resulted-In-Approval

https://www.fda.gov/regulatory-information/search-fda-guidance-documents/breakthrough-devices-program

Stay up to date. Follow us: