Genco Shipping (GNK) NobleCon18 Presentation Replay Posted on May 2, 2022 by Admin Genco Shipping (GNK) Corporate Presentation from NobleCon18 Research, News and Market Data on Genco Shipping NobleCon 18 Complete Rebroadcast
Genprex (GNPX) NobleCon18 Presentation Replay Posted on May 2, 2022 by Admin Genprex (GNPX) Corporate Presentation from NobleCon18 Research, News and Market Data on Genprex NobleCon 18 Complete Rebroadcast
Global Crossing Airlines (JETMF) NobleCon18 Presentation Replay Posted on May 2, 2022 by Admin Global Crossing Airlines (JETMF) Corporate Presentation from NobleCon18 News and Market Data on Global Crossing Airlines NobleCon 18 Complete Rebroadcast
Harte Hanks (HHS) NobleCon18 Presentation Replay Posted on May 2, 2022 by Admin Harte Hanks (HHS) Corporate Presentation from NobleCon18 Research, News and Market Data on Harte Hanks NobleCon 18 Complete Rebroadcast
Healthcare Triangle (HCTI) NobleCon18 Presentation Replay Posted on May 2, 2022 by Admin Healthcare Triangle (HCTI) Corporate Presentation from NobleCon18 News and Market Data on Healthcare Triangle NobleCon 18 Complete Rebroadcast HCTI
HMNC Brain Health NobleCon18 Presentation Replay Posted on May 2, 2022 by Admin HMNC Brain Health Corporate Presentation from NobleCon18 NobleCon 18 Complete Rebroadcast
Information Services (III) NobleCon18 Presentation Replay Posted on May 2, 2022 by Admin Information Services (III) Corporate Presentation from NobleCon18 Research, News and Market Data on Information Services NobleCon 18 Complete Rebroadcast
InPlay Oil (IPOOF) NobleCon18 Presentation Replay Posted on May 2, 2022 by Admin InPlay Oil (IPOOF) Corporate Presentation from NobleCon18 Research, News and Market Data on InPlay Oil NobleCon 18 Complete Rebroadcast
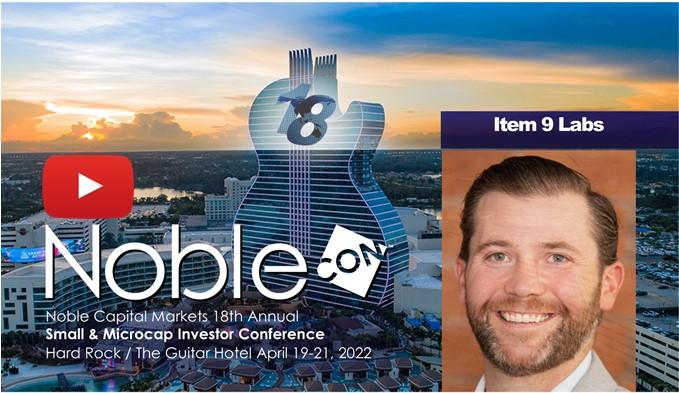
Item 9 Labs (INLB) NobleCon18 Presentation Replay Posted on May 2, 2022 by Admin Item 9 Labs (INLB) Corporate Presentation from NobleCon18 Research, News and Market Data on Item 9 Labs NobleCon 18 Complete Rebroadcast
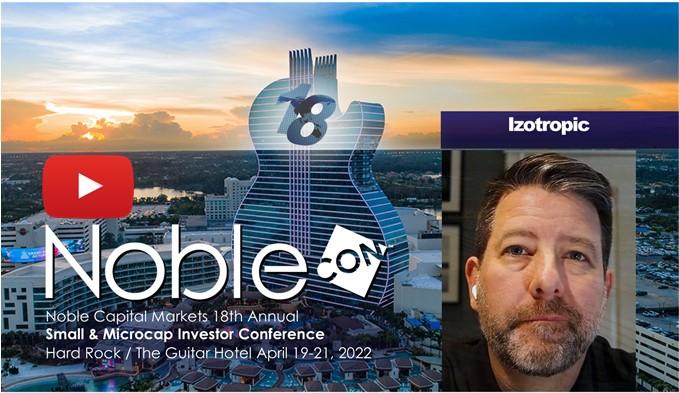
Izotropic Corporation (IZOZF) NobleCon18 Presentation Replay Posted on May 2, 2022 by Admin Izotropic Corporation (IZOZF) Corporate Presentation from NobleCon18 News and Market Data on Izotropic Corporation NobleCon 18 Complete Rebroadcast
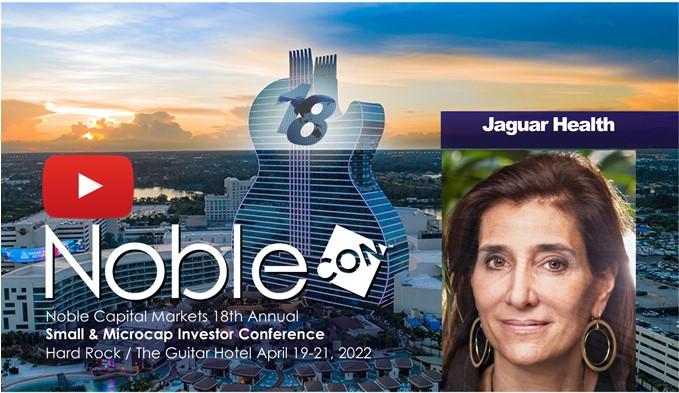
Jaguar Health (JAGX) NobleCon18 Presentation Replay Posted on May 2, 2022 by Admin Jaguar Health (JAGX) Corporate Presentation from NobleCon18 News and Market Data on Jaguar Health NobleCon 18 Complete Rebroadcast
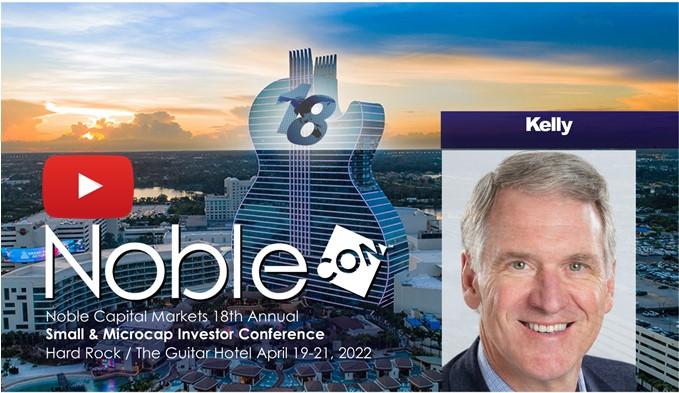
Kelly Services (KELYA) NobleCon18 Presentation Replay Posted on May 2, 2022 by Admin Kelly Services (KELYA) Corporate Presentation from NobleCon18 Research, News and Market Data on Kelly Services NobleCon 18 Complete Rebroadcast
Lee Enterprises (LEE) NobleCon18 Presentation Replay Posted on May 2, 2022 by Admin Lee Enterprises (LEE) Corporate Presentation from NobleCon18 Research, News and Market Data on Lee Enterprises NobleCon 18 Complete Rebroadcast