What Sectors Do Best With a Strong Dollar?


Image Credit: Pratkxox (Flickr)


Using Current Dollar Strength to Refine Your Watch List


The U.S. dollar is up 8.1% vs. its trading partners (DXY) thus far in 2022 (April 28). Over the past 20 years, when the U.S. dollar rose, U.S. stock indexes have shown a positive correlation. To date, this has not happened in 2022. As measured by the S&P 500, stocks are down about 12% this year. A reversion to a more statistical correlation could bring stocks up, the dollar down, or possibly both.

Of course, within the universe of stocks, there will be some investments that are much more positively correlated to the dollar and those that have demonstrated themselves to have a negative correlation. When the currency has a strong and clear direction, it may make sense to look into stocks in the sectors that have a higher probability of taking their cue from the dollar.


Dollar Value Moves Some Stock Prices

Any country’s currency can gain in value relative to other currencies. This happens when there is increased global demand for the currency, or when there is a reduction in the supply of currency available. 

There is a high propensity that an increase in the dollar’s value will coincide with a rise in U.S. market indices since U.S. stocks are denominated in dollars.  At a minimum, they should outperform foreign markets.


Source: Koyfin

As mentioned above, a way to magnify any effect is to understand the sectors that benefit from a weak or strong native currency and then research stocks within that industry for selection. Often the smaller more concentrated companies provide an even greater effect.

Manufacturing businesses that rely heavily on raw materials, or commodities and get these products from overseas (steal, semi-precious metals, minerals, etc.) will benefit from paying in or exchanging from the stronger currency. This has the impact of reducing relative costs and helping the bottom line. Stocks do better with a growing bottom line.

Importers also do well in a strong and rising dollar scenario. The reason is if the cost of goods is paid for in stronger dollars they are lower in price because they are manufactured and sold based on a depreciated currency.


Take-Away

The values of American stocks tend to increase along with the demand for U.S. dollars; they have a positive correlation.

One explanation for this relationship is foreign investment. As more investors place their money in U.S. equities, they are required to first buy U.S. dollars to purchase American stocks, causing the indexes to increase in value. So the stocks are actually causing the increased demand for the dollars. The inverse could be true as well. Continued dollar strength may cause more people to convert to dollars and they then keep the currency invested in U.S. markets, thus driving up equity prices.


Suggested Reading


Money Supply is Like Caffeine for Stocks


Financial Protection Bureau Has New Supervisory Powers


Why Good Economic Numbers Can Cause a Selloff


How PPI Impacts CPI Numbers


Sources

www.koyfin.com


Stay up to date. Follow us:


Rates Rubles and Gold


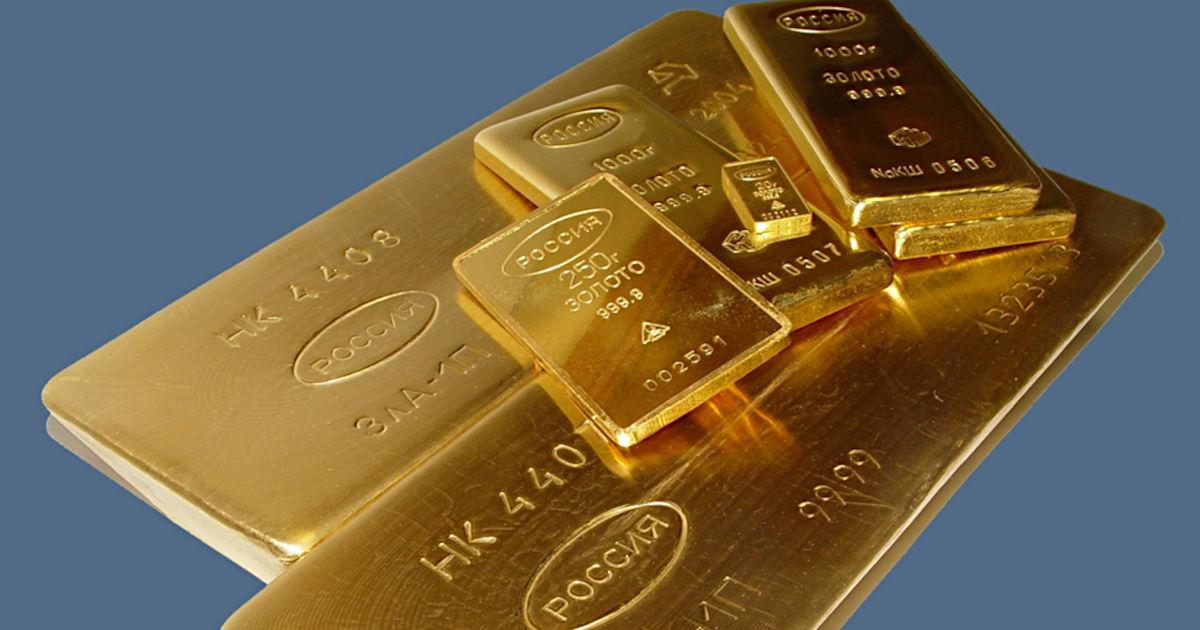
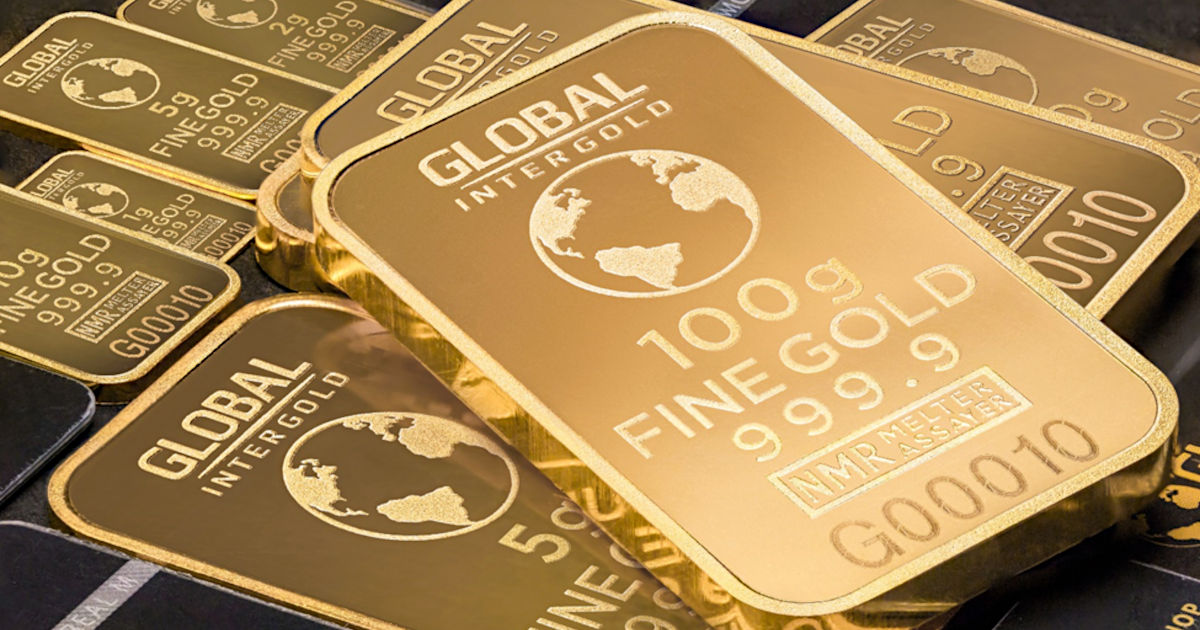
With the Russia-Ukraine War, Gold’s Safe-Haven Status Lasts


While several asset classes have suffered immense stress in recent weeks, precious metals (PMs) have remained relatively elevated. Moreover, concerns have arisen that since the Russian central bank pegged the ruble to gold, it helps uplift the yellow metal.

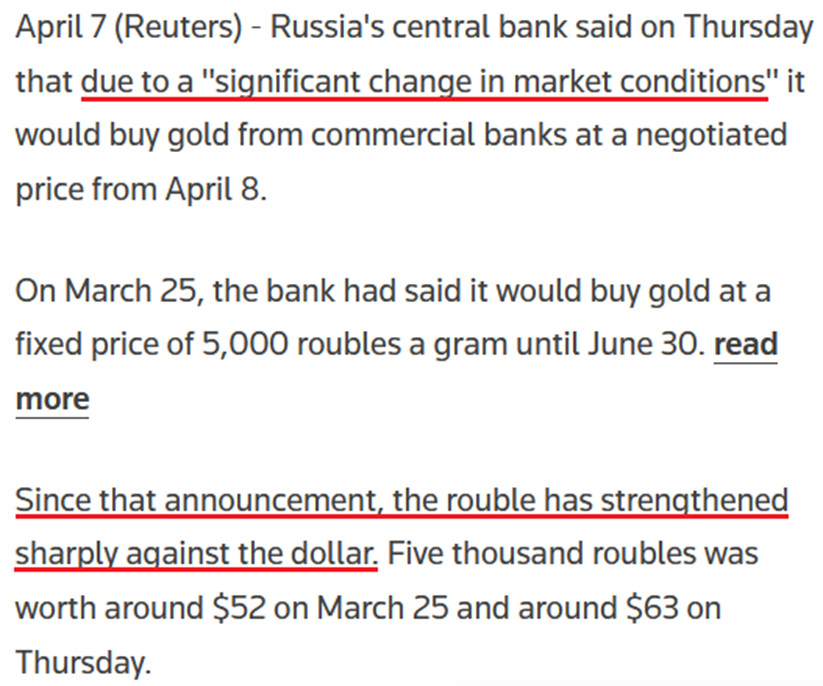
For context, the Russian central bank announced on Mar. 25 that it would pay 5,000 rubles ($52) per gram of gold. This allowed the USD/RUB to garner an exchange rate of ~96.15 (5,000/52). However, the important point is that the policy was aimed at supporting the ruble, not the PMs.

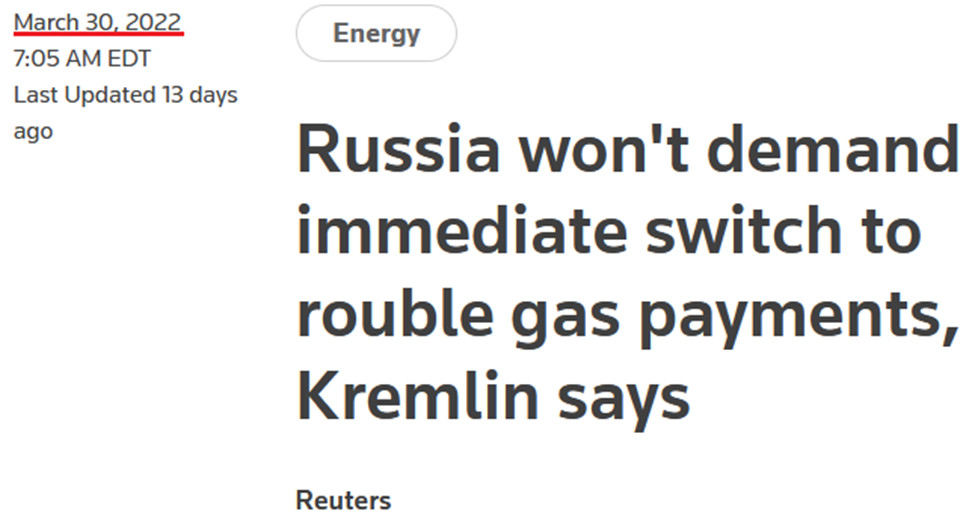
To explain, when Russia invaded Ukraine, NATO responded with seismic sanctions. As a result, the USD/RUB rallied to an all-time high of 121.21. However, the threats worked perfectly for Russia, as the USD/RUB is now at ~79.68 and lower than the 85.28 recorded pre-invasion. Furthermore, Russian President Vladimir Putin attempted the same feat when he said that all Russian gas exports would need to be paid for in rubles.

A Reuters article stated:

“Putin’s order to charge ‘unfriendly’ countries in rubles for Russian gas boosted the Russian currency after it plunged to all-time lows when the West imposed sweeping sanctions on Moscow for its invasion of Ukraine. European gas prices also rocketed up.”

However, with the ruble strengthening materially in recent weeks, the policy is no longer needed.

Please see below:


Likewise, it’s the same story for the PMs. After announcing the fixed peg on Mar. 25, the Kremlin scrapped that policy on Apr. 7, since the ruble is strong enough and doesn’t need any indirect support.

Please see below:


Furthermore, the Russian central bank cited a “significant change in market conditions” for reversing the policy. In a nutshell: since the ruble is stronger than it was before the invasion, the currency impact of sanctions is immaterial. Therefore, the central bank is happy to let the ruble float.

Please see below:


All in all, the moves made by the Russian central bank were designed to support the ruble. When a currency plunges, the FX-adjusted cost of imports skyrockets. As such, sanctions would cripple growth, inflation would rage, and the Russian economy would suffer stagflation on steroids. However, by stabilizing the currency, Russia solves half of the problem. Thus, while the recent developments may seem like they uplifted the PMs, they’re largely immaterial from a medium-term perspective.

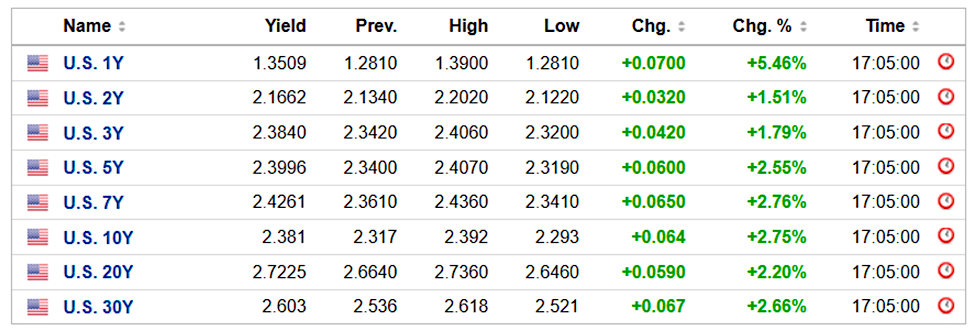
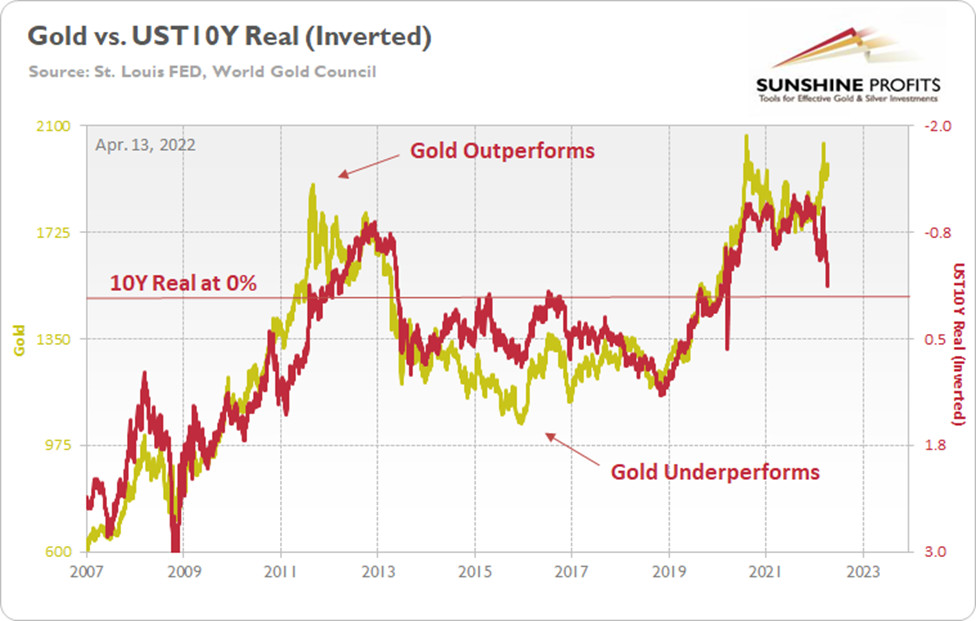
More importantly, the PMs’ domestic fundamental outlooks continue to deteriorate. For example, the U.S. 10-Year real yield hit a new 2022 high of -0.12% on Apr. 11 and closed at -0.13% on Apr. 12. Moreover, while momentum keeps the yellow metal uplifted, history shows that the current gold price is unsustainable.


Still a Momentum Trade

To explain, the gold line above tracks the price tallied by the World Gold Council, while the red line above tracks the inverted U.S. 10-Year real yield. For context, inverted means that the latter’s scale is flipped upside down and that a rising red line represents a falling U.S. 10-Year real yield, while a falling red line represents a rising U.S. 10-Year real yield.

Moreover, I wrote on Apr. 11 that gold and the U.S. 10-Year real yield have a daily correlation of -0.92 since 2007. Therefore, we must ignore 15+ years of historical data to assume that gold’s best days lie ahead.

To that point, the famous quote from John Maynard Keynes is relevant here. He said that “markets can stay irrational longer than you can stay solvent.” In a nutshell: the price action can make investors second-guess themselves, even when the data supports the opposite conclusion. Furthermore, if you analyze the arrows above, you can see that investors’ optimism helped gold outperform the U.S. 10-Year real yield in 2011, while investors’ pessimism helped gold underperform the U.S. 10-Year real yield in 2015.

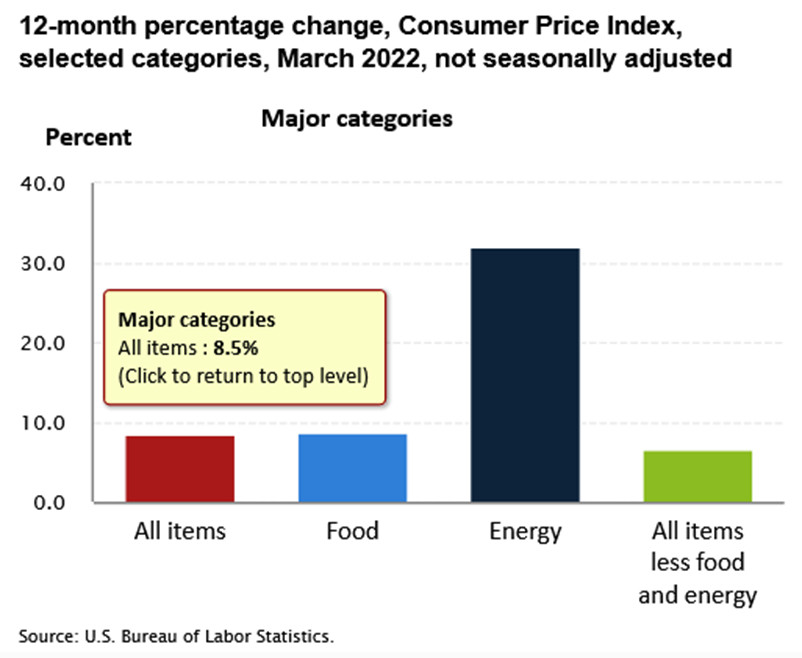
As a result, sentiment rules the day in the short term, and the algorithms move in whichever direction the wind is blowing. Therefore, we find ourselves in that situation now. With the Russia-Ukraine conflict increasing gold’s geopolitical appeal, safe-haven momentum remains ripe. In addition, another 2022 high in the headline Consumer Price Index (CPI) also increases gold’s inflation-hedge appeal. For context, the metric increased by 8.5% year-over-year (YoY) on Apr. 12.


However, investors are short-sighted about the medium-term implications. While conventional wisdom implies that abnormally high inflation is bullish for the PMs, the reality is that pricing pressures awaken the Fed. Since positive real yields are essential to curb inflation, the Fed has to tighten financial conditions to achieve its goal.

To explain, I wrote on Apr. 5:

I warned throughout 2021 that a hawkish Fed and tighter financial conditions are bearish for the PMs. And while the fundamental expectation worked perfectly before the Russia-Ukraine crises erupted, the medium-term thesis is clearer now than it was then.

Please see below:


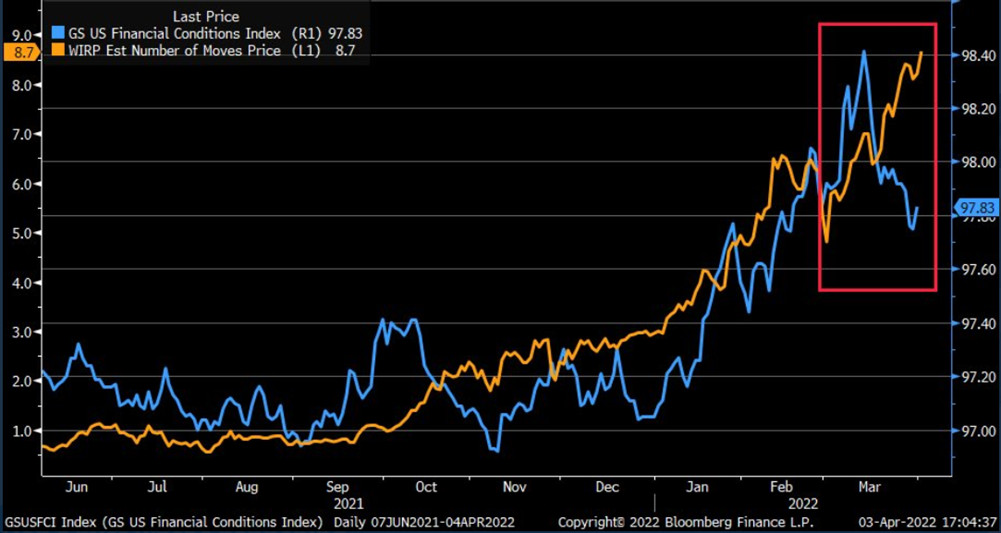
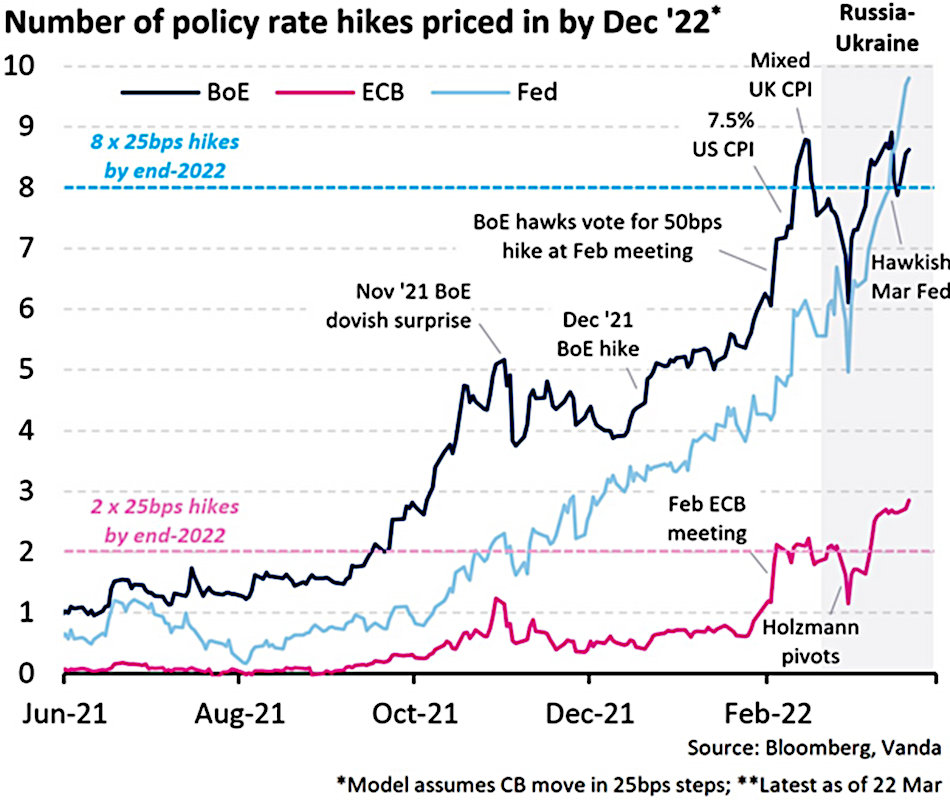
To explain, the orange line above tracks the number of rate hikes priced in by the futures market, while the blue line above tracks Goldman Sachs’ Financial Conditions Index (FCI). If you analyze the movement of the former, futures traders expect roughly nine rate hikes by the Fed in 2022.

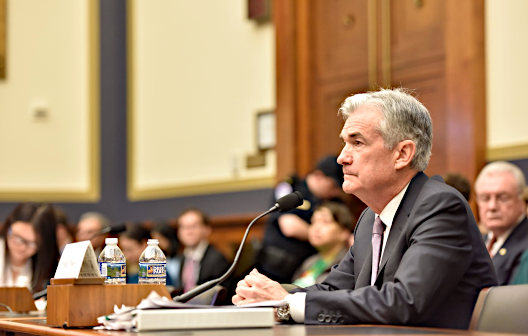
However, if you focus your attention on the right side of the chart, you can see that the FCI has declined materially from its highs. Therefore, financial conditions are easier now than they were before the March FOMC meeting. However, the Fed needs to tighten financial conditions to calm inflation. But since market participants are not listening, Chairman Jerome Powell needs to amplify his hawkish rhetoric until the message hits home.


Think about it: if looser financial conditions are used to stimulate economic growth and inflation, how can the Fed calm the pressures without reversing the situation? Moreover, please remember that the current policy stance contributed to 8%+ annualized inflation. Thus, it’s unrealistic to materially reduce inflation from 8% to 2% without the Fed materially shifting the liquidity dynamics. Therefore, investors’ optimism will likely reverse sharply over the medium term.

To that point, while the implications of a higher FCI and higher real yields take time to play out, the Fed has upped the hawkish ante in recent days. In the process, both the bond and the stock market have changed their tones. Therefore, commodities like the PMs will likely be the last shoe to drop.

For additional context, I wrote on Feb. 2:


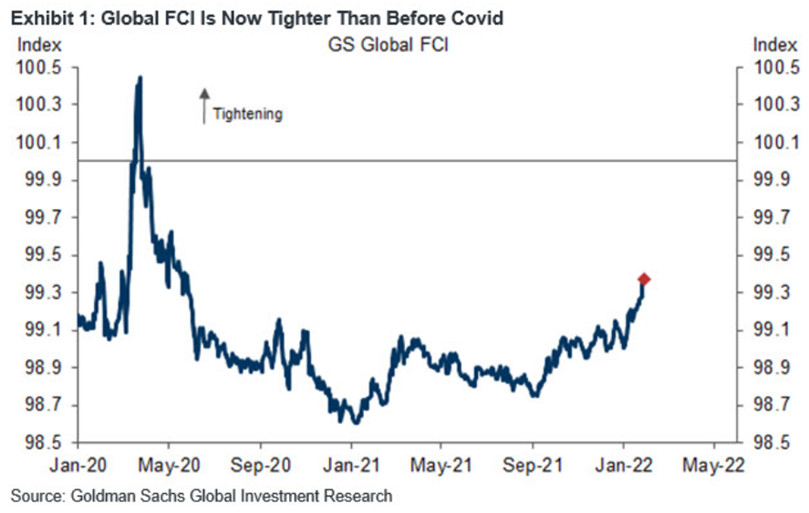
If you analyze the right side of the chart, you can see that the FCI has surpassed its pre-COVID-19 high (January 2020). Moreover, the FCI bottomed in January 2021 and has been seeking higher ground ever since. In the process, it’s no coincidence that the PMs have suffered mightily since January 2021. Furthermore, with the Fed poised to raise interest rates at its March monetary policy meeting, the FCI should continue its ascent. As a result, the PMs’ relief rallies should fall flat like in 2021.

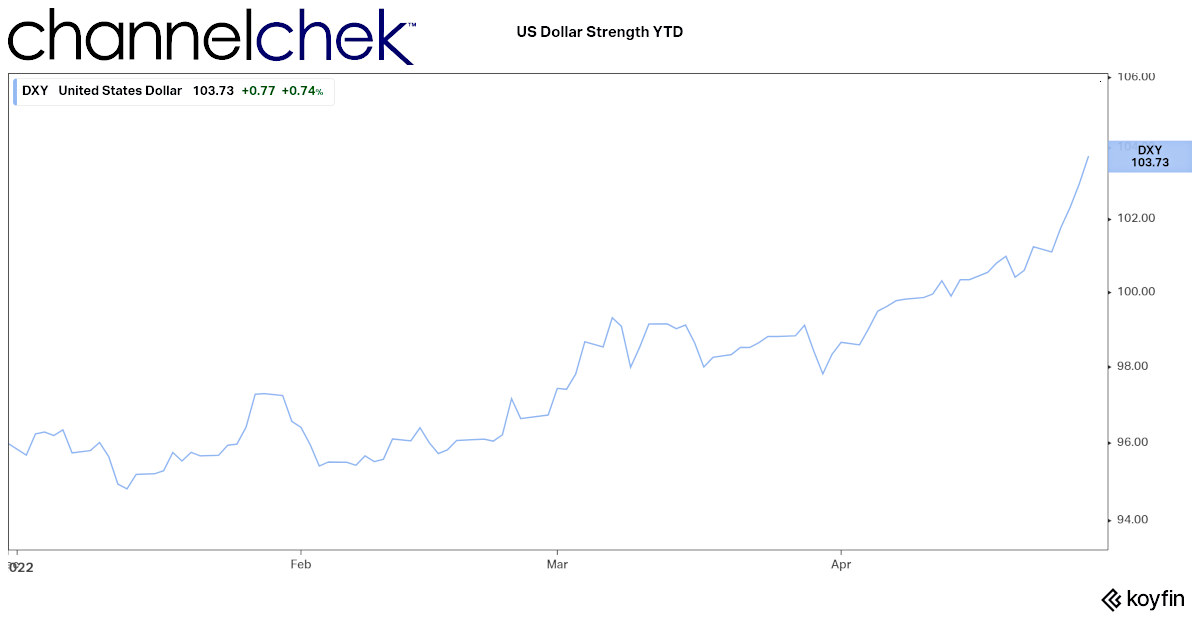
Likewise, while the USD Index has come down from its recent high, it’s no coincidence that the dollar basket bottomed with the FCI in January 2021 and hit a new high with the FCI in January 2022. Thus, while the recent consolidation may seem troubling, the medium-term fundamentals supporting the greenback remain robust.

Thus, while the USD Index has surpassed 100 and reflects the fundamental reality of a higher FCI and higher real yields, the PMs do not. However, the PMs are in la la land since the FCI is now at its highest level since the global financial crisis (GFC).

Please see below:


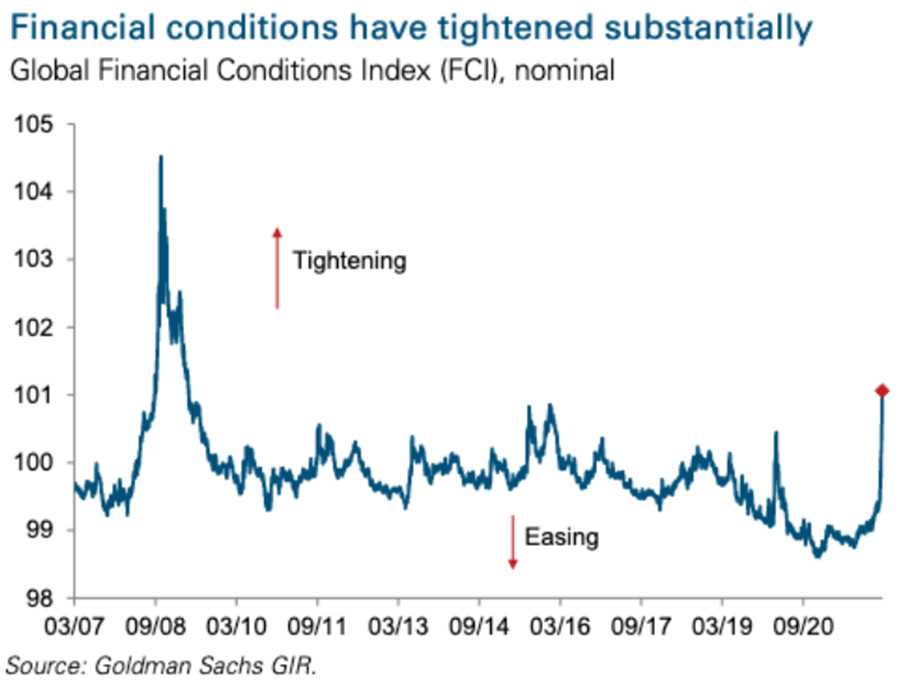
Also noteworthy, the FCI made quick work of the March 2020 high from the first chart above. Again, Fed officials know that higher real yields and tighter financial conditions are needed to curb inflation. That’s why they keep amplifying their hawkish message and warning investors of what lies ahead. However, with commodities refusing to accept this reality, they’ll likely be the hardest-hit once the Fed’s rate hike cycle truly unfolds.

Speaking of which, Fed Governor Lael Brainard said on Apr. 12: “Inflation is too high, and getting inflation down is going to be our most important task.”

She added: “I think there’s quite a bit of capacity for labor demand to moderate among businesses by actually reducing job openings without necessitating high levels of layoffs.” As a result, she’s telling you that Fed officials will make it their mission to slow down the U.S. economy.

With phrases like “capacity for labor demand to moderate” and “reducing job openings” code for what has to happen to calm wage inflation, the prospect of a dovish 180 is slim to none. As such, this is bullish for real yields and bearish for the PMs.

More importantly, notice her use of that all-important buzzword.


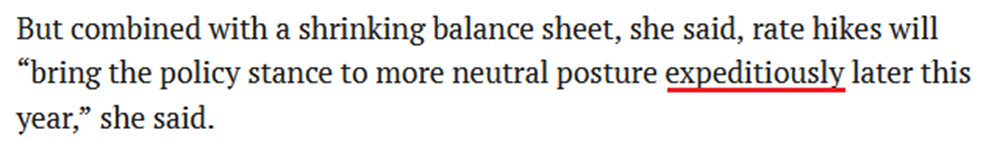
Moreover, where do you think she got it?


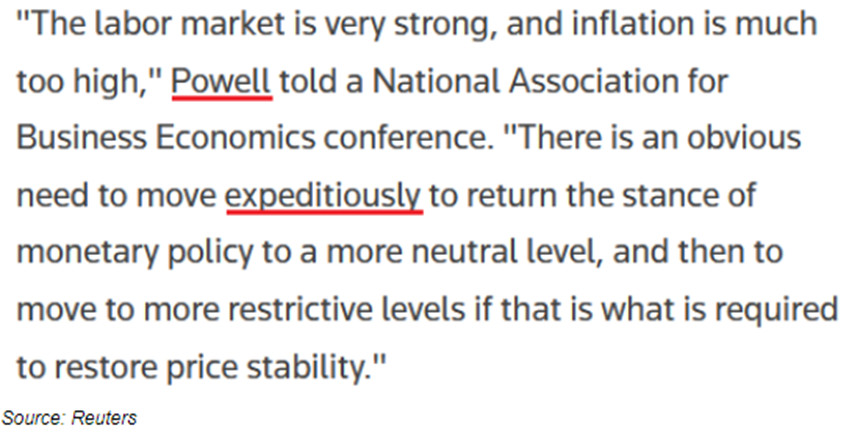
For context, Powell said that on Mar. 21. The bottom line? It’s remarkable how the PMs’ fundamentals can deteriorate so rapidly while sentiment remains so optimistic. However, while the Russia-Ukraine conflict keeps the momentum alive, it’s likely a long way down when the war premiums unravel.

Moreover, while real yields and financial conditions imply much lower prices for the PMs, they still have plenty of room to run over the medium term. As a result, while the permabulls may feel invincible, the fundamentals that drove the PMs’ performance over the last 15+ years couldn’t be more bearish.

In conclusion, the PMs rallied on Apr. 12, as momentum runs high across the commodity complex. However, investors either fail to foresee the medium-term consequences of the Fed’s rate hike cycle, or they simply don’t care. Either way, reality should re-emerge over the next few months, and once sentiment shifts, the PMs’ lack of fundamental foundations should result in profound drawdowns.

Thank you for reading our free analysis today. Please note that the above is just a small fraction of the full analyses that our subscribers enjoy on a regular basis. They include multiple premium details such as the interim targets for gold and mining stocks that could be reached in the next few weeks. We invite you to subscribe now and read today’s issue right away.


About the Author:  
Przemyslaw Radomski, CFA  (PR) writes for and publishes articles that underscore his disposition of being passionately curious about markets behavior. He uses his statistical and financial background to question the common views and profit on the misconceptions.


Suggested Reading


Precious Metals Seem to be Ignoring the Fed’s message


The SPAC Advantage in a Volatile or Bear Market


How do Gold Royalty Companies Work?


Metals & Mining First Quarter 2022 Review and Outlook


Source

https://www.sunshineprofits.com/


Stay up to date. Follow us:


FINRA Says Only 14 Percent of Investors Think ESG Naturally Outperforms the Market


Image Credit: Scott (Flickr)


FINRA Survey Suggests Many ESG Investors May be Unaware Followers


Are ESG investors like airline passengers? A recent FINRA survey indicates, yes.

Perhaps you do this; when I get off the plane in a strange airport, I follow the crowd until I figure out where the baggage claim is. Sometimes, after a couple of minutes, I’ll ask someone that looks confident and was on my plane, where baggage is. I often find out they don’t know either; they have just been following others like me.

Survey of Investors About ESG

Gerri M. Walsh is the president of the FINRA Investor Education Foundation. Along with the NORC of the University of Chicago, they surveyed retail investors on their knowledge of Environmental, Social, and Governance (ESG) investing. Investing in funds and securities that have been designated as ESG has been a hot trend. Growth in ETFs alone has gone from $78 billion in 2019 to $378 billion earlier this year. This is a 485% increase in just over three years.

Since the trend toward investing in the ESG category is showing rampant growth, one might expect those among the herd know where they’re headed. This survey discovered instead that about one in four people believes the acronym stands for “earnings, stock, growth,” according to this well-formulated study.


Global Growth ESG ETF Assets from 2006 to February 2022 ($Billion)


Data: Statista


Survey Results

“Retail investors don’t understand ESG investing—only 9% say that they have ESG-related investments, and the familiarity with the concept is not as high or as broad as some of the coverage on the topic of ESG investing might suggest,” says Gerri Walsh.

Of the 1,228 investors surveyed, only 24% could correctly define ESG investing, and just 21% knew what the letters in ESG stood for. Walsh says this discovery is “both surprising and concerning.”

“If people are going to be thinking about these issues, we need to make sure that investors understand what we’re talking about, especially retail investors,” says FINRA’s president of investor education. “We need to make sure that people understand the terminology that’s being used, and what’s behind ESG investing.”


As uncovered by the survey, respondents said environmental factors were the least important when investing. The most important consideration respondents said are financial factors, including whether an investment has the potential for high returns, the related risk, and the associated fees. Perhaps the massive inflow into ESG funds has been performance-driven much more than the criteria followed by ESG funds.

The survey did, however, find that intentional ESG investors are highly motivated by ESG factors, especially the environment. When it comes to ESG funds’ performance, the greater part of investors (41%) believes that returns for companies that prioritize their impact on the environment and society will be the same as the overall market. Only 14% expect ESG investments to outperform the market.

Recent Performance Comparison

For the year 2021, a year strong year for stocks when the broader market was up 28.7% ($IVV), sustainable index funds produced similar returns. According to Morningstar data, the 13 ESG index funds available to U.S. investors that follow broad, diversified indexes of U.S. large-cap stocks posted gains ranging from 25.6% to 31.7%. Their average return was 29.2%, or 0.50% higher than the broad non-ESG specific measure.

Take-Away

There are all styles of investing. This is part of what makes markets. One conclusion that can be drawn from a recent collaboration by investment and research organizations is that ESG investors while growing in numbers, may not be intentionally investing in stocks of environmental, social, and corporate governance-minded companies. Perhaps this means investors were just following the amplified buzz around these investments. Or, it could hint that they were chasing returns that, in some cases, were running higher than the overall market.

What is now empirically shown is that only 14% believe that ESG will naturally outperform non-categorized investments. However, investing in ESG, whether intentional or not, has not been a bad move.

Paul Hoffman

Managing Editor, Channelchek


Suggested Reading


Issues Driving ESG Investing


What’s an ESG Score?


ESG Growing Pains Include Greenwashing


Are Small-Cap Stocks Smart Investments?


Sources

https://www.finra.org/about/executives/gerri-walsh

https://www.barrons.com/articles/esg-meaning-sustainable-investing-study-51649719876

https://www.morningstar.com/products/esg-investing

https://www.statista.com/topics/7463/esg-and-impact-investing/


Stay up to date. Follow us:


Morningstar Analyst Peeks Behind AARK Curtain and Calls Fund Wretched


Morningstar Analyst Cites Many Reasons to Downgrade Cathie Wood’s Flagship Fund


When it rains, it pours on ARK Invest. Morningstar has dropped Cathie Wood’s flagship Fund, the ARK Innovation ETF (AARK), to the lowest level on its analyst scale. The influential research firm’s analyst has a long list of reasons to be so hard on the “disruptive” tech fund. He also directs advice specifically at Cathie Wood as manager of the firm she founded.


Source: Morningstar


Morningstar Actions

In a research note released earlier this week, fund analyst Robby Greengold, CFA, downgraded ARKK to Negative from Neutral. He simultaneously dropped the fund’s People and Parent ratings to Below Average from Average. He explains in a laundry list of issues the reasons for the downgrades. Many of them describe a seat-of-the-pants, lack of benchmarking strategy, that he says is employed by the chief investment officer, Cathie Wood.

Fund Downgrade

In his write-up titled Why We’ve Downgraded ARK
Innovation
, Greenwold is critical right from his first sentence, he writes, “ARK Innovation ETF (ARKK) shows few signs of improving its risk management or ability to successfully navigate the challenging territory it explores.”

He goes on to find risk in the funds diversification, AARK holds only 35 stocks (down from 60 last year). The holdings are all companies of Wood’s highest conviction ideas. Part of the issue here is that many of these companies have highly correlated stock prices, and several of them are unprofitable. 

Other criticisms explained with the fund downgrade include:

“Manager Cathie Wood has since doubled down on her perilous approach in hopes of a repeat of 2020, when highly volatile growth stocks were in favor.”

“Since its meteoric rise in 2020, the strategy’s exchange-traded fund has been one of the worst-performing U.S.-sold funds, as the aggressive-growth stocks it held fell back to earth.”

“She has saddled the portfolio with greater risk by slashing its number of stocks to 35 from 60 less than a year ago–thereby amplifying stock-specific risk.”

“Rather than gauge the portfolio’s aggregate risk exposures and simulate their effects during a variety of market conditions, the firm uses its past as a guide to the future…”


People and Parent Downgrade

As part of the ratings downgrade for People and Parent of the ETF, Robby Greenwold discusses the lack of depth and succession planning:

“ARK has in place a poor succession plan for the 66-year-old Wood, who is essential as the firm’s majority owner and lone portfolio manager. Director of research Brett Winton would succeed her if needed, but his 15 years of industry experience include none as a manager. Exacerbating that key-person risk is the firm’s inability to develop and retain talent: Many of its analysts have come and gone, and most of the nine remaining lack deep industry experience.”

Philosophical Differences

The Morningstar analyst seems to be at disagreement with the philosophy that investors in funds choose the sector or sub-sector and leave the investing in the hands of a fund manager they deem capable. And, if the manager is not fully invested, they are interfering with the investor’s allocation strategy. Under this philosophy, any diversification away from a sector is for the investor. Instead, Greenwold says, “Wood has suggested that risk management lies not with her but with those who invest in ARK’s funds.”  He believes that a fund manager should be the one calling the market, and not just looking for long-term winners within the confines of the prospectus. Greenwold writes, “ARK could do more to avert severe drawdowns of wealth, and its carelessness on the topic has hurt many investors of late. It could hurt more in the future.”


Paul Hoffman

Managing Editor, Channelchek


Suggested Reading


SPACs, Equity Research, and Bowling


SPAC Supply Provides Rare Opportunity


The Appeal of EVs with Bidirectional Charging


Are Small-cap Stocks Smart Investments?


Sources

https://www.morningstar.com/articles/1086987/why-weve-downgraded-ark-innovation


Stay up to date. Follow us:


The SEC Wants to Extend Investor Protections to Crypto Platforms


Image Credit: Third Way Think Tank (Flickr)


Looming Cryptocurrency Regulation and SEC Thoughts


Gary Gensler, the chairman of the Securities and Exchange Commission (SEC) has asked the Commission’s staff to study how to extend investor protections to cryptocurrency platforms. The staff was also tasked with determining how to regulate platforms where securities and non-securities, like cryptocurrencies, trade together. This information was made public by the SEC chairman at the annual conference of the Penn Law Capital Markets Association at the University of Pennsylvania Carey Law School (Monday, April 4).

Platforms that enable trading in tokens and even lending platforms, whether centralized or decentralized, are averaging volume of more than $100 billion worth of cryptocurrencies a day. The majority of transactions, a full 99% of all trading is done on only five platforms. DeFi, or decentralized finance, is similarly concentrated with the top five platforms accounting for about 80% of trading, he said.

The SEC oversees brokers that trade securities, so Gensler has asked those that report to him at the  SEC “how best to register and regulate platforms where the trading of securities and non-securities is intertwined.” He said the SEC and the Commodity Futures Trading Commission, using their respective authorities, should jointly address platforms that might trade both crypto-based security tokens and some commodity tokens.

“These crypto platforms play roles similar to those of traditional regulated exchanges,” the chairman said. “Thus, investors should be protected in the same way.”

Gensler expects the same set of rules would help the crypto/securities platforms. He said if a company builds a crypto market that protects investors against fraud and manipulation and safeguards market integrity, “then customers will be more likely to trust and have greater confidence in that market.”

He offered help from the authorities, Gensler said, if a security is being offered to the public and not registering or making the requisite disclosures, he would suggest: “Come in, work with us, and get registered.”


The current SEC head, a former Wall Street executive and MIT crypto professor, said he wants crypto platforms to be registered and regulated to protect customers’ assets. Unlike traditional exchanges, centralized crypto trading platforms take custody of their customers’ assets, Gensler noted. And last year, a whopping $14 billion was stolen.

Gensler also asked if crypto platforms’ market-making functions should be separated. His reasoning, cryptocurrency trading platforms can also act as market makers, trading for their own accounts against customer trades. This poses conflicts of interest, the kind which are regulated against at traditional exchanges like the New York Stock Exchange. He also said tokens that are securities should be registered with the agency. “Issuers of crypto tokens that are securities must register their offers and sales of these assets with the SEC and comply with our disclosure requirements, or meet an exemption.”

Yet there is little incentive for token creators to go through the registration process. If there is no exchange to list them, registration would leave them no place to trade. The exchanges may have to change their requirements and definitions first. “Until the platforms are registered and regulated, I don’t think the tokens will significantly come in and register,” Gensler said.

It is a chicken and egg conundrum. If crypto assets have forms or disclosures with which they “truly cannot comply [with], our staff is here to discuss and evaluate those concerns,” he said. However, if a token is in structure also a security, Gensler said it must “…play by the same market integrity rulebook as other securities under our laws.“  Crypto may offer new ways for entrepreneurs to raise money to fund their projects and for investors to trade, but “when a new technology comes along, our existing laws don’t just go away,” he said.

Take-Away

Broadly, at the Penn Law Capital Markets Association, SEC Chair Gensler made a renewed call for comprehensive regulations to protect investors and allow the crypto market to grow with uniform rules. He expressed the auto industry, benefitted from speed limits, with police enforcing them, and traffic lights. “If we hadn’t done that, would we have sold as many cars? No way,” he said. “Our capital markets and our economy benefit from some basic rules of the road.”


Suggested Reading


Will the SEC Allow ETFs to Own Cryptocurrency?


SEC Climate Change Disclosure Rules and Challenges


SEC Investigates Digital Engagement Practices in Broker Apps


Cryptocurrencies in 2022, a View from Academics


Sources

https://www.investopedia.com/sec-chair-regulate-crypto-platforms-like-exchanges-5224794

https://www.forbes.com/sites/tedknutson/2022/04/04/crypto-regulatory-loopholes-could-undermine-90-years-of-securities-law-warns-sec-chairman-gensler


Stay up to date. Follow us:

What is the PCE Price Index (In 500 Words or Less)


The Lesser-Known Inflation Indicator is Preferred By Fed Officials


Most people quote inflation based on the Bureau of Labor Statistics Consumer Price Index or CPI.  But the metric the Federal Reserve is said to find more valuable is the Personal Consumption Expenditures Price Index, or PCE Price Index.

What is it that makes this measure considered more relevant to gauge inflation, and economic impact?

First, the number is composed of a very broad range of expenditures far broader than CPI. The PCE Price Index is also weighted by data reported through business surveys. Businesses account for and document transactions far better than households. CPI is consumer or household-based.

While CPI is based on a basket of goods and services that is revised infrequently, The PCE Price Index uses a formula that allows for changes in consumer behavior and changes that occur in the short term. For example, if gas prices rise and consumers drive less or switch to a lower octane fuel, this information is more useful than just noting that gas prices are up. These adjustments in consumer behavior are not made in the CPI calculation. This makes the PSE Price Index a more comprehensive metric for measuring price changes that impact the economy.


Advantages / Disadvantages of PCE Price Data

Personal consumption expenditures provide a glimpse of how the economy is going. When people are spending without any hesitation, it usually means that the economy is doing well. But when they cut back, it points to problems in the overall economic picture. Monitoring whether consumers are increasing spending, decreasing, or finding replacements that are less expensive is meaningful to recognizing and forecasting trends. This helps the Fed assess economic needs that may be assisted through monetary policy.

Source: Bureau of Economic Analysis


Stay up to date. Follow us:


What is the PCE Price Index (In 500 Words or Less)?


The Lesser-Known Inflation Indicator is Preferred By Fed Officials


Most people quote inflation based on the Bureau of Labor Statistics Consumer Price Index or CPI.  But the metric the Federal Reserve is said to find more valuable is the Personal Consumption Expenditures Price Index, or PCE Price Index.

What is it that makes this measure considered more relevant to gauge inflation, and economic impact?

First, the number is composed of a very broad range of expenditures far broader than CPI. The PCE Price Index is also weighted by data reported through business surveys. Businesses account for and document transactions far better than households. CPI is consumer or household-based.

While CPI is based on a basket of goods and services that is revised infrequently, The PCE Price Index uses a formula that allows for changes in consumer behavior and changes that occur in the short term. For example, if gas prices rise and consumers drive less or switch to a lower octane fuel, this information is more useful than just noting that gas prices are up. These adjustments in consumer behavior are not made in the CPI calculation. This makes the PSE Price Index a more comprehensive metric for measuring price changes that impact the economy.


Advantages / Disadvantages of PCE Price Data

Personal consumption expenditures provide a glimpse of how the economy is going. When people are spending without any hesitation, it usually means that the economy is doing well. But when they cut back, it points to problems in the overall economic picture. Monitoring whether consumers are increasing spending, decreasing, or finding replacements that are less expensive is meaningful to recognizing and forecasting trends. This helps the Fed assess economic needs that may be assisted through monetary policy.

Source: Bureau of Economic Analysis


Stay up to date. Follow us:


What is a Stock Split


Why Stocks Split and the Possible Impact to Investors


Reason for a Company to Split its Stock

When stocks split, it is most often a decision by the company to lower its trading price range to a level small enough to attract more investors and enhance the liquidity of trading in its shares.

Variations of Splits

A company’s board of directors may decide to split the stock by any ratio. For example, the most common is 2:1 (the stockholder receives two shares for each one they own), but 3:1, even 5:1 is not uncommon. In a 2:1 split there will be double the amount of shares trading, the price per share will approximate half of what it was before the split.

Impact to Market Cap

Market capitalization is calculated by multiplying the total number of shares outstanding by the price per share. For example, if XYZ Corp. has 10 million shares outstanding and the shares are trading at $20 Its market cap will be 200 million. If the company’s board of directors decides to split the stock 2:1 the number of shares outstanding would double to 20 million, while the share price would be roughly halved to $10.

Reasons for a Stock Split

The decision to go through the administrative expense is usually based on one or two of the following:

First, stocks traditionally traded in “round-lots” of 100 and multiples of 100. Companies often decide on a split when the stock price has reached a level where it is preventing those that the company would most likely want as owners from investing in round-lots.  

Second, the lower priced, higher number of shares outstanding can result in greater liquidity for the stock. This is because it facilitates transactions and could narrow the spread between bid and offer.

Increased liquidity helps owners large and small find buyers when they are looking to sell, and sellers when they are looking to buy. With high liquidity, a large number of shares can be traded without much impact on price levels. While this is positive for all who transact in the shares, companies that may look to repurchase their shares also don’t have as much concern about escalating the price they’re paying. Management can also exercise their ability to sell large amounts they may have acquired as part of their compensation without causing the price to plummet.

Stock Price

While a split, in theory, should have no effect on a stock’s price, it often results in renewed investor interest, which can have a positive effect. Stock splits by large heavily traded companies are often bullish for their market capitalization numbers, and positive for investors.

When You Own Shares

When a stock you own splits, shareholders of record are credited with their additional shares. For instance, in a 2:1 stock split, if you owned 100 shares that were trading at $20 just before the split, you would then own 200 shares at about $10 each. Your broker would handle this automatically, so there is nothing you need to do.

Will a Stock Split Affect My Taxes?

No. The cost basis of each share owned after the stock split will be half of what it was before the split for tax purposes.


Are Stock Splits Good or Bad?

Stock splits are usually done when the share price has risen so high that it might reduce trading. This means investors were driving the company valuation higher. So splits often happen in healthy growing companies. Plus, a stock that has just split may see an uptick in interest as it attracts new investors at the lower price tag per share.


Suggested Reading


What is Fed Tightening?


What is the Yield Curve?


Stay up to date. Follow us:


The Yield Curve as a Leading Indicator Has Been Compromised


What is an Inverting Yield Curve and Does it Mean We’re Heading for a Recession?


One key predictor of downturns in the economy is what is known as the yield curve. This typically refers to the market for what the US government borrows, by issuing bonds and other securities that mature over different time horizons ranging from weeks to 30 years.

Each of these securities has its own yield (or interest rate), which moves up and down in inverse proportion to the security’s market value – so when bonds are trading at high prices, their yields will be low and vice versa. You can draw a chart that plots the yields of securities at each maturity date to see how they relate to one another, and this is known as the yield curve.

In normal times, as compensation for higher risk, investors expect higher rates of interest for money they lend over a longer time horizon. To reflect this, the yield curve normally slopes up. When it instead slopes down – in other words, when it inverts – it is a sign that investors are more pessimistic about the long term than the short term: they think a downturn or a recession is coming soon.

This is because they expect the Federal Reserve, the US central bank, is going to cut short-term interest rates in the future to stimulate a struggling economy (as opposed to raising rates to cool down an economy that is overheating).

Most closely watched is the relationship between two-year and ten-year US treasury debt. The so-called spread between these two metrics can be seen in the chart below, with the gray areas indicating recessions that have followed shortly after.


Spread Between Two-Year and Ten-Year Treasuries


Source: St Louis Fed


As you can see, the yields of these two securities are getting very close to being the same, and the trend suggests that the two-year could soon have a higher yield – meaning the curve is inverting. The key question is, does an inverted yield curve hint at an upcoming downturn? Not necessarily. Let me explain why.

Inflation Expectations

One complication is that bond yields don’t only reflect what investors think about future economic growth. They also buy or sell debt securities depending on what they think is going to happen to inflation. It’s generally assumed that prices will rise in the years ahead, and investors need to be compensated for bearing that risk since higher inflation will erode their future purchasing power. For this reason, bond yields contain an element of inflation premium, normally with an increasingly higher premium for bonds with longer maturity dates.

The following chart shows the spread between the inflation expectations built into 10-year and 2-year Treasuries. The fact that it is in negative territory suggests the market thinks that inflation may fall, and this may also explain why yields on longer-dated Treasuries are lower than on shorter-dated ones. And although inflation would fall in the event of an economic slowdown or recession, there could be a situation where inflation fell but the economy remained buoyant. Hence a yield curve inversion doesn’t have to mean that we are up against an imminent recession.


Inflation Expectations (Ten-Year vs. Two-Year Treasuries)


Source: St Louis Fed


Quantitative Easing

Another factor that is potentially affecting the yield curve is the Federal Reserve’s moves to buy government debt as part of its quantitative easing program (QE). The idea behind QE is that by buying long-term bonds, the Fed is able to keep long-term interest rates low, which decreases the rates on mortgages and other loans, thereby stimulating the economy. Conversely, when sold, lending rates will go up and economic activity will be reduced.

Earlier in March, the Fed started raising the benchmark US interest rate and stopped the asset purchases under the QE program that it launched in 2020 in response to the COVID pandemic. But it also indicated that it would only start selling these assets after several months of hiking the benchmark rate. Since the benchmark rate is a short-term rate, the yield curve inverting might indicate market expectations that short-term interest rates will be higher than long-term ones for the foreseeable future.


Which Yield Curve Should We Consider?

It is also sometimes argued that two-year/ten-year spreads are not the most useful relationships to watch and that instead, one should focus on yields at the shorter end of the yield curve. In this setup, if you look at the difference in yields between two-year and three-month treasuries, it is actually steepening: in other words, it is hinting that economic growth is going to increase in the short term.

Economists sometimes argue that these near-term yield curve movements have stronger predictive power than those further out. At the very least, the fact that these are saying something different shows the need to be careful because different data about treasury yields can depict a different (or even opposite) picture depending on what time horizon you are considering.


Spread Between Two-Year and Three-Month Treasury Yields


Source: St Louis Fed

To summarise, it doesn’t necessarily follow that an inverted yield curve will be followed by a recession. It certainly could mean that, in which case unemployment would likely rise and inflation would potentially come down more quickly than many are expecting. But for now, it’s too early to say. The debt market is certainly signaling that change is coming, though it’s often easier to say in hindsight what it meant in hindsight.


This article was republished with permission from The Conversation, a news site dedicated to sharing ideas from academic experts. It represents the research-based findings and thoughts of Luciano Rispoli Teaching Fellow in Economics, University of Surrey.


Suggested Reading


How Rising Rates Could Make Brokers Like Robinhood More Profitable


The Detrimental Impact of Fed Policy on Savers


Was the Inflation of 1982 Like Today’s?


What is the Yield Curve?


Stay up to date. Follow us:


What is a Stock Split?


Why Stocks Split and the Possible Impact to Investors


Reason for a Company to Split its Stock

When stocks split, it is most often a decision by the company to lower its trading price range to a level small enough to attract more investors and enhance the liquidity of trading in its shares.

Variations of Splits

A company’s board of directors may decide to split the stock by any ratio. For example, the most common is 2:1 (the stockholder receives two shares for each one they own), but 3:1, even 5:1 is not uncommon. In a 2:1 split there will be double the amount of shares trading, the price per share will approximate half of what it was before the split.

Impact to Market Cap

Market capitalization is calculated by multiplying the total number of shares outstanding by the price per share. For example, if XYZ Corp. has 10 million shares outstanding and the shares are trading at $20 Its market cap will be 200 million. If the company’s board of directors decides to split the stock 2:1 the number of shares outstanding would double to 20 million, while the share price would be roughly halved to $10.

Reasons for a Stock Split

The decision to go through the administrative expense is usually based on one or two of the following:

First, stocks traditionally traded in “round-lots” of 100 and multiples of 100. Companies often decide on a split when the stock price has reached a level where it is preventing those that the company would most likely want as owners from investing in round-lots.  

Second, the lower priced, higher number of shares outstanding can result in greater liquidity for the stock. This is because it facilitates transactions and could narrow the spread between bid and offer.

Increased liquidity helps owners large and small find buyers when they are looking to sell, and sellers when they are looking to buy. With high liquidity, a large number of shares can be traded without much impact on price levels. While this is positive for all who transact in the shares, companies that may look to repurchase their shares also don’t have as much concern about escalating the price they’re paying. Management can also exercise their ability to sell large amounts they may have acquired as part of their compensation without causing the price to plummet.

Stock Price

While a split, in theory, should have no effect on a stock’s price, it often results in renewed investor interest, which can have a positive effect. Stock splits by large heavily traded companies are often bullish for their market capitalization numbers, and positive for investors.

When You Own Shares

When a stock you own splits, shareholders of record are credited with their additional shares. For instance, in a 2:1 stock split, if you owned 100 shares that were trading at $20 just before the split, you would then own 200 shares at about $10 each. Your broker would handle this automatically, so there is nothing you need to do.

Will a Stock Split Affect My Taxes?

No. The cost basis of each share owned after the stock split will be half of what it was before the split for tax purposes.


Are Stock Splits Good or Bad?

Stock splits are usually done when the share price has risen so high that it might reduce trading. This means investors were driving the company valuation higher. So splits often happen in healthy growing companies. Plus, a stock that has just split may see an uptick in interest as it attracts new investors at the lower price tag per share.


Suggested Reading


What is Fed Tightening?


What is the Yield Curve?


Stay up to date. Follow us:


Regulators May Add New Guard Rails to Temper Investment Risk


Image Credit: Image Image: Eric Ward (Flickr)


Retail Investors May Soon See More Safety Measures Including Coursework and Testing


The decline in cost, ease of use, and low cost of money have been positive for both investors and the brokerage industry. However, over the past few years, there has also been much greater use of what the regulators have referred to as “complex” investment products. These could include leveraged ETFs, options, or even structured interest rate products. It has been a while since groups of investors have been stung by derivative-based investments or others with risk that difficult to assess. Both FINRA and the SEC are considering whether the rules on availability should be reworked for both investors and those giving investment advice.


FINRA Taking Action

The Financial Industry Regulatory Authority (FINRA), is an authority working under the Securities and Exchange Commission (SEC) that writes and enforces rules that govern the activities of all registered broker-dealer firms and registered brokers in the U.S. It measures best practices, required practices, and protects the investing public against fraud and bad behavior of professionals.

FINRA recently released a regulatory notice to brokerage firms, reminding them of the risks of “complex” products and the legal obligations they have of making sure their investors are offered only suitable investment products. The notice said, “The number of accounts trading in complex products and options has increased significantly in recent years.” It went on to state that, “… important regulatory concerns arise when investors trade complex products without understanding their unique characteristics and risks.”


Not long ago, a live financial professional was the primary means of opening an account and learning of suitable investment products.  Image: Campus Production (Pexels)

FINRA, which is a self-regulating entity promoting and enforcing its rules, is now seeking comments on whether the current regulatory framework is adequate to protect investors. It noted that the old rules were adopted when most financial products were bought through direct contact with financial professionals, whereas today many of these products are bought and sold through self-direct trading platforms like Robinhood or other online brokers.

Defining “Complex”

FINRA describes a complex product in its regulatory notice as “a product with features that may make it difficult for a retail investor to understand the essential characteristics of the product and its risks (including the payout structure and how the product may perform in different market and economic conditions).” These can include “Mutual funds and ETFs that offer strategies employing cryptocurrency futures.” It also lists leveraged and inverse exchange-traded products, volatility-linked ETPs, structured products, and defined outcome ETFs, which offer exposure to the performance of a market.

“We continue to believe that the features of these products are such that they may be difficult for a retail investor to understand the essential characteristics of the products and their risks and, are, therefore complex,” FINRA said.


Access to all markets has become much easier. Image Credit: Techdaily.ca


Self-Directed Brokerage Platform

“These concerns may be heightened when a retail customer is accessing these products through a self-directed platform and without the assistance of a financial professional, who may be in a position to explain the key features and risks of the product to the retail investor,” FINRA expressed.

As part of the regulatory notice, FINRA opened a comment period to ask what additional requirements may be necessary to protect investors from a much faster and easier investing environment that includes new products without enough history to fully understand, particularly at the retail investor level. FINRA specifically asked as it relates to retail investors and self-directed platforms, “are additional guardrails needed for these types of platforms?”

Tests for Retail Transactions

FINRA may also be leaning toward retail investors needing to demonstrate adequate knowledge of the products they are risking money on.

The notice asks whether retail customers should be required “to demonstrate their understanding of those common characteristics and risks of complex products by completing a knowledge check and, if the customer fails to show the requisite knowledge, requiring the completion of a learning course and additional assessment?” In other words, a test, and perhaps a class.

Standard Options Trades

Most retail investors with a brokerage account never even considered the notion of trading options. That has changed.  FINRA writes that listed options trading volume has grown by 30% over 2020 and is almost 100% higher than in 2019.

“Similar to transactions in complex products, buying or selling options can be risky for retail investors who trade options without understanding their vocabulary, strategies and risks. Members should consider whether investors understand the various risks of trading options…” FINRA said.

Take-Away

Regulators, in any industry are wrestling with a rapidly changing world. The investment business has transformed rapidly with no-cost transactions, portable apps, and game-like point and execute functionality. FINRA is looking at its current safeguards and policies designed to protect the clients of those it regulates and is likely to make some adjustments after the comment period.

FINRA encourages all interested parties to comment on this request for comment. Comments must be received by May 9, 2022.

Paul Hoffman

Managing Editor, Channelchek


Suggested Reading


SEC Investigates Digital Engagement Practices in Broker Apps


SEC Climate Change Disclosure Rules and Challenges


Why Some are More Vulnerable to Financial Scams


Bitcoin ETFs Again Experience Extreme Caution from SEC


Sources

https://www.finra.org/rules-guidance/notices/22-08


Stay up to date. Follow us:


Precious Metals Seem to be Ignoring the Feds Message


Image credit: Michael Steinberg (Pexels)


Wake Up, Gold Market! Otherwise Inflation Will Step on You


The Fed’s hawkish alerts seem like a voice in the wilderness to gold investors. However, a carefree attitude can backfire on them – in just a few months.

An epic battle is unfolding across the financial markets as the Fed warns investors about its looming rate hike cycle and the latter ignores the ramifications. However, with perpetually higher asset prices only exacerbating the Fed’s inflationary conundrum, a profound shift in sentiment will likely occur over the next few months.

The Fed has turned the hawkish dial up to 100. Yet, it’s remarkable how much the precious metal’s domestic fundamental outlooks have deteriorated in recent weeks. Yet, prices remain elevated, investors remain sanguine, and the bullish bands continue to play.

However, with inflation still rising and the Fed done playing games, the next few months should elicit plenty of fireworks. For example, with another deputy sounding the hawkish alarm, San Francisco Fed President Mary Daly said on Mar. 22: “Inflation has persisted for long enough that people are starting to wonder how long it will persist. I’m already focused on making sure this doesn’t get embedded and we see those longer-term inflation expectations drift up.”

As a result, Daly wants to ensure that the “main risk” to the U.S. economy doesn’t end up causing a recession.


“Even though we have these uncertainties around Ukraine, and we have uncertainties around the pandemic, it’ still time to tighten policy in the United States,” Daly said at a Brookings Institute event. “marching” rates up to the neutral level and perhaps even higher to a level that would restrict the economy to ensure inflation comes down.

            Reuters


Likewise, St. Louis Fed President James Bullard reiterated his position on Mar. 22, telling Bloomberg that “faster is better,” and that “the 1994 tightening cycle or removal of accommodation cycle is probably the best analogy here.”


“The Fed needs to move aggressively to keep inflation under control.” Bullard said in an interview Tuesday on Bloomberg Television with Michael McKee. “We need to get to neutral at least so we’re not putting upward pressure on inflation during this period when we have much higher inflation than we’re used to in the U.S.”

            Bloomberg


Falling on Deaf Ears

To that point, while investors seem to think that the Fed can vastly restrict monetary policy without disrupting a healthy U.S. economy, a major surprise could be on the horizon. For example, the futures market has now priced in nearly 10 rate hikes by the Fed in 2022. As a result, should we expect the hawkish developments to unfold without a hitch?


To explain, the light blue, dark blue, and pink lines above track the number of rate hikes expected by the Fed, BoE, and ECB. If you analyze the right side of the chart, you can see that the light blue line has risen sharply over the last several days and months. For your reference, if you focus your attention on the material underperformance of the pink line, you can see why I’ve been so bearish on the EUR/USD for so long.

Also noteworthy, have a look at the U.S. 2-Year Treasury yield minus the German 2-Year Bond yield spread. If you analyze the rapid rise on the right side of the chart below, you can see how much short-term U.S. yields have outperformed their European counterparts in 2021/2022.


Source: Bloomberg

More importantly, though, with Fed officials’ recent rhetoric encouraging more hawkish re-pricing instead of talking down expectations (like the ECB), they want investors to slow their roll. However, investors are now fighting the Fed, and the epic battle will likely lead to profound disappointment over the medium term.

Case in point: when Fed officials dial up the hawkish rhetoric, their “messaging” is supposed to shift investors’ expectations. As such, the threat of raising interest rates is often as impactful as actually doing it. However, when investors don’t listen, the Fed has to turn the hawkish dial up even more. If history is any indication, a calamity will eventually unfold.


To explain, the blue line above tracks the U.S. federal funds rate, while the various circles and notations above track the global crises that erupted during the Fed’s rate hike cycles. As a result, standard tightening periods often result in immense volatility.

However, with investors refusing to let asset prices fall, they’re forcing the Fed to accelerate its rate hikes to achieve its desired outcome (calm inflation). As such, the next several months could be a rate hike cycle on steroids.

To that point, with Fed Chairman Jerome Powell dropping the hawkish hammer on Mar. 21, I noted his response to a question about inflation calming in the second half of 2022. I wrote on Mar. 22:

“That story has already fallen apart. To the extent it continues to fall apart, my colleagues and I may well reach the conclusion we’ll need to move more quickly and, if so, we’ll do so.”

To that point, Powell said that “there’s excess demand” and that “the economy is very strong and is well-positioned to handle tighter monetary policy.” As a result, while investors seem to think that Powell’s bluffing, enlightenment will likely materialize over the next few months.


“The labor market is very strong, and inflation is much too high,” Powell told a National Association for Business Economics Conference. “There is an obvious need to move expeditiously to return the stance of monetary policy to a more neutral level, and then to move to more restrictive levels if that is what is required to restore price stability.”

In particular he added, “if we conclude that it is appropriate to move more aggressively by raising the federal funds rate by more than 25 basis points at a meeting, we will do so.”


Reuters

Furthermore, with Goldman Sachs economists noting the shift in tone from “steadily” in January to “expeditiously” on Mar. 21, they also upped their hawkish expectations. They wrote:

“We are now forecasting 50bp hikes at both the May and June meetings (vs. 25bp at each meeting previously). The level of the funds rate would still be low at 0.75-1% after a 50bp hike in May, and if the FOMC is open to moving in larger steps, then we think it would see a second 50bp hike in June as appropriate under our forecasted inflation path.”

“After the two 50bp moves, we expect the FOMC to move back to 25bp rate hikes at the four remaining meetings in the back half of 2022, and to then further slow the pace next year by delivering three quarterly hikes in 2023Q1-Q3. We have left our forecast of the terminal rate unchanged at 3-3.25%, as shown in Exhibit 1.”


In addition, this doesn’t account for the Fed’s willingness to sell assets on its balance sheet. For context, Powell said on Mar. 16 that quantitative tightening (QT) should occur sometime in the summer and that shrinking the balance sheet “might be the equivalent of another rate increase.” As a result, investors’ lack of preparedness for what should unfold over the next few months has been something to behold. However, the reality check will likely elicit a major shift in sentiment.


In contrast, the bond market heard Powell’s message loud and clear, and with the U.S. 10-Year Treasury yield hitting another 2022 high of ~2.38% on Mar. 22, the entire U.S. yield curve is paying attention.


 Investing.com

Finally, the Richmond Fed released its Fifth District Survey of Manufacturing Activity on Mar. 22. With the headline index increasing from 1 in February to 13 in March, the report cited “increases in all three of the component indexes – shipments, volume of new orders, and number of employees.” 

Moreover, the prices received index increased month-over-month (MoM) in March (the red box below), while future six-month expectations for prices paid and received also increased (the blue box below). As a result, inflation trends are not moving in the Fed’s desired direction.


 Richmond Fed

Likewise, the Richmond Fed also released its Fifth District Survey of Service Sector Activity on Mar. 22, and while the headline index decreased from 13 in February to -3 in March, current and future six-month inflationary pressures/expectations rose MoM.


Richmond Fed

The bottom line? While the Fed is screaming at the financial markets to tone it down to help calm inflation, investors aren’t listening. With higher prices resulting in more hawkish rhetoric and policy, the Fed should keep amplifying its message until investors finally take note. If not, inflation will continue its ascent until demand destruction unfolds and the U.S. slips into a recession. As such, if investors assume that several rate hikes will commence over the next several months with little or no volatility in between, they’re likely in for a major surprise.

Summation

Precious metals declined on Mar. 22, as the sentiment seesaw continued. However, as noted, it’s remarkable how much the metals domestic fundamental outlooks have deteriorated in recent weeks. Thus, while the Russia-Ukraine conflict keeps them uplifted, for now, the Fed’s inflation problem is nowhere near an acceptable level. As a result, when investors finally realize that a much tougher macroeconomic environment confronts them over the next few months, the shift in sentiment will likely culminate in sharp drawdowns.


About the Author:  Przemyslaw
Radomski, CFA
  (PR) writes for and publishes articles that underscore his disposition of being passionately curious about markets behavior. He uses his statistical and financial background to question the common views and profit on the misconceptions.


Suggested Reading


Inflation Seems Persistent, What Now?


The Feds Fight Against Raging Inflation is a Process


What is the Yield Curve?


What is Fed Tightening?


Stay up to date. Follow us:


Precious Metals Seem to be Ignoring the Fed’s Message


Image credit: Michael Steinberg (Pexels)


Wake Up, Gold Market! Otherwise Inflation Will Step on You


The Fed’s hawkish alerts seem like a voice in the wilderness to gold investors. However, a carefree attitude can backfire on them – in just a few months.

An epic battle is unfolding across the financial markets as the Fed warns investors about its looming rate hike cycle and the latter ignores the ramifications. However, with perpetually higher asset prices only exacerbating the Fed’s inflationary conundrum, a profound shift in sentiment will likely occur over the next few months.

The Fed has turned the hawkish dial up to 100. Yet, it’s remarkable how much the precious metal’s domestic fundamental outlooks have deteriorated in recent weeks. Yet, prices remain elevated, investors remain sanguine, and the bullish bands continue to play.

However, with inflation still rising and the Fed done playing games, the next few months should elicit plenty of fireworks. For example, with another deputy sounding the hawkish alarm, San Francisco Fed President Mary Daly said on Mar. 22: “Inflation has persisted for long enough that people are starting to wonder how long it will persist. I’m already focused on making sure this doesn’t get embedded and we see those longer-term inflation expectations drift up.”

As a result, Daly wants to ensure that the “main risk” to the U.S. economy doesn’t end up causing a recession.


“Even though we have these uncertainties around Ukraine, and we have uncertainties around the pandemic, it’ still time to tighten policy in the United States,” Daly said at a Brookings Institute event. “marching” rates up to the neutral level and perhaps even higher to a level that would restrict the economy to ensure inflation comes down.

            Reuters


Likewise, St. Louis Fed President James Bullard reiterated his position on Mar. 22, telling Bloomberg that “faster is better,” and that “the 1994 tightening cycle or removal of accommodation cycle is probably the best analogy here.”


“The Fed needs to move aggressively to keep inflation under control.” Bullard said in an interview Tuesday on Bloomberg Television with Michael McKee. “We need to get to neutral at least so we’re not putting upward pressure on inflation during this period when we have much higher inflation than we’re used to in the U.S.”

            Bloomberg


Falling on Deaf Ears

To that point, while investors seem to think that the Fed can vastly restrict monetary policy without disrupting a healthy U.S. economy, a major surprise could be on the horizon. For example, the futures market has now priced in nearly 10 rate hikes by the Fed in 2022. As a result, should we expect the hawkish developments to unfold without a hitch?


To explain, the light blue, dark blue, and pink lines above track the number of rate hikes expected by the Fed, BoE, and ECB. If you analyze the right side of the chart, you can see that the light blue line has risen sharply over the last several days and months. For your reference, if you focus your attention on the material underperformance of the pink line, you can see why I’ve been so bearish on the EUR/USD for so long.

Also noteworthy, have a look at the U.S. 2-Year Treasury yield minus the German 2-Year Bond yield spread. If you analyze the rapid rise on the right side of the chart below, you can see how much short-term U.S. yields have outperformed their European counterparts in 2021/2022.


Source: Bloomberg

More importantly, though, with Fed officials’ recent rhetoric encouraging more hawkish re-pricing instead of talking down expectations (like the ECB), they want investors to slow their roll. However, investors are now fighting the Fed, and the epic battle will likely lead to profound disappointment over the medium term.

Case in point: when Fed officials dial up the hawkish rhetoric, their “messaging” is supposed to shift investors’ expectations. As such, the threat of raising interest rates is often as impactful as actually doing it. However, when investors don’t listen, the Fed has to turn the hawkish dial up even more. If history is any indication, a calamity will eventually unfold.


To explain, the blue line above tracks the U.S. federal funds rate, while the various circles and notations above track the global crises that erupted during the Fed’s rate hike cycles. As a result, standard tightening periods often result in immense volatility.

However, with investors refusing to let asset prices fall, they’re forcing the Fed to accelerate its rate hikes to achieve its desired outcome (calm inflation). As such, the next several months could be a rate hike cycle on steroids.

To that point, with Fed Chairman Jerome Powell dropping the hawkish hammer on Mar. 21, I noted his response to a question about inflation calming in the second half of 2022. I wrote on Mar. 22:

“That story has already fallen apart. To the extent it continues to fall apart, my colleagues and I may well reach the conclusion we’ll need to move more quickly and, if so, we’ll do so.”

To that point, Powell said that “there’s excess demand” and that “the economy is very strong and is well-positioned to handle tighter monetary policy.” As a result, while investors seem to think that Powell’s bluffing, enlightenment will likely materialize over the next few months.


“The labor market is very strong, and inflation is much too high,” Powell told a National Association for Business Economics Conference. “There is an obvious need to move expeditiously to return the stance of monetary policy to a more neutral level, and then to move to more restrictive levels if that is what is required to restore price stability.”

In particular he added, “if we conclude that it is appropriate to move more aggressively by raising the federal funds rate by more than 25 basis points at a meeting, we will do so.”


Reuters

Furthermore, with Goldman Sachs economists noting the shift in tone from “steadily” in January to “expeditiously” on Mar. 21, they also upped their hawkish expectations. They wrote:

“We are now forecasting 50bp hikes at both the May and June meetings (vs. 25bp at each meeting previously). The level of the funds rate would still be low at 0.75-1% after a 50bp hike in May, and if the FOMC is open to moving in larger steps, then we think it would see a second 50bp hike in June as appropriate under our forecasted inflation path.”

“After the two 50bp moves, we expect the FOMC to move back to 25bp rate hikes at the four remaining meetings in the back half of 2022, and to then further slow the pace next year by delivering three quarterly hikes in 2023Q1-Q3. We have left our forecast of the terminal rate unchanged at 3-3.25%, as shown in Exhibit 1.”


In addition, this doesn’t account for the Fed’s willingness to sell assets on its balance sheet. For context, Powell said on Mar. 16 that quantitative tightening (QT) should occur sometime in the summer and that shrinking the balance sheet “might be the equivalent of another rate increase.” As a result, investors’ lack of preparedness for what should unfold over the next few months has been something to behold. However, the reality check will likely elicit a major shift in sentiment.


In contrast, the bond market heard Powell’s message loud and clear, and with the U.S. 10-Year Treasury yield hitting another 2022 high of ~2.38% on Mar. 22, the entire U.S. yield curve is paying attention.


 Investing.com

Finally, the Richmond Fed released its Fifth District Survey of Manufacturing Activity on Mar. 22. With the headline index increasing from 1 in February to 13 in March, the report cited “increases in all three of the component indexes – shipments, volume of new orders, and number of employees.” 

Moreover, the prices received index increased month-over-month (MoM) in March (the red box below), while future six-month expectations for prices paid and received also increased (the blue box below). As a result, inflation trends are not moving in the Fed’s desired direction.


 Richmond Fed

Likewise, the Richmond Fed also released its Fifth District Survey of Service Sector Activity on Mar. 22, and while the headline index decreased from 13 in February to -3 in March, current and future six-month inflationary pressures/expectations rose MoM.


Richmond Fed

The bottom line? While the Fed is screaming at the financial markets to tone it down to help calm inflation, investors aren’t listening. With higher prices resulting in more hawkish rhetoric and policy, the Fed should keep amplifying its message until investors finally take note. If not, inflation will continue its ascent until demand destruction unfolds and the U.S. slips into a recession. As such, if investors assume that several rate hikes will commence over the next several months with little or no volatility in between, they’re likely in for a major surprise.

Summation

Precious metals declined on Mar. 22, as the sentiment seesaw continued. However, as noted, it’s remarkable how much the metals domestic fundamental outlooks have deteriorated in recent weeks. Thus, while the Russia-Ukraine conflict keeps them uplifted, for now, the Fed’s inflation problem is nowhere near an acceptable level. As a result, when investors finally realize that a much tougher macroeconomic environment confronts them over the next few months, the shift in sentiment will likely culminate in sharp drawdowns.


About the Author:  Przemyslaw
Radomski, CFA
  (PR) writes for and publishes articles that underscore his disposition of being passionately curious about markets behavior. He uses his statistical and financial background to question the common views and profit on the misconceptions.


Suggested Reading


Inflation Seems Persistent, What Now?


The Feds Fight Against Raging Inflation is a Process


What is the Yield Curve?


What is Fed Tightening?


Stay up to date. Follow us: