Michael Burry’s Stock Market Holdings (Filed May 16, 2022)


Image Credit: Pixabay (Pexels)


Michael Burry’s Latest Portfolio Brings the FAANGS Out

On Monday, May 16, Michael Burry filed his company’s holdings report with the SEC. Relative to the previous quarter, there was significant reshuffling. While it’s rare to get an explanation of his thinking beyond an occasional tweet of warning or tweet of frustration, his quarterly positions report is worth reviewing. It lends a rare clue as to what the celebrated hedge fund manager is expecting.

Michael Burry’s thinking, reflected in Scion Asset Management’s 13F holdings (a/o March 31), are shown below. Following the holdings we offer company descriptions and some thinking related to a few of the holdings.
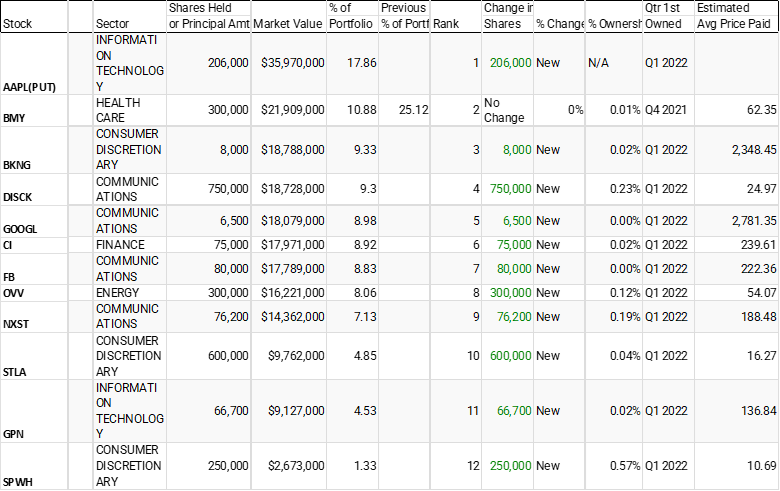

Source: WhaleWisdom

Why it Matters

The positions in Scions portfolio are usually few, quite deliberate, and not the result of herd thinking. During the prior quarter (Q4 2021), among the scant positions were two public prison stocks ($GEO and $CXW). While many pundits and YouTube “gurus” hazarded a guess as to what Burry may have expected to occur with crime, the positions may have had nothing to do with an expected need for jail cells. Following the stock tickers links above to the Channelchek reports discloses that public policy on for-profit prisons is in flux. The positions may have just been a play on policy direction.

Burry’s investment universe is broader than the average self-directed investor and even deeper than the average hedge fund manager. The positions report reflect just those required to be disclosed in an SEC 13F filing. With this in mind, out of the entire universe of public securities Scion could hold, there are only a dozen that Burry’s portfolio felt were worthy at the end of the first quarter. One is a Put position which effectively makes him short the stock and possibly expecting more red than green, but not necessarily.


Holdings Breakdown

Scion has a Put on Apple (AAPL) with contracts to control 206,000 shares. The portfolio is also long shares of two other megacap high-tech stocks adding to a similar notional amount. Of the three, based on price earnings ratio, Apple is by far the most expensive. Apple’s P/E is at 23.7 earnings, while Google/Alphabet (GOOGL) is trading at a much lower PE of 20.7x, and Facebook/Meta (FB) is even lower yet at 15.1x price to earnings. This AAPL Put may not be a bet against Apple as much as it is a play that FAANG stocks should trade with multiples more in-line with each other. If this is the case, he’s not looking to hit a home run, but instead looking for movement either down by Apple, or up by the two other FAANG stocks to net incremental capital gains.

Since the 4Q of 2021, he has held Bristol Myers Squibb (BMY).  Year-to-date 2022 the biopharmaceutical company is up 19% vs the S&P 500 which is down 9.8%. Discover Network C shares (DISCK) is his fourth largest by market value. The C shares of Discovery allow no voting rights. Discovery’s A shares allow one vote per share, and B shares 10 votes per share.

Moving down the list shows a very diversified portfolio of long positions including Cigna (CI) a health care insurer, Ovintiv (OVV) a Canadian based fossil fuel company trading at 8x earnings, and Nexstar Media (NXST) which is a media company that owns television broadcast networks not unlike DISCK.

Stellantis NV (STLA) is a Dutch automaker trading on the NYSE and London exchanges. It owns the Chrysler and Jeep brands as well as Alpha Romeo, Peugeot, and Maserati. STLA pays above-average annual dividends. It declared a dividend on February 25, with an ex-dividend date of April 19. The period covered in Scion’s 13F is through March 31. 

In the consumer discretionary category Scion’s portfolio held two companies month-end that stand to benefit as consumers fill their need to travel and play outdoors. Bookings.com (BKNG) which is a huge online travel website and retailer Sportsman’s Warehouse (SPWH) which is a small-cap value stock trading at only 3.75x earnings.

The last is a payment tech company called Global Payments (GPN). The company’s product line runs the full gamut of electronic merchant payment products.

 Take-Away

Dr. Michael J. Burry has an excellent record of spotting investment opportunities before the rest of the market. His picks are as disparate as the mortgage market in 2008 and GameStop (GME) in 2020.

The portfolio reported by the SEC on May 16, reflecting March 31 quarter-end holdings does not have a strong theme. The most talked-about position has been the Puts on Apple. As mentioned, that play may be more complicated and be a hedge involving other long holdings.

Sign-up to receive Channelchek updates in your inbox.

Paul Hoffman

Managing Editor, Channelchek

Suggested Content


Michael Burry Sees Positive in Elon Musk’s Twitter Stake


Why Michael Burry has Better Opportunity Than Cathie Wood


Is the Index Bubble Michael Burry Warned About Still Looming?


Michael Burry’s Stock Market Holdings (Filed Feb 14, 2022)

Sources

https://www.sec.gov/Archives/edgar/data/0001768023/000156761922010751/xslForm13F_X01/primary_doc.xml

https://whalewisdom.com/filer/scion-asset-management-llc#tabholdings_tab_link

www.koyfin.com

Stay up to date. Follow us:


Protecting Portfolios from Losses While Capturing Gains


Image Credit: Pixabay (Pexels)


Better Your Risk Management Investing Strategy with Protective Puts

The year 2020 and 2021, despite the coronavirus-related selloff, left most stock market investors with outsized gains. From January 1, 2020, through today (May 13), the S&P is up 20%. So while this year’s moves may be negative, many investors still have gains to either realize or protect. Realizing gains is easy; you pick your spot and sell out of your position. But what may not be easy is the taxes that may accompany those gains or parting with a position that you believe over the long term will excel. If you are confident the best place for your assets is your current position, protecting it with an options strategy may be the best way to protect against your downside, and only curtail your upside potential by the price of the protective options used as insurance.

Hedging Against Downward Moves

If you have unrealized capital gains, you are probably glad but may be an anxious trader or investor. Volatility, as measured by the VIX is at a level that is considered negative for stocks. Yet, if you believe stocks you own still have upside once we get through this period where covid, crypto, low unemployment, higher interest rates, and war can cause the prices on your holdings to swing in an unpredictable fashion, an options strategy may make sense for you.  

One method experienced investors employ is the protective put.


Image: Koyfin

What is a Protective Put?

There are two main types of options: put and call options. The buyer of a call has the right to buy a stock at a set price until the options contract expires. The buyer of a put has the right to sell a stock at a set price until the contract expires.

If you own a stock, a protective put position is created by purchasing put options on the name or something highly correlated to the stock. And, at a quantity that will roughly trade one to one with your position. The put allows the owner to sell the underlying stock at the price predefined in the options contract. This is the mirror trade to a covered call which involves selling the right to buy a stock owned. Investors that are more comfortable with covered call options can think of purchasing a put to protect a long stock position, much like a synthetic long call.

The benefit of a protective put strategy is it helps protect against losses during a price decline in the assets name, while still benefitting from capital appreciation if the stock increases in value. Of course, there is a cost to any insurance against big losses: in the case of a protective put, it is the price of the option. Essentially, if the stock goes up, you have unlimited profit potential (less the cost of the put options), and if the stock goes down, the put goes up in value to offset losses on the stock.

Removing the Mystery

Assume you own 100 shares of ABC Company at $50 per share from April 2020. The cost of this trade was $5,000.

The stock is now trading at $65 per share, and you think it might go to $70 or more. However, you are concerned about stablecoin problems and the Fed putting the kibosh on growth.

A protective put reduces risk if you maintain your position in the stock so you benefit if it reaches your $70 price target. At the same time, the put offers protection in case the market weakens or there is an unforeseen event with the company you own.

Example

Let’s say the stock is trading at $65, and suppose you’re tired of seeing your gains erode so you decide to purchase the 62 ABC Company October put option contract (the underlying asset is ABC Company stock, the exercise price is $62, and the expiration month is November) at $3 per contract (option price) for a total cost of $300 ($3 per contract multiplied by 100 contract shares).

If ABC continues to go up in value, your underlying stock position increases as normal and the put option falls “out of the money” (it can’t be exercised). For instance, if, at the expiration of the put contract, the stock reaches your $70 price target, you might then choose to sell the stock for a pretax profit of $1,700 ($2,000 profit on the underlying stock less the $300 cost of the option) and the option would expire worthless. It the stock went to $74, your overall net would be $2100. And you could realize it without having concerns about a sinking price.

But what if the price did get beaten up? If your fears about the market were realized and the stock was negatively impacted, your capital gains would be protected against a decline by the put.

Here’s how:

Assume ABC Corp. common shares declined from $65 to $55 prior to the option’s expiration. Without owning the put, if you sold the stock at $55, your pretax profit would be just $500 ($5,500 less $5,000). If you purchased the 62 ABC October put, and then sold the stock by exercising the option, your pretax profit would be $900. You could then sell the stock at the (put) exercise price of $62. As a result the profit from the put position would be $900. To calculate, use the $500 profit on the underlying stock, plus the $700 from the in-the-money put profit, less the $300 cost of that option. Compare this with a profit of $500 without the option contract.

The cost of the option doesn’t take much away from upside potential, by it protects against downside losses. If you think your stock price will not move in either direction, a put option may not benefit your strategy.


Circumstances to Consider Put Protection

Protective puts can be a useful strategy for traders and investors that expect a short- or intermediate-term decline in the price of a stock they own and have reasons not to sell. The reasons could be tax related, you may be somehow restricted from selling the shares, fierce volatility in the share price, it is exposure to the company you work for and selling is not yet permitted, building the position in thinly traded shares took time, etc.

Any one of these reasons might make it prudent to consider a protective put. Additionally there may be an event such as an earnings report that you expect will drive the price in ne direction or another, and you want to protect against the downside risk of that report.


Take -Away

Option protection in the form of puts comes at a cost that the investor needs to factor into their overall strategy. However, in volatile markets, knowing you’ll capture a large part of the upside if your stock moves up, and are protected from profit erosion if the stock declines allow for more overall comfort with the limited risk in the position.

Paul Hoffman

Managing Editor, Channelchek

Suggested Content


SPAC Investors Benefit from the Ability to Exercise Different Options


Finding Tomorrow’s Best Stocks Beneath a Cloak of Invisibility


Can You Gauge the Onset of Market Capitulation?


Managing Investment Portfolio Risk

Sources

https://www.nerdwallet.com/article/investing/put-options

Stay up to date. Follow us:


What is a Small-Cap Stock (In 500 Words or Less)


Small-Cap Stocks and How They’re Different

Shares of public companies with a total market capitalization between $300 million to $2 billion are categorized as small-cap.

Market capitalization is determined by taking a stock’s share price and multiplying it by all of the outstanding shares. If the product comes to between $300 million and $2 billion, it fits the definition of small-cap.

Example

ABC Company Share Price: $4.25

Shares Outstanding: 400 Million

Market Capitalization: $4.25 x 400,00,00 =

$1.7 Billion

The above example shows ABC Company trading at $4.25 per share. There are $400 million shares outstanding – by multiplying $4.25 by 400 million, it reveals the company has a market cap of $1.7 billion –  $1.7 billion is between $200 million and $2 billion, so it is categorized as a small-cap company.

Market-cap data is available for small-cap stocks on Channelchek and other websites that provide investor information on companies.

Why is it Important?

Investors generally view stocks in three size categories: large, mid, and small-cap. Some even add two other categories they call microcap and megacap.

Knowing a company’s size, measured by market capitalization, is useful information for investors, here’s why:

Small-cap companies can exist in any industry. The difference between the smaller company and those with larger capitalization in the same business is that smaller companies have an increased potential for growth. Smaller companies are also more prone to being acquired. A company that gets acquired usually does at a share price above market levels.  

Another possible benefit is small companies usually have a more focused business line which allows investors the ability to fine-tune their concentration. To understand this, take a small one-product company that gets FDA approval for the only drug it has been working on for years. Its share price would likely skyrocket. If a large-cap company like Johnson and Johnson got approval for a drug that is just as effective, the impact on J&J’s earnings would not be as impactful for the stock price.

This is because the larger J&J also sells many other products. The stock price of the small company typically would show a much greater impact. This is true of growth, earnings, profit, and market-cap which is watered down when you’re larger.

There are unique risks to small-cap companies as well. Take the company I just mentioned that has just one drug that received FDA approval. What if the drug was turned down? They don’t have other products they can sell to offset costs.

 Most larger company stocks were at one time small-cap stocks.

Performance

Small-cap stocks can also experience larger than average price swings. But, if you’re a long-term investor, it may be worth it.

In the past 20 years, the S&P SmallCap 600 index, a leading benchmark for small-cap stocks, has outperformed the S&P indexes for large- and mid-caps on an average yearly basis. During that period, the S&P’s benchmark small-cap index returned an average of *8.3% annually, compared to 8% and 6.3% from its mid- and large-cap indexes.

Because of their size, small-cap stocks have different risks and rewards for investors when compared to their larger counterparts.

Paul Hoffman

Managing Editor, Channelchek

Suggested Content


What Is a Tender Offer?


What is the Yield Curve?


Stay up to date. Follow us:


Are Stablecoin Markets Signaling a Crypto Crisis?


Image Credit: QuoteInspector.com (Flickr)


Will the Current Stablecoin Situation Hasten Regulation and Oversight?

A move toward regulating digital currencies is gaining momentum in the U.S., and elsewhere – stablecoins could be the first cryptocurrency to be handed a rulebook. The variety of Stablecoin that is designed with algorithms to provide one-for-one parity with the U.S. dollar value, are finding it difficult or impossible to remain pegged to the fiat currency. The strong onset of negative sentiment in the crypto markets has already caused some of these less speculative cryptocurrencies to “break-the buck.”  True oversight may be in the best interest of preserving these new asset types, but the loss of autonomy may undermine their purpose and popularity.

The Current Concern

The attraction of stablecoins is they are designed to maintain a fixed value yet still allow for payments without getting the banking system involved. The larger stablecoins, Tether (USDT-USD) and USD Coin (USDC), have maintained their dollar pegs. But another once rising star the “algorithmic” stablecoin called TerraUSD (UST) crashed as low as $0.23 on the dollar this past week. The current price (May 12) is approximately $0.46. The decline in value of UST-USD caused $10 billion in the stablecoin to evaporate. A related crypto token called Luna (LUNA) or Terra Luna caused even greater losses. Terra Luna is down 99.6% today. This is contributing to the selloff crypto speculators are seeing in other digital currencies such as Bitcoin (BTC).

Some are likening the Terra collapse to the “Lehman Brothers moment,” referring to the surprise collapse of the once investment bank. Lehman woke markets up as to the severity of the 2008 financial crisis. The domino effect spurred by its wake-up call signaled the beginning of the awareness to problems the banking system was dealing with.

Is it a Crisis?

Is this a crypto or stablecoin crisis? The Terra losses may be an isolated event that is confined to tokens that either have a different mathematical basis or are especially vulnerable to market volatility. But it highlights risks that have always been inherent in these assets and may indicate a need to evolve with or without the help of regulatory guidance and oversight. The usefulness of stablecoins is diminished if they become one of the more controversial types of traded tokens and payment methods.

Stablecoins are already causing concern among regulators and bankers because, among other things, the money supply is impacted by privately issued digital money. A run on a stablecoin could, in theory, lead to heavy selling in assets held in reserves, such as short-term commercial debt or other cash equivalents. There has also been concern since their growth in popularity that stablecoins are substitutes for Federal Reserve Notes. The problem could be that they bypass the system that measures capital flows in global transactions and other cross-border exchanges. This was recently highlighted as both Russia and Ukraine were able to get around any attempts to shut down exchanges of currency, of the crypto variety, into or moving outside the countries.

Regulation

U.S. Regulators and lawmakers have expressed other concerns related to protecting users of any type of non-regulated token. One is about the liquidity and quality of issuers’ reserve assets. Banks are structured and have oversight to make sure they can meet redemption requests. This is why we don’t have concerns about a run on banks any longer. Panic redemptions of stablecoins or other tokens could have the same economic unsettling impact as a run on banks.  

Tether considered the preferred stablecoin is still not transparent about its holdings. The company, based in the British Virgin Islands, issues a quarterly “assurance opinion” on its reserves from a Cayman Islands auditor. It shows more than 80% of its reserves were held in Treasurys, cash, certificates of deposit, and money-market funds at the end of December. Details about other holdings are barely defined. This includes $4.1 billion in “secured loans”; $3.6 billion in “corporate bonds, funds, and precious metals”; and $5 billion in “other investments,” including “digital tokens.”

To date, Tether has never refused a redemption.

The White House, for its part, wants coin issuers under federal supervision, potentially even carrying FDIC deposit insurance. Biden called on Congress to pass supervisory rules for stablecoins in a recent executive order.

Congress is also working on a variety of rules for stablecoins; a draft bill in the Senate would establish a process for banks and credit unions to issue stablecoins, among other measures.

Another concern of the house-of-cards variety is that crypto exchanges hold large amounts of Tether for market-making and trading liquidity. If Tether were to stop trading 1:1 with the U.S. Dollar, it could impact other crypto trading, which could impact crypto brokerages.

Take-Away

The future of independent stablecoins and other cryptocurrencies may hinge on what is occurring in these markets now. Stablecoins are now widely used as de facto dollars for cryptocurrency exchange. Tether, which has not shown signs of problems is widely used. So while stablecoins are only 12% of the cryptocurrency market, the trading volume is high.

Algorithmic-based coins now appear to be more vulnerable than those backed by assets such as Treasuries, CDs and cash equivalents. Those that are least transparent could also be valuable, but they will for now be considered riskier.

Paul Hoffman

Managing Editor, Channelchek

Suggested Content


Global Regulators Release Principles for Financial Market Infrastructures to Stablecoin


Stealth Digital Asset Bill Surprises Crypto Market


The Federal Reserve Continues to Equivocate on Crypto


Safe Haven Comparison During Downturns, Bitcoin vs. Gold

Sources

Stay up to date. Follow us:


Finding Tomorrow’s Best Stocks Beneath a Cloak of Invisibility


Image Credit: Mob Mob (Flickr)


Reinventing Your Trading as the Market Transforms Yet Again

Momentum traders were big gainers from the Summer of 2020 until January of 2022. Only a year ago, jumping onboard the Globalstar (GSAT), Gamestop (GME), or other meme stock freight train helped turn many accounts extremely green. That trade seems to be over for now, and traders and investors may now have to pivot. Just as they pivoted after the March 2020 selloff to find opportunity investing in FAANG stocks or following r/wallstreetbets conversations – the recent economic upheaval suggests another pivot may be required for investors to survive and thrive.

About the Market Selloff

While the activities of many retail investors quickly become running for cover when the market sells off, time should be dedicated to calmly looking at the big picture while remembering which products and services will have global appeal when the downward trend ends.

Lining up opportunities uncovered in the current carnage will prepare you to jump when the time is right.

This isn’t simple, it involves experiencing the anxiety of red days and recognizing the potential for future green. Some of the red stocks have become “on-sale” and should be further analyzed; others are approaching where they should have been valued all along. Work to determine which is which.

The markets have changed for now, going forward they will require the work they always used to require, and the rewards may not come as quickly or easily. But interesting companies still exist.

What I  Mean by “Interesting”

One company that seems to have its hand in everything that will be hot tomorrow, or maybe the day after, is Meta Materials (Nasdaq: MMAT). I’ll use it as an example as their earnings came out yesterday (May 10), and first quarter revenue was up 299%. This year the stock price has tumbled. Like most young tech companies, MMAT still operates at a loss; this example is not a recommendation one way or another.

Meta Materials was a company that flew under my radar until I learned about them at NobleCon18. They are involved in products that will help the builders of everything that we expect to see more of in the future. This includes:

  • Making 5G work substantially better
  • Resolving weather-related issues with automotive sensors
  • Medical imaging and sensing enhancement
  • Eliminating the need for expensive rare earth materials in touch screens
  • And a lot more

Ken Rice, the COO and CFO of Meta Materials, said at NobleCon, “we didn’t leave the Stone Age because we ran out of rocks, we left the Stone Age because somebody invented bronze and figured out it was better…” The company is providing better materials to growing industries and is doing it with greater speed, lower cost, and improved scale. 

They have over 269 active or pending patents from which to benefit; it is not a patent portfolio held to trade, this was made clear when during the NobleCon presentation, the COO said they exist to “keep everybody out of our sandbox.”

Meta materials is an interesting company with the promise of trumping yesterday’s amazing high-tech building materials with better ones. Watch the NobleCon18 video to understand how Meta Materials can essentially produce the “cloak of invisibility.”

What to Look For

History has shown us a few things about the stock market. First, it has always come back and hit new highs. Second, it confounds those that require certainty, investors are better served by placing probabilities in their corner, and third, there is always a rotation, while money is leaving one industry or sector, it is moving to another.

Technology has been a sector where a product or invention that was incredible when released, becomes replaced by something even better in a dozen years or so years. Pay no more attention to old technology then new. Look at what tomorrow is likely to demand to be better, this is one smart place theme to start a search.

Take-Away

Markets go up and markets go down. If it were predictable, it would already be where it’s going. What is highly probable is tomorrow’s technologies are going to be replacements for today’s. And, tomorrow is coming, there’s nothing we can do about it.

For investors and traders that are seeing more red in their portfolio than they have since March 2020, look with a level head at the possibilities still around, read up on some of the 6000+ small companies available on Channelchek, subscribe to Channelchek’s YouTube channel and don’t rush into anything until you’ve got a handle on your odds of success.

Paul Hoffman

Managing Editor, Channelchek

Suggested Content


Where are Consumers Most Likely to Spend Their Leisure Budget?


Winners and Losers in a Market Capitulation


History of Hawkish Fed Policy and Soft Landings


Meta Materials (MMAT) NobleCon18 Presentation Replay

Sources

https://feeds.issuerdirect.com/news-release.html?newsid=8330648170070524

https://channelchek.com/news-channel/Meta_Materials__MMAT__NobleCon18_Presentation_Replay

Stay up to date. Follow us:


Asset Classes that Perform Best and Worst with Negative Real Interest Rates


Image Credit: Kim Alaniz (Flickr)


With Negative Real Rates, What Sectors Have Historically Outperformed?

The “real interest rate,” is defined as the net amount earned less inflation on an interest bearing security. Real rates are now at a low the country hasn’t experienced since just after World War II. In fact, with the recent Consumer Price Index (CPI) spike to 8.5% from a year earlier, inflation is 6% to 7% higher than one year US treasury levels. This means the real return is a negative 6% to 7%.

When the more conservative investor using interest-bearing securities begins to see inflation outpacing their investments, as they are now (in most cases), they recognize their assets are losing buying power. Their investments are not paying enough to keep up with price rises and certainly not growing so they can be able to buy more later with their savings. These simpler investors, by holding on to treasury securities, CDs, or corporate bonds, are losing ground, this loss of usable wealth begins to cause investors to move down the risk curve.

Putting on Risk

Dr. Horstmeyer is a professor of finance at George Mason University’s Business School in Fairfax, Va. He and his team decided to collect hard data on this phenomenon and see how different asset classes perform when real interest rates turn negative and stay negative for a while.

What they found with their look back is that when real interest rates turn negative, the asset classes considered riskiest (emerging-markets stocks, small-caps, etc.) had done extremely well in the first half of the inflation/interest rate cycle. During this period, they outperform what’s considered safer assets by over 1.5 percentage points a month. Stretched out over several months with compounding, the investors have done well.

The performance benefit reverses to a degree for those invested in these assets into the second half of the cycle. On average, the riskier assets have underperformed by over a percentage point (monthly) in the second half of a negative-real-rate cycle. This does not suggest the investors fared worse by adding risk to their portfolio; it may indicate that many investors were prudent and did not let greed keep them in the riskier securities. The later investors exiting lost ground from earlier gains.

The Research

To investigate what happened in the past, Professor Horstmeyer and his research assistants Jaehee Lee and Natalia Palacios gathered interest-rate data (based on T-bills), inflation data, and mutual-fund-return statistics for various asset classes over the past 50 years. They examined periods since 1971 when real interest rates turned negative and stayed negative for more than a month.

The group identified seven periods like this – the average period length is 2.5 years. For each period, they labeled the first half and the second half. The researchers then compared performance; first half compared to second.


What Investors Should Note

They reported two findings that investors should be aware of. First, during the first half of a negative-rate cycle, the riskiest mutual funds performed best. Emerging-markets funds, US small-cap funds and international-stock funds averaged 1.96%, 1.13%, and 1.03% returns a month, respectively. This average monthly return is far superior to all other equities and far better than the average bond fund, which had average returns of 0.35% a month during this period.

Half-Way Point

The additional performance reversed as the cycles matured. In the second halves, the riskiest funds underperformed. For example, emerging-markets funds lost an average of 1.13% a month. So while investors were seeking risk in the first half, it appears they eventually faded away from it the longer as the US remained with a negative real interest-rate environment.

Where are We Now

According to their findings which is based on historical averages, the current negative-rate cycle began in the second quarter of 2020. This could mean, if the 50 year pattern holds true, many investors have shifted over to riskier assets already. Since we are still sitting with negative real rates in the cycle, approaching the third year, it’s impossible to know yet where the first half ends and the second begins. Thus, even if we haven’t fully hit the point where investors move out of riskier positions, judging by historical length and data, we’re likely close.

Paul Hoffman

Managing Editor, Channelchek

Suggested Content


Russell Reconstitution 2022, What Investors Should Know


Is the Index Bubble Michael Burry Warned About Still Looming?


Leveraged and Inverse ETFs Contain Extra Costs for Buy-and-Hold Investors


In Nine Years, Nearly All Boomers Will Have Retired, Is This Good for Stock Pickers?

Sources

https://www.bls.gov/cpi/#:~:text=CPI%20for%20all%20items%20rises,12%20months%2C%20not%20seasonally%20adjusted

https://www.wsj.com/articles/investment-negative-interest-rates-11651781476?mod=hp_jr_pos1


Stay up to date. Follow us:


Leveraged and Inverse ETF Do’s and Mostly Don’ts


Image Credit: Ross Edwin Thompson (Flickr)


Leveraged and Inverse ETFs Contain Extra Costs for Buy-and-Hold Investors

Exchange traded funds are a popular way to invest to gain exposure to an index or an industry sector. If you’re bullish on a sector, they take the work out of selecting individual stocks within that sector. Instead, an ETF allows you to be exposed to many stocks and earn the mixed return of its holdings (less mgmt. fee). This is a valid, and for some, prudent way to invest. It would seem to stand to reason then, with the market’s recent performance, that if you think the equitiies may be weak for a long period that you could invest in an inverse ETF, or even a 2x or 3x inverse. However, it isn’t that easy. There is great danger in these so-called “geared ETFs.” Traders should fully understand this danger so they don’t get caught.

Leveraged or geared ETFs are not invested the same way an index mimicking 1x ETF is. This difference limits their usefulness; they can serve effectively as a hedging tool short term but are likely to fail as a long-term investment play.

Background

The underlying financial tools in a leveraged or inverse ETF are reworked each day to deliver a set positive or negative multiple of the performance of an index. Individually their objective may be to attain the goal over a given time period, such as one day or one month. The most common of the currently listed geared ETFs, leverage factors are 1.5x, 2x, and 3x and inverse factors are -0.5x, -1x, -2x and -3x.

The vast majority of geared ETFs reset their exposure factors each day. This means that the stated leverage or inverse objective they aim for is within a single trading day, generally measured from the close of trading on one day to the close of trading on the next day.

The objective of a geared ETF with a daily reset is to provide that degree of leveraged or inverse exposure for that single period – not over longer (or even shorter) periods. (Similarly, a geared ETP with a monthly objective is designed to provide that leveraged or inverse exposure for a specified monthly period.)

Holding a geared ETF for a period that is shorter or longer than its objective can lead to performance that may deviate significantly from the daily objective. In other words, if you are invested in a 2x inverse S&P 500 ETF, and the benchmark falls 1% in 24 hours, the security should provide you with 2% in return. However if you hold the inverse leveraged ETF for two months and the S&P 500 average decline is 1%, you may have several percentage points eroded from your account assets. I’ll explain below. The investment product is not designed to provide twice the positive or inverse return of the index over longer periods.

Another example is an inverse ETF that seeks to deliver negative 1x the performance of the Nasdaq 100 Index. This ETF aims to deliver a return that is exactly the opposite of what the index returns (whether positive or negative) on a given day. If the Nasdaq 100 closes up 1.5 percent, the inverse ETF would aim to return a loss of 1.5 percent. If the index closes down 2 percent, the ETF should return a gain of 2 percent.

Why Don’t they Function Longer Term?

To achieve their expected returns, leveraged and inverse ETFs employ a range of investment strategies, including swaps, futures, and other derivatives in addition to possible long or short positions in securities.

Since geared ETFs are only designed to accomplish the stated leveraged or inverse objective on a daily basis, they don’t orchestrate their underlying financial instruments to accomplish anything different than that objective. It simply isn’t their goal. In fact, returns often differ significantly from the performance (or inverse of the performance) of their pegged benchmark over an extension beyond the stated period of time. This makes these products risky if they are held medium or long term, especially in volatile markets. While these ETFs can be held for periods that don’t align with their stated objective, generally, the position should be monitored closely and used by investors who understand what the products are designed for and how they incur costs to the longer-term holder – that performance is warped over extended periods.

The fund manager incurs a large daily cost by resetting the underlying instruments, far greater than a straight 1x ETF. Also, most of the underlying instruments incur futures decay as they move closer to their expiration date. Over one day this decay is accounted for in the daily mix, over a longer time period it is felt by the investor.

Things to Consider

Before committing money to any of these ETFs, clearly understand the specific leveraged or inverse ETF before investing in it. Be sure about your own purpose in committing money. Could the ETF accomplish or undermine your goal? Read the prospectus, and understand the objectives, risks, and costs.

When Might You Use a Geared ETF

Most of these ETFs are created to be used to hedge a portfolio or trading position overnight. Trading desks, institutional managers, and savvy retail investors with overnight positions may wish to protect against a large change in portfolio value while they are sleeping or through  weekend.

For example: If a trading desk is long $600,000 in stocks that would be expected to roughly track the Russell 2000, before the close they may protect the position from any big moves overnight by committing $200,000 to a 3x ETF of the index.  

Take-Away

Leveraged and inverse ETFs are designed as very short-term hedging and risk management tools. Investors that are considering a strategy to implement either short ETFs or leveraged should read the prospectus and understand the particular ETF thoroughly. Review the performance over a year versus the expected index.

Paul Hoffman

Managing Editor, Channelchek

Suggested Content


Will the SEC Double Down on Triple Leveraged ETFs?


Index Funds Still May Fall Apart over Time


Is the Index Bubble Michael Burry Warned About Still Looming?


Did the Stock Market Already Overshoot to the Downside in 2022?

Sources

https://www.sec.gov/investor/pubs/leveragedetfs-alert.htm#:~:text=As%20discussed%20above%2C%20because%20leveraged,the%20index%20showed%20a%20gain.

https://www.finra.org/investors/insights/lowdown-leveraged-and-inverse-exchange-traded-products


Stay up to date. Follow us:


Can You Gauge the Onset of Market Capitulation?


Image Credit: LM (Flickr)


Winners and Losers in a Market Capitulation

Capitulation can occur on an individual level, but the term is typically used when so many market participants are giving up on their holdings that the stock market moves down as if a bottom has fallen out. The setup for capitulation is in place well in advance of the hours, days, or months that these market events happen. And unlike black swan events which are almost always surprises, market capitulation is characterized by a build-up, and then a release.

It’s also characterized by many investors questioning themselves for holding for so long and potentially letting a profit turn into a loss.

Capitulate Definition

– to surrender often after negotiation of terms
          The enemy was forced to capitulate unconditionally.

-to cease resisting: ACQUIESCE
          The company capitulated to the labor union to avoid a strike.
                    -Merriam-Webster Online

Praying to the Gods of Breakeven

Market capitulation starts after the market has been strong and has rewarded risk-takers. Then stocks seem to be facing headwinds and average investor fears grow. But not by so much that they don’t keep assets in the market. At some point, while they are holding, and prices continue to decline, greed is overtaken taken by fear. That is to say, fear that their positions will never go back up. This fear is then accompanied by hope.

When all hope is lost, investors face what they believe to be reality and finally hit the sell button. They’re often so tired of the painful days that led them to that moment that they don’t care what the fill price is. This causes the market fall to accelerate, then masses holding positions on margin are also forced to sell. These margin calls help feed the accelerated market decline.

Later, like most financial market behavior, when the last person is done selling, there is only one direction the market can head. Up. While it may go sideways for a while, as recently as last year the market indexes hit all-time highs, this after many market capitulations that came before 2021. So up would seem to be the market’s natural long-term direction.

Seeing it Coming

Markets can come down much faster than they climb back up. So taking some risk off the table while the probability of a painful sell-off is increasing, is one way to spare yourself from the worst. This is tricky as people often “lose” more money in lost opportunity than ever lost permanently in the stock market. 

Market players tend to behave in a bear cycle similar to a person playing slots at a casino. The machine takes some money, takes some more money, then occasionally pays. This gives the player hope which convinces them to stay in their seat. Market participants also stay involved because they’re occasionally rewarded and they’d prefer not to miss out on regaining the amount they are down.  Investors may also stay involved because they know that out of every single market fall in history, the market has always come back and hit new highs.

Pay attention to the market’s technical signs if they indicate it may not hold up. Did it easily break through a support level? Is there greater volume on down days than up days? How far past its moving average has it declined?

Fundamental signs are also always worth paying attention to. Is joblessness rising, consumer confidence falling, are taxes being raised, or are interest rates causing money to be too tight for businesses to thrive?

If the market you’re involved in is showing either technical signs of weakening or fundamental factors working against it, the risks have increased.  

Using it to Your Advantage

Market professionals consider the capitulation phase as reflecting the bottom of the market’s price. If investors could identify when capitulation has taken place and it is exhausted fully, they could buy at the bottom. At the point of full capitulation, there are no sellers left, only buyers and the market’s bubble has burst and is set to reinflate.

Signs of Nearing Stock Capitulation

Since the capitulation phase reflects the bottom of a market’s decline, if investors could identify when capitulation has taken place, it would signal the ideal time to buy. As mentioned before, this is because everyone who wanted to sell the security has already done so, and only buyers are left.

The problem in identifying capitulation is that it is usually only visible in hindsight rather than in foresight.


Source: Koyfin

The one year chart above shows a slow march downward for 2022 for all S&P sectors except for oil (XLE) and utilities (XLU). No sector appears to have had the bottom fall out, and there are still investors whose positions are sitting well above what they paid for them. Newer positions however may now be at a loss. The longer the downward slide continues, the more likely individuals will give up hope and margin account holders will be called to sell their positions. This increases the likelihood of a short but sharp downward search for the bottom.

So far the 2022 move downward has been orderly and on a percentage basis not huge, but it is a real reminder that stocks go both up and down. It seemingly doesn’t show that capitulation is imminent or that it has already occurred.

Fundamentally the outlook for stocks is not one of disaster as labor markets are tight, and there is still a large amount of money in the system that the Federal Reserve has not begun to mop up yet. Also, company earnings are mixed to strong.

Crypto-Capitulation

Capitulation that occurs in cryptocurrency markets is often stronger than in equity markets. For example, Bitcoin had a precipitous drop starting on May 2, 2021 when it fell from $57,300. to $29,800. by July 17, 2021. This 40% drop was partially attributed to negative news coming out of China about Bitcoin mining. Capitulation is often more prevalent in speculative assets.

Bottom Line

If seeing the onset of capitulation and knowing when it is exhausted was easy, we’d all be rich. Since that isn’t the case, we can act prudently in a few different ways. Hedging one’s position using the futures market when they feel risk is increasing is one way. This can be effective both while holding a position as the market seems to be gaining downside momentum, or when the investor believes they have found the bottom but would like to protect any new investment.

It is important to remember that the overall indexes have always grown and reached new highs as the economy continues to expand.

Paul Hoffman

Managing Editor, Channelchek

Suggested Content


When Was the Shortest Recession in Your Lifetime?


Black Swans, Falling Knives, and Market Corrections (March 2020)


Food Costs, Empty Shelves, and Real Estate Prices Could Provide Investors With Opportunities


Many Reasons to Remain Bullish on the Energy Sector


Stay up to date. Follow us:


Investors May Find DiDi Untradeable After May


Image Credit: DiDi


Is DiDi Dead Money for Investors?

Didi Global Inc. (DIDI) shareholders will vote on its delisting at a special meeting on May 23. The downhill ride in stock price since last June began when the SEC began a probe into the corporation’s IPO. The company also came under the dark cloud that other Chinese technology companies were under, as Beijing had been creating rigid regulations making it more difficult for them to operate. That regulatory campaign has slowed.

Didi (DIDI) says, subject to applicable Chinese regulations it is cooperating with the SEC investigation. The ride-sharing company’s own guidance on the situation is not reassuring, “We cannot predict the timing, outcome or consequences of such an investigation,” DiDi wrote in a report to shareholders.

The company stock fell 7% in after-hours trading Tuesday and is down another 5.75% at midday today (May 4).

Details of the SEC probe have not been made public. Gaps in some disclosures before the IPO is a likely area of SEC investigation. What is known is the company didn’t tell investors that Chinese officials had urged the company to delay the IPO as the government was worried about revealing sensitive information in the offering. DiDi was then being reviewed by Beijing as a cybersecurity threat to China. This occurred just days after going public. The long selloff that followed has not had a reprieve. The IPO raised $4.4 billion at $14 per share.

The new U.S. Securities and Exchange Commission scrutiny mounts as Chinese regulatory pressures have not fully subsided. In December, DiDi said it would apply to list on the Hong Kong Exchange. But in March, the company said that it would delist from New York before looking for a new public listing. This is to cooperate with Beijing’s cybersecurity probe.

Shareholders will vote on the delisting on May 23, but company directors and strategic investors like Tencent (TCEHY) and Softbank (SFTBY) are likely to push it through. Smaller self-directed investors, many of who are sitting with huge losses, may find their ownership is “dead money” for an undetermined amount of time once the company is delisted.

Take-Away

The U.S. Securities and Exchange Commission is investigating Didi Global Inc.’s troubled 2021 public offering when the Chinese ride-hailing company raised $4.4 billion only days before revelations of a Chinese probe into data security pummeled the stock.

Like many other Chinese tech companies, Didi has come under the spotlight from regulators both in China and the U.S. since the IPO. Action from U.S. regulators shows that the end is not yet in sight for shareholders of the stock.

The company has been in talks with the Cyberspace Administration of China about a fine and penalties.

Paul Hoffman

Managing Editor, Channelchek

Suggested Reading


Ridesharing Giant DiDi Employees Banned from Selling Shares


DiDi is Delisting, What Does that Mean?


Are ADRs Riskier than Stocks?


Did the Stock Market Already Overshoot to the Downside in 2022?

Sources

https://finance.yahoo.com/news/didi-global-says-faces-sec-220926186.html

https://www.wsj.com/articles/didis-u-s-road-trip-just-got-even-bumpier-11651663261?mod=djemheard_t

https://www.bloomberg.com/news/articles/2022-05-03/didi-global-says-it-faces-sec-investigation-related-to-u-s-ipo-l2qpduya


Stay up to date. Follow us:


Did the Stock Market Already Overshoot to the Downside in 2022?


Image Credit: Kirt Edblom (Flickr)


Any Surprise After the FOMC Meeting and Announcement Could Be Rally-Worthy

The markets are again in an awkward position where bad economic news tends to cause a market rally. Strong economic news, of course, strengthens the Fed’s case for aggressively tightening. Equity markets have not been reacting well to the prospect of tightening. During April, almost all news was taken as bad. For example, after low unemployment numbers, the market traded off as this could heighten wage inflation. The negative GDP report also prompted market weakness as it may mean we are already in a recession.

Room to Significantly Bounce

May trading will start off with what most look at as getting “bad news” out of the way. The bad news is the FOMC decision on Rates which we should know by 2 pm Wednesday (May 4). Recently the Fed has been guiding the markets to expect 50bp of tightening in May. Another 50bp has been foreshadowed for June.

Anything more than 50bp in May or a statement suggesting that June could be higher than 50bp will bring in the sellers. But, there is a possibility the Fed may actually tone down its hawkish stance, and very little possibility they will amplify it.


Source: Koyfin

All major indices increased their losses during the month of April. Investors in the Nasdaq 100, which is heavily weighted toward large tech stocks, took the brunt of the fall. The indices all reached their high for the year during the first week in January. Shortly after this, the Fed began discussing inflation in terms that suggested rising prices would be more persistent than originally thought when they were labeled “transitory.”

The markets were then told to expect higher overnight bank lending rates (Fed Funds) and a smaller balance sheet (let bond purchases roll-off). The Fed approved a 0.25 percentage point rate hike on March 16, the first increase since December 2018.


Source: Koyfin

FOMC Meetings and Volatility

The VIX index, which is a measure of implied volatility, is currently trading around 33. This suggests the options market is pricing in a nearly 2.1% daily move in the S&P 500. If this number falls, it suggests volatility is decreasing.

Using the VIX as a guide, since the start of 2022, stock market investors have been more fearful before Fed meetings than after the meeting. In fact, the FOMC meetings have been followed by market rallies in the S&P 500. Unless the Fed does something more aggressive than previously indicated, the activity prior to the May meeting has given stocks plenty of room to bounce. The first look at the first-quarter GDP, which was negative, could cause the Fed to tone down their rhetoric.  A market hanging on every word would breathe a sigh of relief if a “softening” in the first quarter is mentioned.


Source: Koyfin

The definition of a recession is two consecutive quarters or more of negative growth. We are now in the second quarter; shrinking the economy would put us in a recession. Recessions accompanied by high inflation are the worst economic scenario (stagflation). No Fed wants to be viewed as being partially responsible for a period of stagflation.

Take-Away

Markets are not predictable, but they do establish patterns. The pattern for 2022 has been panic leading up to Fed meetings, then a relief rally after. The GDP number just released is likely to keep the Fed from becoming more aggressive in its stance. This has the potential to cause a bear market rally for investors that would prefer the market to repeat its dismal April performance.

Paul Hoffman

Managing Editor, Channelchek

Suggested Reading


Has the Fed Run Out of Good Options?


Russell Reconstitution 2022, What Investors Should Know


Consumer Price Index Report was a Contrarian Dream


Rumors of Fossil Fuels Death are Quite Premature


Stay up to date. Follow us:


The World Is HOT Right Now! – Panel Presentation from NobleCon18


The World Is HOT Right Now!

Making sense of the hot-button issues facing investors including: Supply chain constraints, ESG regulation, political unrest, inflation and War.

  • Moderator: Mike Gallagher, Radio Personality, Host of the Mike Gallagher Show
  • Brigadier General Blaine Holt, Deputy US Military Representative to NATO
  • Rani Selwanes, Noble’s Head of Investment Banking
  • Chuck Rubin, Chairman & CEO, Michaels; CEO Ulta Beauty (former)
  • Mark Chalmers, CEO, Energy Fuels

NobleCon 18 Complete Rebroadcast

Russell Reconstitution 2022, What Investors Should Know


The Annual Russell Index Revision and Dates to Watch (2022)

The yearly process of recasting the Russell Indexes begins on May 6, 2022, and will be complete by market opening on June 27. During the period in between, FTSE Russell will rank stocks for additions, for deletions and evaluate the companies to make sure they conform overall. The methodology for inserting and removing tickers in the Russell 3000, Russell 2000, and Russell 1000 is intentionally transparent to help eliminate price shocks. Price movements do of course occur along the way, and investors try to foresee and capitalize on them. Channelchek will be providing updates that may uncover opportunities, or at least provide an understanding of stock price swings during this period.

Background

Russell index products are widely used by institutional and retail investors throughout the world. There is more than $16 trillion currently benchmarked to a Russell index. This includes approximately $9 trillion benchmarked to the Russell US Equity indexes. The trading volume of some companies moving into an index will heighten around the last Friday in June as fund managers seek to maintain level tracking with their benchmark target. 

Opportunity

For non-passive investor money, determining which stocks may benefit from moving up to a large-cap index, down to a smaller one, or into or out of the measurements is an annual event causing volatility around stocks. There is, of course, the potential for very profitable long and short trades. And the potential for an unwitting investor to be holding a company moving out of an index, could cause less interest in the stock.

Active investors should make themselves aware of the forces at play so they may either get out of the way or become involved by taking positions with those being added or those at the end of their reign within one of the Russell measurements.

Dramatic Valuation Shifts

The leading industries and growing market-cap companies of a year ago have shifted dramatically from the reconstitution
last year
. This will be reflected in the 2022 rebalancing and is going to impact a much larger number of companies than most years. That is to say, more companies than normal will move in, out, or to another index, perhaps with amplified price movement.

The 2022 Russell Reconstitution Schedule:

• Friday, May 6 – “Rank Day” – Index membership eligibility for 2022 Russell Reconstitution determined from constituent market capitalization at market close.

• Friday, June 3 – Preliminary index additions & deletions membership lists posted to the FTSE Russell website after 6 PM US eastern time.

• Friday, June 10th & 17th – Preliminary membership lists (reflecting any updates) posted to the FTSE Russell website after 6 PM US eastern time.

• Monday, June 13 – “Lock-down” period begins with the updated membership lists published on June 17 considered to be final.

• Friday, June 24 – Russell Reconstitution is final after the close of the US equity markets.

• Monday, June 27 – Equity markets open with the newly reconstituted Russell US Indexes.


Take-Away

The annual reconstitution is a significant driver of dramatic shifts in some stock prices as portfolio managers have their needs shifted within a very short period of time. Longer-term demand for certain equities is altered as well. Sizable price movements and volatility are expected, especially around the last week in June. In fact, the opening day of the reconstitution is typically one of the highest trading-volume days of the year in the US equity markets.

The market event impacts more than $9 trillion of investor assets benchmarked to or invested in products based on the Russell US Indexes. Portfolio managers that are required to track one of these indexes will work to have minimal portfolio slippage away from their benchmark.  The days and weeks from May 6 through the end of June can create opportunities for investors seeking to benefit from price moves, Channelchek will be covering the event as stocks to be added to, or removed from this year’s Russell Reconstitution and other information plays out.

Be sure to register to receive Channelchek updates and information.

Paul Hoffman

Managing Editor, Channelchek


Suggested Content


Will Small Cap Stocks Outperform in 2022?


Small Caps are Bigger than Ever, Investors May Need to Adjust


Trump Media De-Spac in Face of Musk Twitter Purchase


No Punches Pulled at NobleCon18 Panel Discussion


Source

https://www.ftserussell.com/resources/russell-reconstitution


Stay up to date. Follow us:


What is the VIX?


What Does it Mean When the VIX (Fear Index) is Rising or Falling?


Volatility is how fast stock market prices change.

The VIX, or CBOE Volatility Index is designed to be a live mathematically-based representation of expectations for stock market volatility over the next 30 days. Some investors use the VIX to measure the level of risk, fear, and/or stress in the market when making investment decisions. In general, true traders prefer high volatility, whereas ost investors prefer more predictability.

Traders can also speculate on the direction of the VIX using a variety of options and exchange-traded products.


What Does the VIX Signal?

The VIX is designed to signal the level of fear or stress in the S&P 500. This is why it’s often called the “Fear Index.”  When the VIX level is rising, it is said that market related fear is rising. A level above 30 indicates a very high level of uncertainty and fear. VIX values below 20 generally point to stable, stress-free periods in the markets.


Where Does it Come From?

The index is derived from the prices of SPX index options with near-term expiration dates, from these short options there is a calculated 30-day forward projection of volatility. Volatility is seen as a way to gauge market sentiment, and in particular, the degree of fear among market participants.

The index was created by the Chicago Board Options Exchange (CBOE) and is maintained by CBOE Global Markets. It is an important index in the world of trading and investment because it provides a quantifiable measure of market risk and investors’ sentiments.


VIX vs. S&P 500 Price

Volatility value, investors’ fear, and VIX values all move up when the market is falling. The reverse is true when the market advances – the index values, fear, and volatility decline.

The price action of the S&P 500 and the VIX often shows inverse price action: when the S&P falls sharply, the VIX rises—and vice-versa.


How to Trade the VIX

The VIX has paved the way for using volatility as a tradable asset, albeit through derivative products. Cboe launched the first VIX-based exchange-traded futures contract in March 2004, followed by the launch of VIX options in February 2006.1


Suggested Reading


What is a Tender Offer?


What is Fed Tightening?


Stay up to date. Follow us: