One Way to Keep the Investor Focus Needed to Succeed When Markets Turn
Keeping a clear head while all around you are losing theirs is key to trading and investing. I have a habit that helps with focus that I learned from my years as a chief investment officer responsible for the success of several billion invested in the public markets. I’ll share this with you. As I combed through headlines this morning, all of them pushed doom and gloom, this can cause partial investor “blindness. I didn’t bother to turn on the TV as I’m certain the emotionally charged market pundits are doing all they can to keep viewers engaged. They do this by emphasizing things that create fear.
Fear sells, and selling benefits their shareholders whether or not the information helps your investment decision-making or not. And making decisions to grow and protect your money is the essence of successful investment management.
Where You Could Look Instead
I mentioned I didn’t turn on the TV this morning. For me, much of the TV market news are shows designed to keep you tuned in all day. They do this with emotional broadcasts and “breaking news” stories. It makes sense for them, they sell advertising, and the industry increases revenue by building viewership. But I admit I did tune in yesterday to watch my friend Eddie Ghabour, the author of The Commonsense Bull to see what he had to say. To his credit, Eddie owned Apple (APPL) and other tech stocks when everyone else thought they had no more room to run. To me, his is the voice of calculated reason. The two were discussing the comments Fed Chair Jay Powell made at a Wall Street Journal event concerning their resolve to fight inflation. I was surprised to hear the self-described commonsense bull stoking fear by saying, we’re in the “largest bubble of our lifetime,” and it’s going to burst as the Federal Reserve is “going to suck liquidity out of the system.” Whether this comes true or not, immersing oneself in this kind of talk will begin to prevent you from uncovering opportunities. And in every situation, there are opportunities.
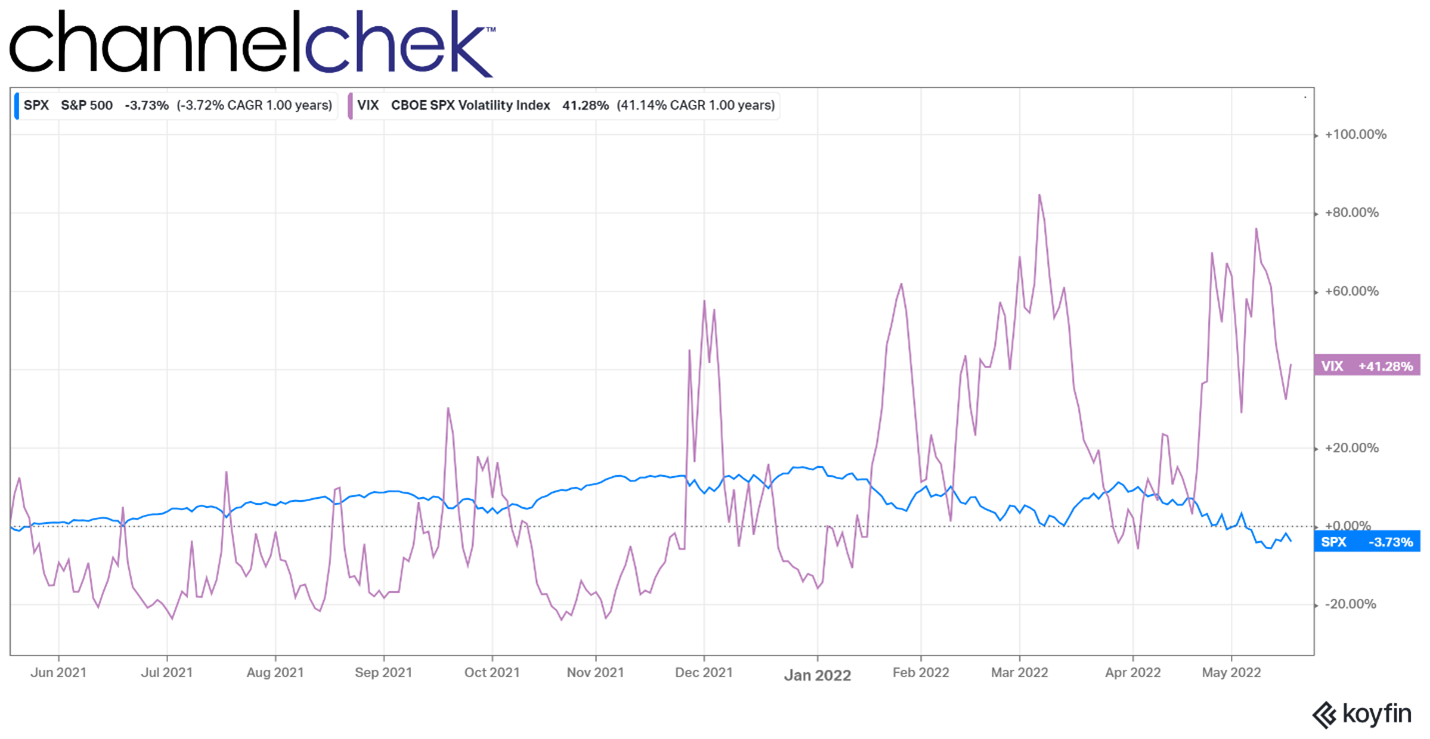
It may seem obvious to say that data is unemotional. But it is less likely to create the kind of bias that prevents an investor from seeing what could be when viewed in black and white. Whether it’s TV journalists or professional headline writers, there’s a bias in reporting, a bias that is absent in raw numbers, and when done right, absent in genuine investment research.
Fortunately, we now all have systems, software, platforms, and computers to sort through technical data. We can learn quickly what stocks are trading counter to the market, what’s trading up on volume, what’s moving above its 50-day average, etc. These are the kind of things I like to look at, finding what’s strong when everyone else is talking about the world falling apart. Then I make sure its normal performance isn’t a natural mirror image, in other words, it isn’t likely to go negative when the market turns positive. An example would be bond ETFs going up when stocks go down. Looking for companies that are strong and may have gained even more on a positive day is built in to most platforms and can isolate, without emotion, candidates to review while everyone else is being told we are doomed.
May 18, 2022, for Example
Within Channelchek there is a section to the left of the screen called Movers and Shakers. On a real-time basis, it filters through the 6000+ small and microcap stocks on Channelchek and provides users with those that have the largest gains, largest losses, and relatively most active. On this big down day, I wanted to see what was holding up and if they were all centered around a specific industry. It turns out there was no industry preference, but there was a long list of companies up 7% or more while the market was down over 4%.
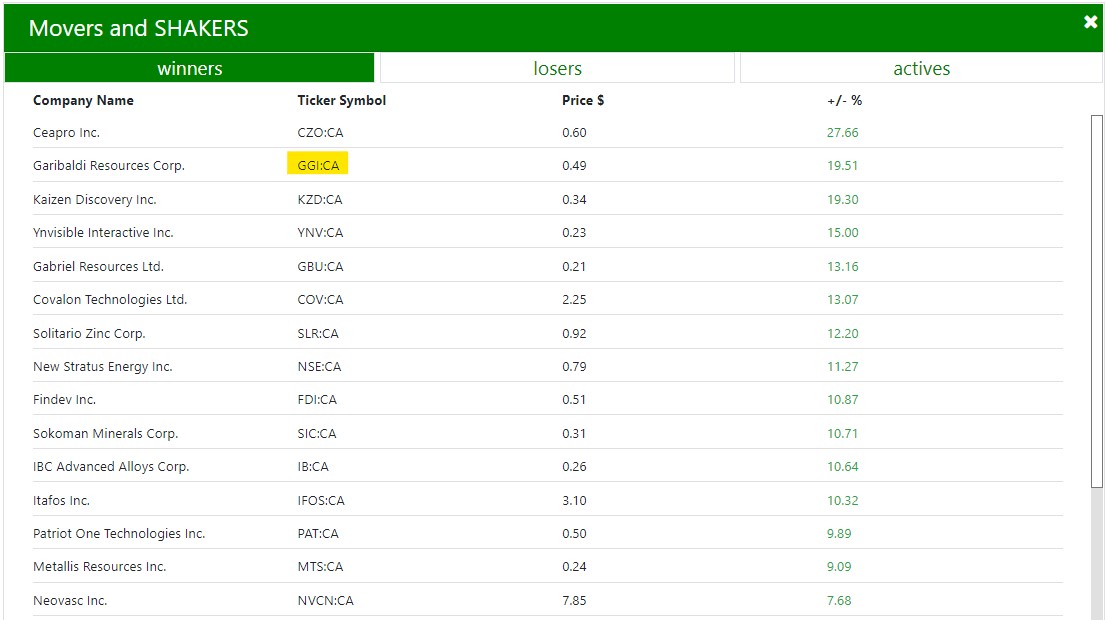
Screenshot of Channelchek Movers and Shakers after close
May 18, 2022
From the quick list, I started with names I am most familiar with. In fact, I had just gotten research in my email on Garibaldi Resources (GGI:CA, GGIFF). As an added plus I am not opposed to increasing my exposure to gold.
Then I looked at the most recent, decidedly unemotional, third-party research on this company. It stands to reason that letting a FINRA licensed analyst that specialized in the industry and knows the company through-and-through, is the best person to kick the tires and show what they are expecting.
Using this one company as an example: Garibaldi is a gold mining company that just released very positive exploratory results on one of their mines. The indepth report explained that out of nine holes drilled to test for gold mineralization, eight came back with positive results. This could explain the strength of this stock, particularly in the gold sector which also outperformed on this day.
As a side note, I found it interesting that on a day that the U.S. markets were falling, all the overperforming stocks were listed (some co-listed) on a Canadian exchange. This isn’t insight you’re likely to get on CNBC or Fox Business News.

Sidelines
Money in the market should continually be swapped out for better opportunities, this is an especially good practice with tax-deferred accounts like IRAs. Money on the sidelines, when inflation is running above 8%, is losing a lot of buying power. While dry-powder is helpful to have on-hand when you think the market has hit bottom, keep in mind that money is always moving someplace. And there are many companies with performance not-correlated to the companies that are driving index averages.
Take-Away
Sell-offs will always cause scary headlines and fearful hype from newscasters and publications. Individual and professional investors alike can lose focus when surrounded by doom and gloom forecasts. One way around this is reviewing mostly data and reading full stories from the more reputable sources, also look for quality research. Market research and equity research — if done right it is devoid of emotion.
The example above is simple and basic, using only one tool to see where money is flowing to, rather than allowing myself to be bombarded with where it is flowing from. To be sure your brokerage account has an array of very sophisticated tools to bring ideas to the surface.
Register for Channelchek to receive equity research in your inbox before the opening bell each day.
Paul Hoffman
Managing Editor, Channelchek
Suggested Content
Stay up to date. Follow us: