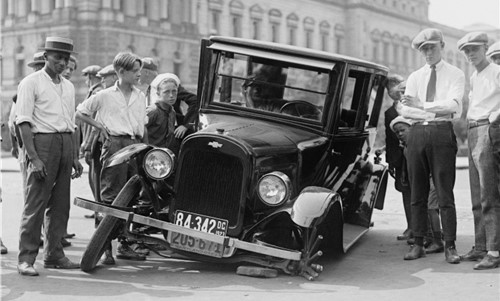
Image Credit: Pixabay (Pexels)
Previous Stock Market Crashes Can Teach Us When to Slow Down and When to Speed Up
A significant and usually abrupt decline in the value of the broader stock market is referred to as a stock market crash. There is no standard definition that uses measurements such as a decline over time ratio, or percentage decline from the most recent high. But like most crashes, you don’t see it coming until it is nearly unavoidable. The word capitulation is sometimes used; this refers to the main ingredient of most crashes, panic-selling by investors who want to stop experiencing new losses. Understanding what happened in the past could help to make investors more likely to recognize any trouble in the road ahead.
A stock market crash is usually quicker than the recovery from the setback. Recovery, historically, has taken months in some cases and over a decade in others.
Crash Math
Here is some crash math that stock market investors should know.
The percentage you will need after your stock sinks to return to the same level is a higher percentage than the percent the stock declined. For some, this may seem basic, but I know for others, it takes a bit to wrap your head around.
This could help with understanding why. A portfolio loss is based on a higher amount, and the recovery is based on a lower amount. If your portfolio is valued at $10,000 and it drops 50%, it is now worth $5,000. A 50% gain on $5,000 will only add $2,500 to your value. The underlying stocks in the portfolio will have to recover 100% for the portfolio to be made whole on its 50% decline.
Recognized Crashes
Here is a quick understanding of some of U.S. history’s most notable crashes.
1929 – The stock market crash that is tied to the Great Depression is considered to be the worst stock crash in history. It began in 1929 after a long period of expansion (roaring twenties). During the twenties, the economy expanded significantly and the stock market boomed.
The 30 stocks in the Dow Jones Industrials rose from 63 points in August 1921, to 381 points by September 1929. The Dow started to descend from its peak on Sept. 3 and continued through the month and into October. On October 28 and October 29, the fall accelerated. The market on the 28th, Black Monday, fell 13%. It went down by another 12% on Tuesday.
By mid-November, 1929, the Dow had lost about half its value. The Dow continued to slide until the summer of 1932. The Dow Industrials bottomed out at 41 points or 89% below its peak. It then took 22 years to regain its pre-crash value.
A primary factor leading to the 1929 stock market crash was excessive leverage. Many individual investors and investment trusts had become comfortable buying stocks on margin and more fully benefitting from the growth of the market. For those using leverage, it meant they paid only 10% of the value of a stock to acquire it under the terms of a loan agreement. Consumers had also become accustomed to using debt to make purchases. When the late 20s debt bubble burst, it exacerbated the most famous stock market and economic crash in history.
1987 – On a different Black Monday in the late 1980s the Dow Jones Industrial Average plunged by nearly 22%. Black Monday, as the day is now known, marks the biggest single-day decline in stock market history. It occurred on October 18, but the remainder of the month was also quite weak. By the start of November 1987, most of the major stock market indexes had lost more than 20% of their value.
There is no single event that caused the stock market to crash in 1987. There were some warning signs of excesses, economic growth had slowed, inflation was ticking up, and a strong dollar was hurting U.S. exports. Stock valuations had reached excessive levels, with the overall market’s price-earnings ratio above 20 while future estimates for earnings were trending lower. These are enough signs that something had to give way.
Computerized trading was growing at this time, and this was known to have created wider daily swings in prices than people had been accustomed to. Whether deserved or not, many accounts say program trading was the primary cause of this event.
Since there was no pervasive economic problem that caused the October 1987 route, market participants soon came back and drove prices higher in November. The market reached its pre-crash level two years later in September 1989.
1999/2000 – The values of internet-based stocks rose significantly through the 1990s. This caused technology-dominated Nasdaq to rise from 1,000 points in 1995 to more than 5,000 in 2000. After some concern surrounding getting past Y2K without a computer glitch, in early 2001, the dot-com bubble began to burst. Nasdaq peaked at 5,048.62 points on March 10. The index kept falling throughout the following months until it reached 1,139.90, or 76.81% lower by Oct. 4, 2002.
The explanation for this crash was overvalued internet stocks. It seemed as though everyone suddenly became an investor and had advice on internet stocks. Investors, including first-timers, speculated that dot-com companies, even those without revenues, would all one day become extremely profitable. As a result, they poured money into the sector, including fledgling fund companies which made it easier to be an investor. This bubble burst when the Federal Reserve tightened its monetary policy. The Nasdaq later took 15 years to regain its peak.
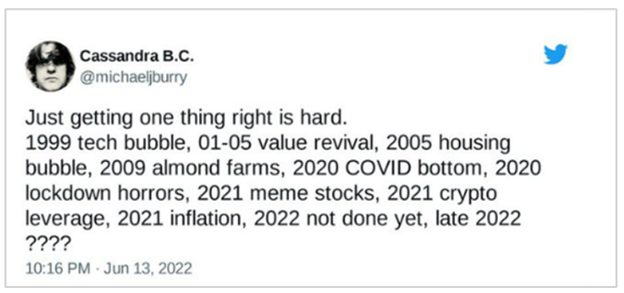
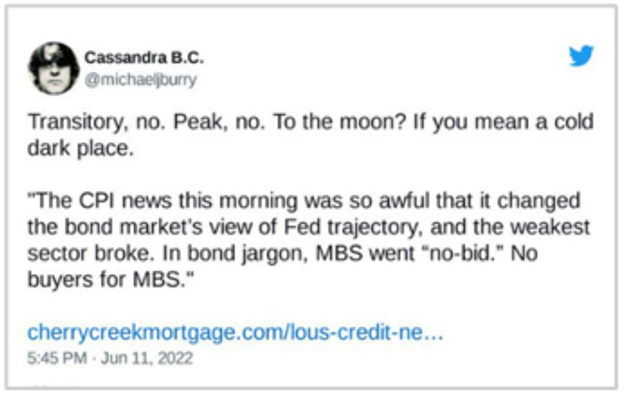
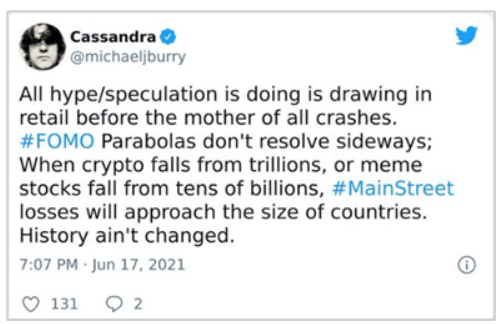
2008 – Have you read the book or seen the movie “The Big Short?” Author Michel Lewis did a great job explaining the mortgage bust and its ties to the stock market crash. Here it is, in four paragraphs, and with no mention of someone I follow, Dr. Michael Burry.
The U.S. government during 1999, thought it could make houses more accessible to those with low credit ratings and less money to spend on down payments than lenders typically required. Using agencies chartered by Congress, such as Federal National Mortgage Association (FNMA/Fannie Mae) these would-be homeowners, or subprime borrowers, as they were called, were offered mortgages with payment terms, such as higher interest rates, balloon maturities, and other variable payment schedules, that served to get them in the door.
In economics, nothing happens in a vacuum, and increased mortgage availability causes an increased demand for homes by both previously ineligible borrowers and investors. This created bubble-level growth in mortgage originations and home sales. The demand for homes drove up home values which consumers used to take out second mortgages to upgrade their lives with the equity available in their property.
In corporate America, companies looking to capitalize on opportunities available by a growing economy also took on additional debt. Financial institutions, similarly, used cheap borrowings as leverage to double down on growing lines of business. One of these growing lines was consumer lending.
The easy mortgage money and borrowing on abundant equity caused many assets, including stocks, to rise. But the subprime mortgages were quietly becoming delinquent. And much of this debt was reengineered into SEC-registered securities so that investors could invest in the growing debt. Then things that had been going sour for a little while began impacting large Wall Street firms. The news came out that Bear Stearns could not cover its losses linked to subprime mortgages – still, stocks rose, reaching a high on October 9, 2007; almost a year later, in September of 2008, the major stock indexes had slid nearly 20%. The Dow Industrials reached its lowest point, which was 54% below its peak, on March 6, 2009.
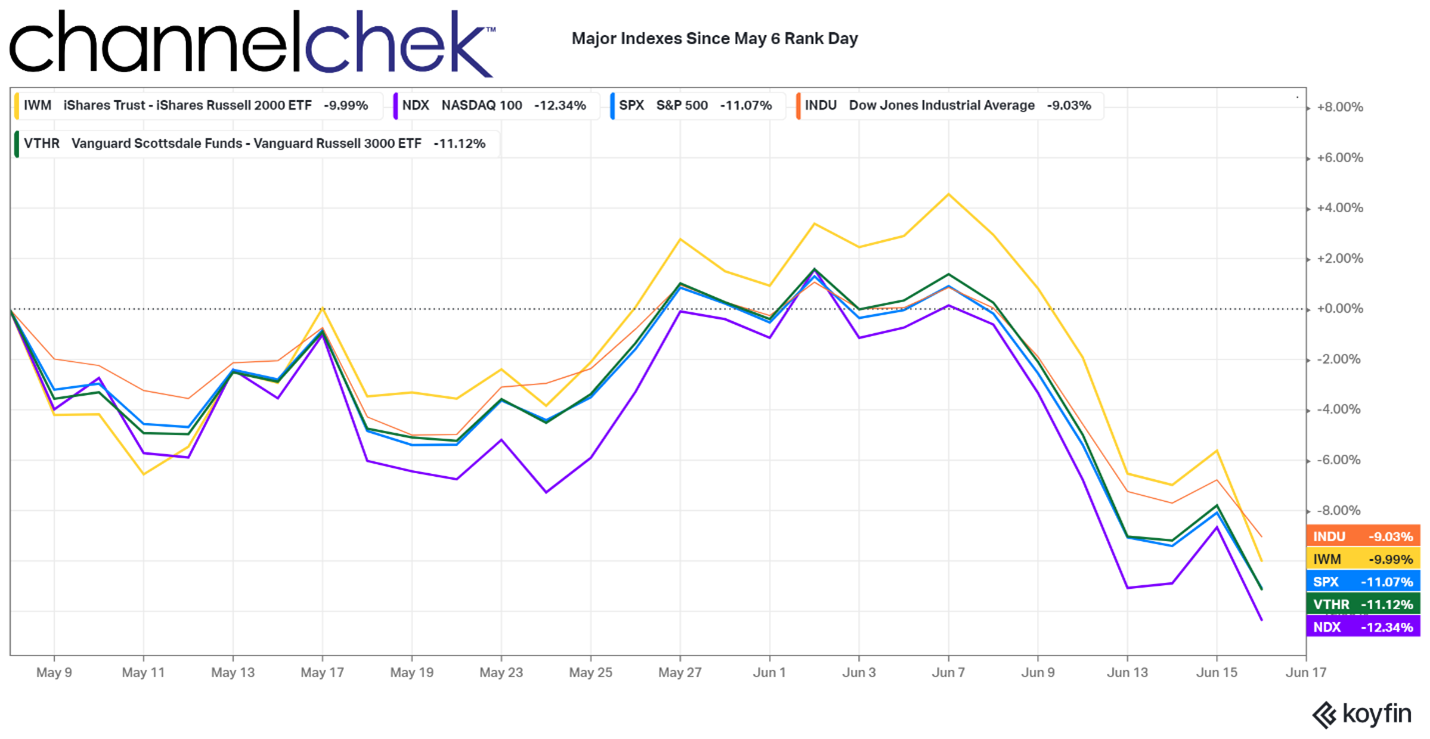
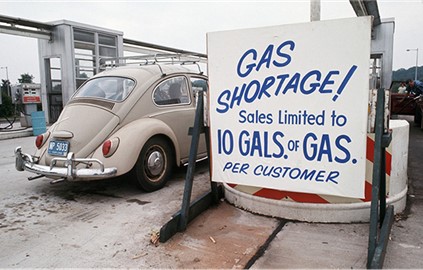
2020 – A health concern that led to “shutting down global economies” caused a dramatic stock market crash earlier this decade. During the week of February 24, 2020, the Dow Jones and S&P 500 tumbled 11% and 12%, respectively, marking the biggest weekly declines to occur since the financial crisis of 2008. On March 12, the Dow Industrials declined by 9.99%, its largest one-day drop since Black Monday of 1987. Then it managed to replace its second-worst day with an even deeper 16% plunge on March 16.
The recovery from this crash was quick. The stock market rebounded back to its pre-pandemic peak by May of 2020. It’s widely viewed that credit for the rapid recovery can be given to an enormous amount of stimulus money, with the Federal Reserve slashing interest rates and injecting $1.5 trillion into markets and Congress passing a $2.2 trillion aid package at the end of March. The quickness to support the economy also served to buoy the stock market.
Take Away
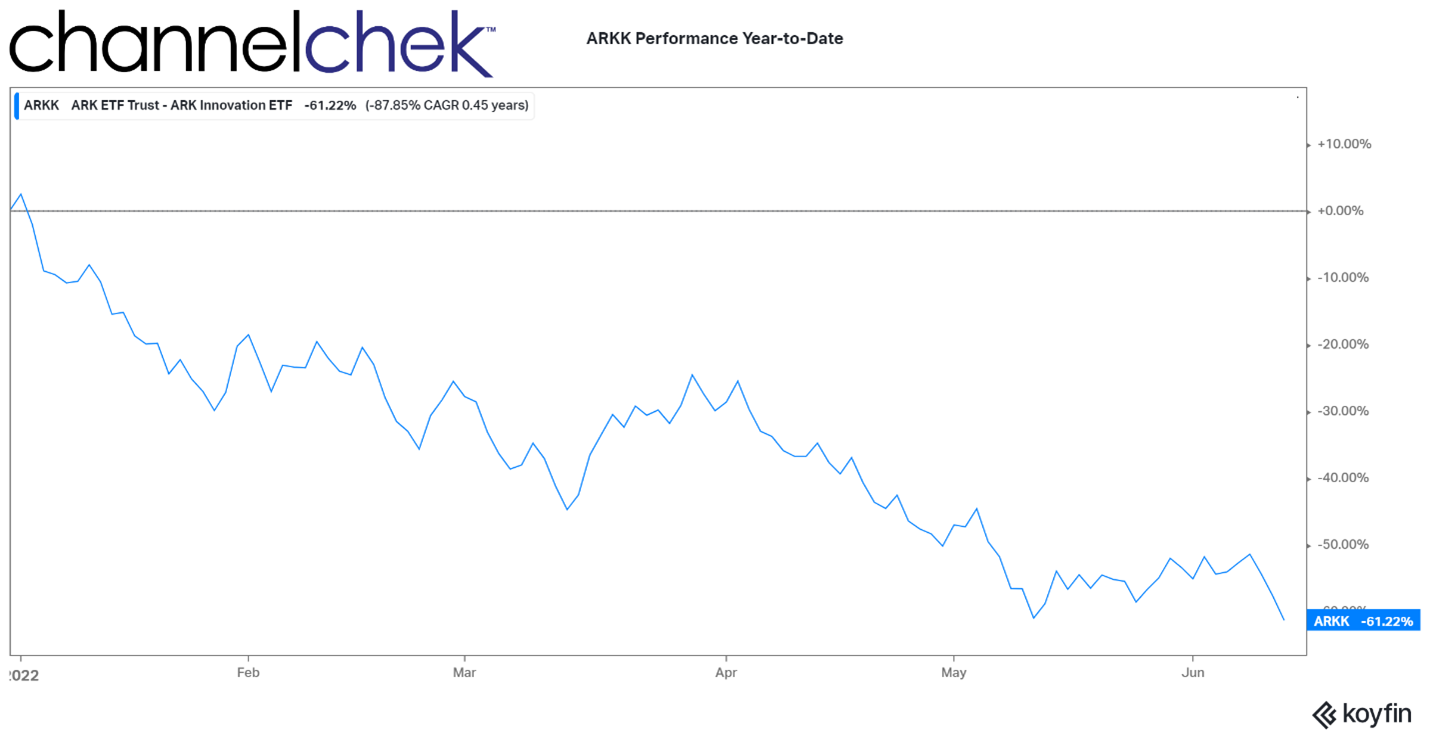
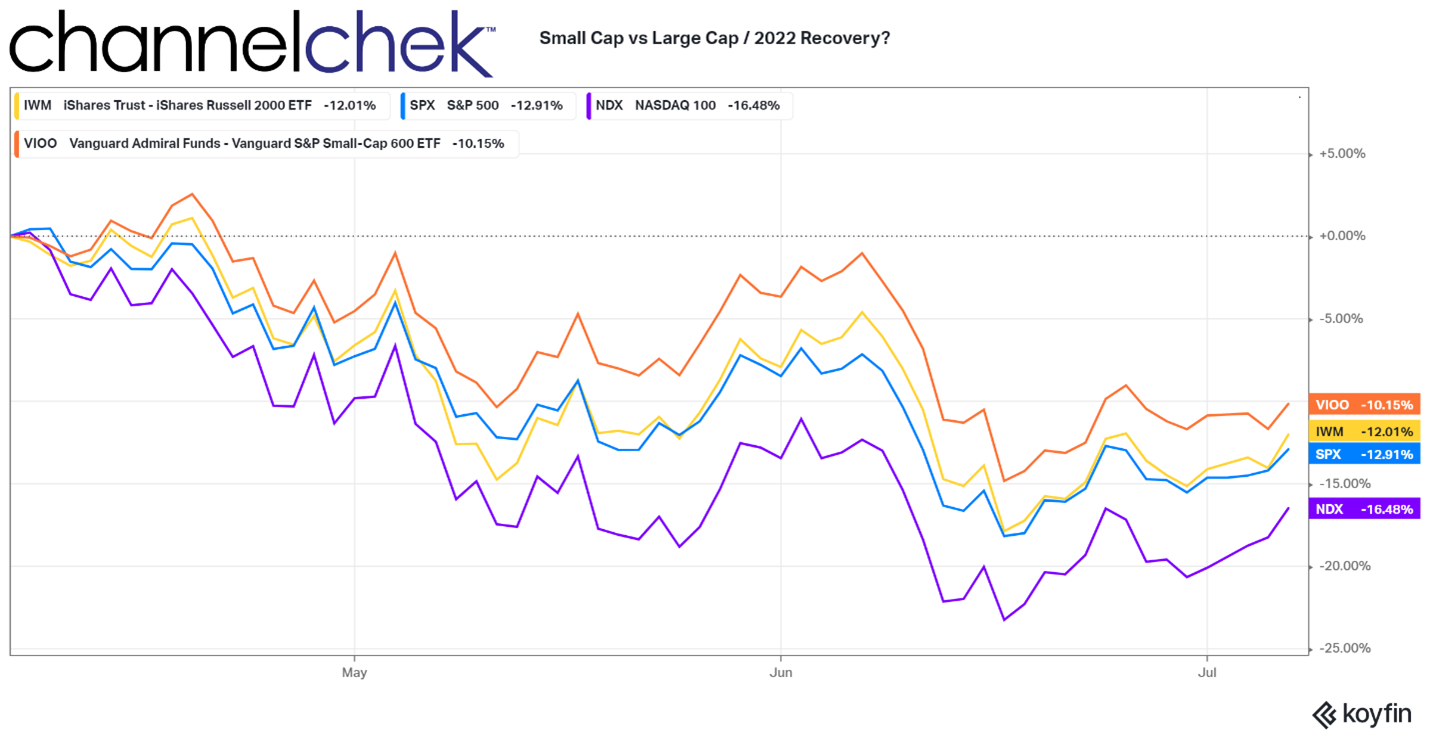
Valid arguments can be made in favor of stocks rallying after a six-month organized decline to down 20%-25%, and a case can be made that what we have experienced foretells accelerating problems. Many ingredients exist that could favor either argument.
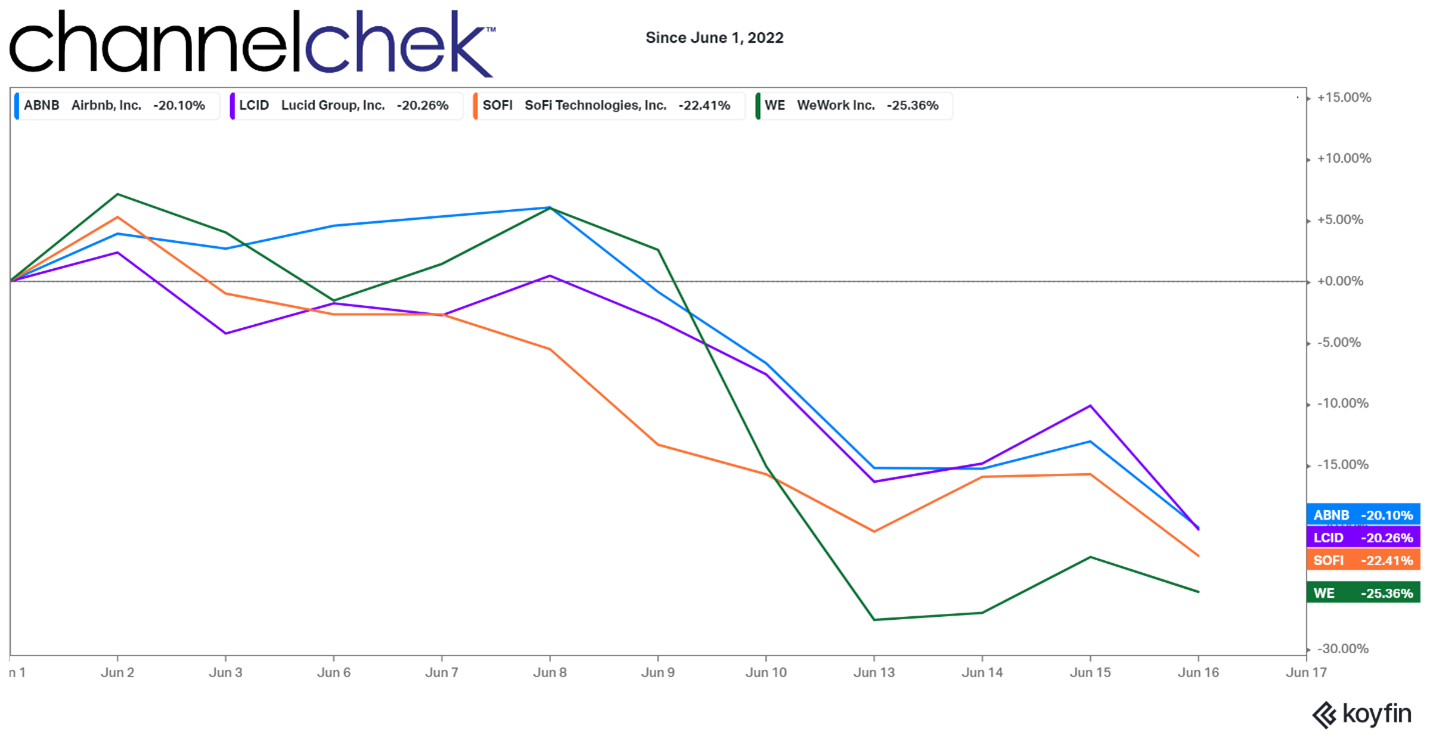
What is important to come away with is that within markets, when stock indexes are up, there is a high percentage of stocks that are moving down. And When indexes are down, there are many stocks still climbing and doing well. Stock selection is an important determinant of investing success.
To keep up with industries both weak and strong and what top analysts are saying about many companies with high potential to either grow or slide,
sign-up for Channelchek and stay informed.
Managing Editor, Channelchek
Suggested Content
 Is Michael Burry Frustrated that the Market Hasn’t Yet Crashed?
|
 When the History of Bitcoin is Written, This Story Will be in the Book
|
 America’s Computing Industry was Kick-Started 125 Years Ago
|
 Bear Market Cycles, is it Different This Time?
|
Sources
https://www.federalreserve.gov/pubs/feds/2007/200713/200713pap.pdf
https://goodreads.com/book/show/26889576-the-big-short
Stay up to date. Follow us:

|


 Let’s discuss the author’s credentials. No one had ever heard of Satoshi Nakamoto when it was published. Even today, no one can identify this person. It is unknown whether the theory was created by a group of people, one person, or even a government entity. It is a mystery that remains unsolved. Does that sound like something worth investing $1,000 or more in?