The Fed Chair’s Comments May be the Most Critical Market Event of the Week
It’s a quiet week for economic data. If the market takes a direction this week, it may have to take its lead from something other than statistics that indicate economic strength or weakness. This could be a Fed governor speaking, or a central bank outside of the US altering its hawkish stance.
Monday 2/6
With no consequential economic releases, market direction may take its tone from earnings reports from a wide swath of industries.
Tuesday 2/7
11:00 AM ET, New York Federal Reserve inflation expectations.
3:00 PM ET, Consumer Credit, or more definitively, the installment credit outstanding by consumers is expected to have increased by $25 billion in December versus November’s $27.9 billion increase. There is such a long delay reporting this number that it seldom has a market impact.
Fed Chair Jerome Powell will be speaking at the Economic Club of Washington.
Wednesday 2/8
10:00 AM ET, Wholesale Inventories revision for December is in line with the first estimate of 1%. Wholesale sales and inventory data can provide investors a chance to look below the surface of the consumer economy. Activity at the wholesale level can then be a precursor of consumer trends.
Thursday 2/9
8:30 AM ET, Jobless Claims, including Initial Claims and Continuing Claims, have been a big focus of the market as unemployment is running at a historically low pace. The consensus is for growth in Jobless levels to 190,000 versus 183,000 the prior week. Overall low claims would seem to be good news for the economy. The problem now is that it is except that it is worrisome for a Fed that views current inflationary pressures, including wage pressures unacceptably high.
Friday 2/10
• 10:00 AM ET, The University of Michigan’s Consumer Survey Center questions households each month on their assessment of current conditions and expectations of future conditions. Consumer sentiment is not expected to show much improvement, at a consensus 65.0 in the first reading for February versus 64.9 in January.
What Else
The FOMC meeting that ended on February 1 was the last before Chair Powell delivers the semiannual monetary policy testimony in late February or early March (not yet set). Any remarks by Fed officials in the February 6 week should be viewed in that context. Powell and associates will not want to confuse any upcoming message given at the semiannual Monetary Policy Report to Congress. Whatever is said is likely to foreshadow what will be in the report when he speaks before the Senate Banking Committee and the House Financial Services Committee.
How Legalized Sports Betting has Transformed the Fan Experience
A couple of days before Christmas, I went to see the NHL’s Nashville Predators play on their home ice against the defending Stanley Cup champion Colorado Avalanche.
Amid all the silliness of a modern pro sports experience – the home team skating out of a giant saber-toothed tiger head, the mistletoe kiss cam, a small rock band playing seasonal hits between periods – there was a steady stream of advertising for DraftKings, a company known as a sportsbook that takes bets on athletic events and pays out winnings.
This article was republished with permission from The Conversation, a news site dedicated to sharing ideas from academic experts. It represents the research-based findings and thoughts of John Affleck, Knight Chair in Sports Journalism and Society, Penn State.
Its name flashed prominently on the Jumbotron above center ice as starting lineups were announced. Its logo appeared again when crews scurried out to clean the ice during timeouts. Not only was “DraftKings Sportsbook” on the yellow jackets worn by the people shoveling up the ice shavings, it was also on the carts they used to collect the ice.
This all came a few days after the Predators announced a multiyear partnership with another sportsbook, BetMGM, that will include not only signage at their home venue, Bridgestone Arena, but also a BetMGM restaurant and bar.
If I had cared to that evening, I could have gone onto the sports betting app on my smartphone and placed a wager on the game. Tennessee is one of 33 states plus the District of Columbia where sports betting is legal. On Jan. 31, 2023, Massachusetts became the latest state to legalize the practice.
The point of depicting the whole scene is simply this: In the nearly five years since the Supreme Court allowed states to legalize sports betting, a whole industry has sprouted up that, for tens of millions of fans around the country, is now just part of the show.
Betting’s seamless integration into American sports – impossible to ignore even among fans who aren’t wagering – represents a remarkable shift for an activity that was banned in much of the country only a few years ago.
A New Sports World
Let’s look at the numbers for a start.
Since May 2018, when the U.S. Supreme Court overturned a law that limited sports betting to four states including Nevada, US$180.2 billion has been legally wagered on sports, according to the American Gaming Association’s research arm. That has generated $13.7 billion in revenue for the sportsbooks, according to figures provided to me by the AGA, the industry’s research and lobby group.
Before the NFL kicked off last September, the AGA reported that 18% of American adults – more than 46 million people – planned to make a bet this season. Most of that was likely to be bet through legal channels, as opposed to so-called corner bookies, or illegal operatives.
So, who’s betting on sports? In an interview, David Forman, the AGA’s vice president for research, told me that compared with traditional gamblers – those who might play slots, for instance – “sports bettors are a different demographic. They’re younger, they’re more male, they’re also higher income.”
They’re people like Christian Santosuosso, a 26-year-old creative marketing professional living in Brooklyn, New York. Santosuosso didn’t bet on games until it became legal. Now he and his buddies will pool their money on an NFL Sunday to spice up both the interest in a game and the conversation in the room.
“It’s entertainment,” he told me in a phone interview. He explained that even a tough gambling loss can be amusing or funny, a way to look back on the mistakes your team made that ended up affecting whether you won the bet. But he added that he has a limit on how much he’ll bet.
Coverage and Conversation
Shortly after Supreme Court ruling in 2018, I wrote a piece for The Conversation asking if the media would start to produce content aimed at bettors.
The answer has been an unequivocal “yes” – and it seems to have helped change the way sports betting is talked about.
As I write this, if I look at the front page of ESPN.com, I see that the University of Georgia is a 13.5-point favorite over Texas Christian University in the college football national championship. It’s front and center, right next to the kickoff time and the TV network where it’s airing.
But that’s the least of it.
ESPN has broadcast a gaming show since 2019, “Daily Wager.” In September 2022, the sports conglomerate announced an array of new content centered on betting advice and picks. And SportsCenter anchor Scott Van Pelt is famous for his “Bad Beats” segment, in which Van Pelt typically highlights how a team on the winning side of the point spread falls apart at the last second in a crazy way.
Meanwhile, a cottage industry of betting tip channels has emerged on YouTube – if you type “#sportsbetting” into YouTube’s search bar, you’ll find thousands of them.
Another example of how things have changed: On Jan. 2, 2023, the University of Utah’s football team had the ball first and goal with 43 seconds left, down 21 points to Penn State in the Rose Bowl. The game was essentially over. However, the commentators noted that a touchdown would mean a lot to some people.
Who? Why? The announcers didn’t elaborate, but the implication was obvious: Those who had bet the over – wagering that together the two teams would score more than 54 points – had a lot riding on that touchdown. So, in a sense, did ESPN. In a blowout, fans of both teams are likely to tune out. But when there’s money riding on something like the over, eyes stay glued to the screen.
Utah ended up scoring on third down with 25 seconds remaining. Final score: Penn State 35, Utah 21.
The Danger and the Ceiling
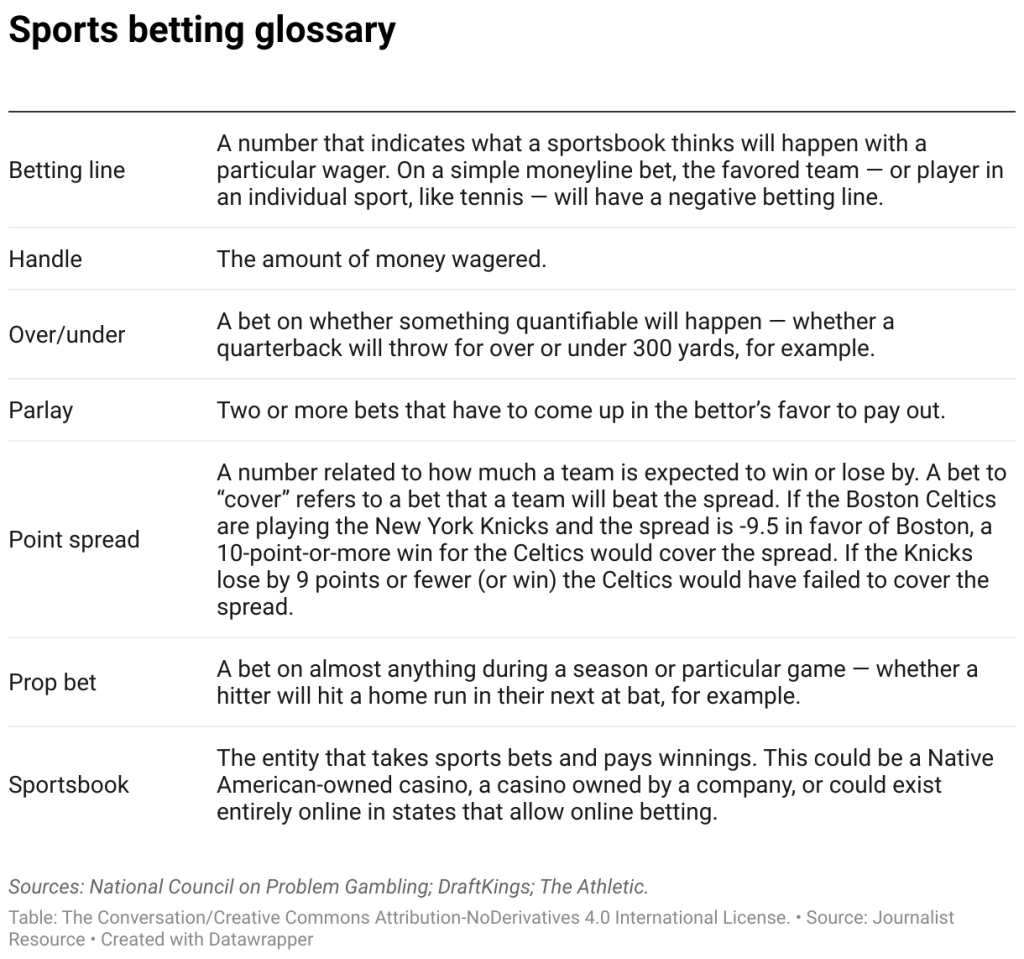
I’ve been editing sports articles since the early 1990s and have run the sports journalism program at Penn State since 2013. I have noticed how my students now routinely talk about the point spread – the expected margin of victory – and even the over-under, a wager on the total number of points scored.
That just did not happen so often when I first got to State College, nor in the newsroom before that.
Sports leagues were once vehemently opposed to gambling. And while they’re still concerned about keeping players from betting, many leagues – particularly the NFL – have made a complete U-turn since legalization.
There are multiple reasons for this change of heart. While the concern used to be about losing the integrity of the game to a betting scandal, now sports leagues can argue that legal betting allows for better monitoring of potential cheating. If heavy betting happens on one team, or if there’s sudden shift in betting patterns, it’s all visible to the sportsbooks and might indicate nefarious activity.
There’s also significant fan interest in legal wagering – 56% of Americans adults, and nearly 7 in 10 men, recently told Pew that they’ve read at least a little about how widespread legal sports betting has become.
And, of course, there is big money from a new sponsorship group – the sportsbooks – that helped drive overall NFL sponsorship revenue to a record $1.8 billion in the 2021 season.
The danger, of course, is gambling addiction.
And while the AGA is quick to note that its member companies pledge to give information about problem gambling to their customers, legalization has undoubtedly provided easier and more secure access to sports betting.
Keith Whyte, executive director of the National Council on Problem Gambling, said in a telephone interview that research by his group had found that roughly 25% of American adults bet on sports, somewhat more than the AGA’s estimate. That percentage has jumped from roughly 15% before the Supreme Court ruling, per the NCPG.
While that’s a big increase, it also suggests that perhaps there is a ceiling coming up – in other words, when all the states that will do so legalize sports betting, wagering still won’t be done by many more people than now, Whyte speculated.
“I think it’s changing the market in a lot of ways,” Whyte said, “but my guess is it’s mainly to increase the intensity – and associated risk of problem gambling – among fans that were already engaged fans.”
Prepared remarks via webcast on February 15, 2023 at 4:30 PM ET
RICHMOND, Va.–(BUSINESS WIRE)– Bowlero Corp. (NYSE: BOWL) (“Bowlero” or the “Company”), the world’s largest owner and operator of bowling centers, will report financial results for the second quarter of fiscal 2023 on Wednesday, February 15, 2023 after the U.S. stock market closes. Management will discuss the results via webcast at 4:30 PM ET on the same day.
The live webcast, replay and results presentation will be available in the Events & Presentations section of the Bowlero Investor Relations website at https://ir.bowlerocorp.com/overview/default.aspx.
About Bowlero Corp.
Bowlero Corp. is the worldwide leader in bowling entertainment. With more than 325 bowling centers across North America, Bowlero Corp. serves nearly 30 million guests each year through a family of brands that includes Bowlero and AMF. Bowlero Corp. is also home to the Professional Bowlers Association, which boasts thousands of members and millions of fans across the globe. For more information on Bowlero Corp., please visit BowleroCorp.com.
SANTA MONICA, Calif.–(BUSINESS WIRE)– Entravision (NYSE: EVC), a leading global advertising solutions, media and technology company, today announced that its Board of Directors approved a quarterly cash dividend to shareholders of $0.05 per share of the Company’s Class A, Class B and Class U common stock. This reflects a doubling of its previous quarterly dividend of $0.025 in 2022 and returns the dividend to its pre-pandemic level. The Company anticipates an aggregate payout amount of approximately $4.4 million.
This quarterly dividend is payable on March 31, 2023 to shareholders of record as of the close of business on March 16, 2023, and the common stock will trade ex-dividend on March 15, 2023. The Company currently anticipates that future cash dividends will be paid on a quarterly basis; however, any decision to pay future cash dividends will be subject to approval by the Board.
“We are pleased to increase our quarterly cash dividend, which represents the 41st consecutive dividend we have paid to our shareholders over the past 13 years,” said Chris Young, Interim Chief Executive Officer, and Chief Financial Officer & Treasurer. “Increasing our dividend reflects the strength of our cash position and our Board’s confidence in our ability to drive sustainable profitable growth. We will continue to execute on our balanced capital allocation strategy, including deploying capital to investments that will fuel our growth.”
About Entravision
Entravision is a leading global advertising solutions, media and technology company connecting brands to consumers by representing top platforms and publishers. Our dynamic portfolio includes digital, television and audio offerings. Digital, our largest revenue segment, comprises four business units: our digital sales representation business; Smadex, our programmatic ad purchasing platform; our branding and mobile performance solutions business; and our digital audio business. Through our digital sales representation business, we connect global media companies such as Meta, Twitter, TikTok and Spotify with advertisers in primarily emerging growth markets worldwide. Smadex is our mobile-first demand side platform, enabling advertisers to execute performance campaigns using machine learning. We also offer a branding and mobile performance solutions business, which provides managed services to advertisers looking to connect with global consumers, primarily on mobile devices, and our digital audio business provides digital audio advertising solutions for advertisers in the Americas. In addition to digital, Entravision has 49 television stations and is the largest affiliate group of the Univision and UniMás television networks. Entravision also manages 45 primarily Spanish-language radio stations that feature nationally recognized, Emmy award-winning talent. Shares of Entravision Class A Common Stock trade on the NYSE under ticker: EVC. Learn more about our offerings at entravision.com or connect with us on LinkedIn.
Forward-Looking Statements
This press release contains certain forward-looking statements. These forward-looking statements, which are included in accordance with the safe harbor provisions of the Private Securities Litigation Reform Act of 1995, may involve known and unknown risks, uncertainties and other factors that may cause the Company’s actual results and performance in future periods to be materially different from any future results or performance suggested by the forward-looking statements in this press release. Although the Company believes the expectations reflected in such forward-looking statements are based upon reasonable assumptions, it can give no assurance that actual results will not differ materially from these expectations, and the Company disclaims any duty to update any forward-looking statements made by the Company. From time to time, these risks, uncertainties and other factors are discussed in the Company’s filings with the Securities and Exchange Commission.
Entravision Investors: Christopher T. Young Interim Chief Executive Officer / Chief Financial Officer & Treasurer 310-447-3870
LAKE ZURICH, Ill.–(BUSINESS WIRE)– ACCO Brands Corporation (NYSE: ACCO) today announced that it will release its fourth quarter and full year 2022 earnings after the market close on February 23, 2023. The Company will host a conference call and webcast to discuss the results on February 24 at 8:30 a.m. EST. The webcast can be accessed through the Investor Relations section of www.accobrands.com and will be available for replay.
About ACCO Brands Corporation
ACCO Brands, the Home of Great Brands Built by Great People, designs, manufactures and markets consumer and end-user products that help people work, learn, play and thrive. Our widely recognized brands include AT-A-GLANCE®, Five Star®, Kensington®, Leitz®, Mead®, PowerA®, Swingline®, Tilibra® and many others. More information about ACCO Brands Corporation (NYSE: ACCO) can be found at www.accobrands.com.
Christopher McGinnis Investor Relations (847) 796-4320
CHATHAM, N.J., Feb. 03, 2023 (GLOBE NEWSWIRE) — Tonix Pharmaceuticals Holding Corp. (Nasdaq: TNXP) (Tonix or the Company), a clinical-stage biopharmaceutical company, today announced that Seth Lederman, M.D., President and Chief Executive Officer of Tonix Pharmaceuticals, will participate virtually in the BIO CEO & Investor Conference, which is being held February 6-9, 2023.
The Company’s pre-recorded presentation will be made available during the conference to registered conference participants through the BIO CEO & Investor Conference website at https://www.bio.org/events/bio-ceo-investor-conference/sessions. Beginning February 9, 2023, the presentation will also be available under the IR Events tab of the Investors section of the Tonix website at www.tonixpharma.com.
Tonix Pharmaceuticals Holding Corp.*
Tonix is a clinical-stage biopharmaceutical company focused on discovering, licensing, acquiring and developing therapeutics to treat and prevent human disease and alleviate suffering. Tonix’s portfolio is composed of central nervous system (CNS), rare disease, immunology and infectious disease product candidates. Tonix’s CNS portfolio includes both small molecules and biologics to treat pain, neurologic, psychiatric and addiction conditions. Tonix’s lead CNS candidate, TNX-102 SL (cyclobenzaprine HCl sublingual tablet), is in mid-Phase 3 development for the management of fibromyalgia with a new Phase 3 study launched in the second quarter of 2022 and interim data expected in the second quarter of 2023. TNX-102 SL is also being developed to treat Long COVID, a chronic post-acute COVID-19 condition. Tonix initiated a Phase 2 study in Long COVID in the third quarter of 2022. TNX-1300 (cocaine esterase) is a biologic designed to treat cocaine intoxication and has been granted Breakthrough Therapy designation by the FDA. A Phase 2 study of TNX-1300 is expected to be initiated in the second quarter of 2023. TNX-1900 (intranasal potentiated oxytocin), a small molecule in development for chronic migraine, is expected to enter the clinic with a Phase 2 study in the first quarter of 2023. TNX-601 ER (tianeptine hemioxalate extended-release tablets) is a once-daily formulation of tianeptine being developed as a potential treatment for major depressive disorder (MDD) with a Phase 2 study expected to be initiated in the first quarter of 2023. Tonix’s rare disease portfolio includes TNX-2900 (intranasal potentiated oxytocin) for the treatment of Prader-Willi syndrome. TNX-2900 has been granted Orphan Drug designation by the FDA. Tonix’s immunology portfolio includes biologics to address organ transplant rejection, autoimmunity and cancer, including TNX-1500, which is a humanized monoclonal antibody targeting CD40-ligand (CD40L or CD154) being developed for the prevention of allograft and xenograft rejection and for the treatment of autoimmune diseases. A Phase 1 study of TNX-1500 is expected to be initiated in the second quarter of 2023. Tonix’s infectious disease pipeline includes a vaccine in development to prevent smallpox and monkeypox, TNX-801, a next-generation vaccine to prevent COVID-19, TNX-1850, a platform to make fully human monoclonal antibodies to treat COVID-19, TNX-3600, humanized anti-SARS-CoV-2 monoclonal antibodies, TNX-3800, and a class of broad-spectrum small molecule oral antivirals, TNX-3900. TNX-801, Tonix’s vaccine in development to prevent smallpox and monkeypox, also serves as the live virus vaccine platform or recombinant pox vaccine (RPV) platform for other infectious diseases. A Phase 1 study of TNX-801 is expected to be initiated in Kenya in the second half of 2023.
*All of Tonix’s product candidates are investigational new drugs or biologics and have not been approved for any indication.
This press release and further information about Tonix can be found at www.tonixpharma.com.
Forward Looking Statements
Certain statements in this press release are forward-looking within the meaning of the Private Securities Litigation Reform Act of 1995. These statements may be identified by the use of forward-looking words such as “anticipate,” “believe,” “forecast,” “estimate,” “expect,” and “intend,” among others. These forward-looking statements are based on Tonix’s current expectations and actual results could differ materially. There are a number of factors that could cause actual events to differ materially from those indicated by such forward-looking statements. These factors include, but are not limited to, risks related to the failure to obtain FDA clearances or approvals and noncompliance with FDA regulations; delays and uncertainties caused by the global COVID-19 pandemic; risks related to the timing and progress of clinical development of our product candidates; our need for additional financing; uncertainties of patent protection and litigation; uncertainties of government or third party payor reimbursement; limited research and development efforts and dependence upon third parties; and substantial competition. As with any pharmaceutical under development, there are significant risks in the development, regulatory approval and commercialization of new products. Tonix does not undertake an obligation to update or revise any forward-looking statement. Investors should read the risk factors set forth in the Annual Report on Form 10-K for the year ended December 31, 2021, as filed with the Securities and Exchange Commission (the “SEC”) on March 14, 2022, and periodic reports filed with the SEC on or after the date thereof. All of Tonix’s forward-looking statements are expressly qualified by all such risk factors and other cautionary statements. The information set forth herein speaks only as of the date thereof.
Mark Reichman, Senior Research Analyst, Natural Resources, Noble Capital Markets, Inc.
Refer to the full report for the price target, fundamental analysis, and rating.
Alberta projects are front and center. Boardwalk and Park Place are both district-scale lithium brine projects with significant potential for commercial development. LithiumBank established Canada’s first indicated mineral resource of lithium brine at its Boardwalk project and assayed wells up to 82.0 milligrams per liter lithium at Park Place. LithiumBank intends to complete a preliminary economic assessment (PEA) for Boardwalk in the first quarter of 2023 and a preliminary feasibility study (PFS) in the second half of the year. At Park Place, a mineral resource estimate is expected in the first half of the year, followed by a PEA in the second half of 2023. LithiumBank expects to conduct detailed hydrogeological modeling and brine sampling at both Boardwalk and Park Place to expand and upgrade the classification of their lithium resources to measured and indicated categories.
Brine processing pilot plant. LithiumBank intends to further de-risk Boardwalk and Park Place by commissioning a brine processing pilot plant in the second half of 2023 to produce a concentrated lithium chloride solution. LithiumBank is working with several direct lithium extraction (DLE) technology providers to enhance recovery, lower power consumption, and reduce project capital expenditures. This work and subsequent reservoir sampling is expected to be incorporated into the Boardwalk PEA and Park Place resource estimate.
Equity Research is available at no cost to Registered users of Channelchek. Not a Member? Click ‘Join’ to join the Channelchek Community. There is no cost to register, and we never collect credit card information.
This Company Sponsored Research is provided by Noble Capital Markets, Inc., a FINRA and S.E.C. registered broker-dealer (B/D).
*Analyst certification and important disclosures included in the full report. NOTE: investment decisions should not be based upon the content of this research summary. Proper due diligence is required before making any investment decision.
For more than 45 years, 1-800-Flowers.com has offered truly original floral arrangements, plants and unique gifts to celebrate birthdays, anniversaries, everyday occasions, and seasonal holidays, and to deliver comfort during times of grief. Backed by a caring team obsessed with service, 1-800-Flowers.com provides customers thoughtful ways to express themselves and connect with the most important people in their lives. 1-800-Flowers.com is part of the 1-800-FLOWERS.COM, Inc. family of brands. Shares in 1-800-FLOWERS.COM, Inc. are traded on the NASDAQ Global Select Market, ticker symbol: FLWS.
Michael Kupinski, Director of Research, Noble Capital Markets, Inc.
Jacob Mutchler, Research Associate, Noble Capital Markets, Inc.
Refer to the full report for the price target, fundamental analysis, and rating.
Beats expectations. The company reported fiscal Q2 revenue of $897.9 million and adj. EBITDA of $131.4 million. Revenue was in line with our estimate of $897.1 million and adj. EBITDA beat our estimate of $112.2 million million by 17.1%.
Better than expected EBITDA margins. The second quarter adj. EBITDA margin was 14.6%, which beat our estimate of 12.5%. The driver of improved EBITDA margins was the strong performance from the Gourmet Food & Gift Baskets segment. The segment beat our adj. EBITDA estimate and adj. EBITDA margin estimate by 18.8% and 15%, respectively.The stronger than expected adj. EBITDA figure was driven by cost cutting initiatives and declining input costs. Management anticipates that adj. EBITDA margins will further improve in the second half of fiscal 2023.
Equity Research is available at no cost to Registered users of Channelchek. Not a Member? Click ‘Join’ to join the Channelchek Community. There is no cost to register, and we never collect credit card information.
This Company Sponsored Research is provided by Noble Capital Markets, Inc., a FINRA and S.E.C. registered broker-dealer (B/D).
*Analyst certification and important disclosures included in the full report. NOTE: investment decisions should not be based upon the content of this research summary. Proper due diligence is required before making any investment decision.
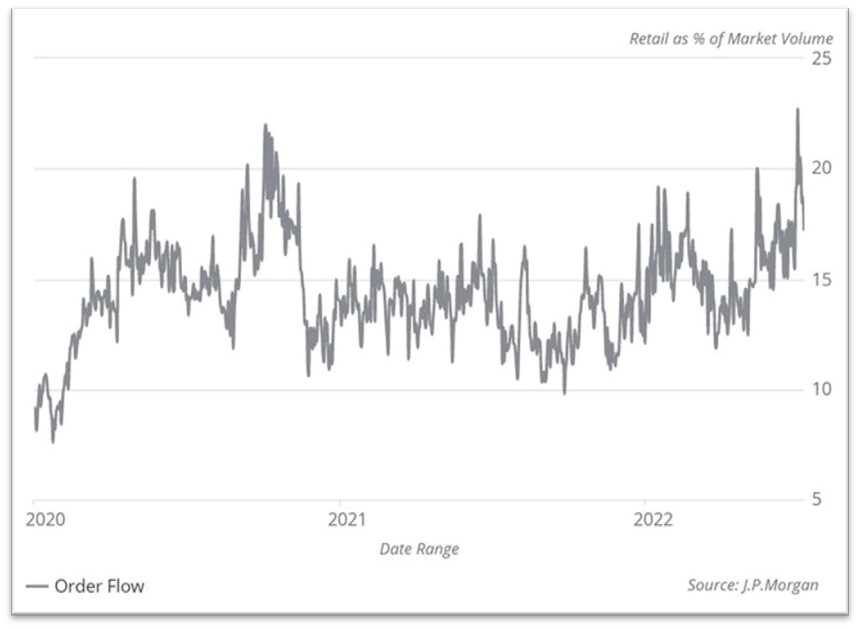
The Percentage Volume of Retail Transactions Has Surpassed 2020’s Level
Retail investors were a strong market force in 2021, and after a hiatus through much of 2022, they may be setting the tone in 2023. As a whole, the investors that fall into this category are watching signs that the US Federal Reserve and other central banks may be near the end of their rate hikes. This, coupled with last year’s sell-off, was taken as a sign to selectively jump back into positions. The positions they have been putting on have been moving the needle in the “risk-on” category; this has sent many of last year’s losers up double digits.
Data from JP Morgan demonstrate retail transactions have recently surpassed the market volume peak reached in the Fall of 2020. The more volume as a percentage of trades, the more influence over price movements any investment group has.
JPMorgan Data Shows Retail’s Market Percentage Has Quickly Grown
Retail Investors as % of Investors (JPM)
What Prices Have They Impacted?
During the last week in January, retail market orders as a percent of market value reached 23%, according to JPMorgan. Comparatively, it got to 22% a few times when GameStop (GME) was confounding institutional money while surging in valuation. As with the increase in retail volume during 2020, the renewed interest in committing to trades can have an outsized impact on sector movements and those of favorite stocks.
During the pandemic lockdown period, many self-directed investors chose to follow groups such as r/WallStreetBets on Reddit and forums on other chatrooms and platforms. One strategy that worked was directed at hedge fund short positions. It involved massive buying of stocks that were heavily shorted. The goal was to force the shorts to cover, which would produce buying and a higher stock price. This was effective enough to have caused significant problems with both institutional investors and the brokerage community settling the trades.
As January came to a close Many of the same risk trades, have gotten attention. AMC Theatres (AMC) is up 70% YTD. Cathie Wood’s ARKK fund, which invests in speculative disruptive companies, has risen nearly 46%. Also in the fund category is an ETF that invests in so-called meme stocks (MEME), this is up 41%.
Bitcoin (BTC.X), which had been presumed on its deathbed toward the end of last year, is up over 42% as it continues to track technology.
Will They Again Score?
“Mark my words, it’s going to end in tears,” was a popular line amongst market pundits back in 2020-2021. The Great Unwashed, the Meme Stock Investors, the market participants Jim Kramer called Robin Hoodies don’t have a long track record. But the track record they do have is worth noting.
According to JP Morgan, as of the first week in February, Tesla (TSLA) was the most sold stock by retail investors. Others that have been sold include those categorized as green and infrastructure stocks tied to EVs and 5G broadband.
The most purchased were Amazon (AMZN) and APPLE (AAPL). The hashtag #MOASS, or Mother of All Short Squeezes, has been trending most days on Twitter. The stock tied to the posts is AMC (AMC, APE), as there has been ongoing news surrounding this classic meme stock. One meme stock that has not attracted that much attention is Bed Bath and Beyond (BBBY). The company, which is trading at $3.20 after having been at $22.80 less than a year ago, is on life support, and closing dozens of stores amongst talk of bankruptcy. For those that were able to withstand the retail short-squeeze in BBBY, they may be able to cash in.
Take Away
If the “risk-on” trend among retail investors continues, discretionary institutional money has learned to pay attention. Self-directed investors should also pay attention to new activity, and any rotation from one cooling sector to one that is heating up.
In addition to following the news on Channelchek, investors can watch the Investor Movement Index (IMX) reported on the last weekend of each month by TDAmeritrade. For additional insight, it is always fun to check in on what the message boards are buzzing about and sorting through the serious and the nonsensical on Reddit and Twitter.
MIAMI, Feb. 02, 2023 (GLOBE NEWSWIRE) — Motorsport Games Inc. (NASDAQ: MSGM) (“Motorsport Games” or the “Company”), today announced that it has entered into a definitive agreement for the issuance and sale of an aggregate of 144,366 shares of the Company’s Class A common stock at a purchase price of $23.50 per share in a registered direct offering priced at-the-market under Nasdaq rules. The closing of the offering is expected to occur on or about February 3, 2023, subject to the satisfaction of customary closing conditions.
H.C. Wainwright & Co. is acting as the exclusive placement agent for the offering.
The gross proceeds to Motorsport Games from the offering are expected to be approximately $3.39 million, before deducting the placement agent’s fees and other offering expenses payable by the Company. Motorsport Games currently intends to use the net proceeds from the private placement for development of multiple games, working capital and general corporate purposes.
The shares of Class A common stock described above are being offered and sold by the Company pursuant to a “shelf” registration statement on Form S-3 (Registration No. 333-262462), including a base prospectus, previously filed with the Securities and Exchange Commission (SEC) on February 2, 2022 and declared effective by the SEC on February 10, 2022. The offering of the shares of Class A common stock are being made only by means of a prospectus supplement that forms a part of the registration statement. A final prospectus supplement and an accompanying base prospectus relating to the offering will be filed with the SEC and will be available on the SEC’s website located at http://www.sec.gov. Electronic copies of the final prospectus supplement and accompanying base prospectus may also be obtained by contacting H.C. Wainwright & Co., LLC at 430 Park Avenue, 3rd Floor, New York, NY 10022, by phone at (212) 856-5711 or e-mail at placements@hcwco.com.
This press release shall not constitute an offer to sell or a solicitation of an offer to buy these securities, nor shall there be any sale of these securities in any state or jurisdiction in which such offer, solicitation or sale would be unlawful prior to the registration or qualification under the securities laws of any such state or jurisdiction.
About Motorsport Games:
Motorsport Games, a Motorsport Network company, is a leading racing game developer, publisher and esports ecosystem provider of official motorsport racing series throughout the world. Combining innovative and engaging video games with exciting esports competitions and content for racing fans and gamers, Motorsport Games strives to make the joy of racing accessible to everyone. The Company is the officially licensed video game developer and publisher for iconic motorsport racing series across PC, PlayStation, Xbox, Nintendo Switch and mobile, including NASCAR, INDYCAR, 24 Hours of Le Mans and the British Touring Car Championship (“BTCC”), as well as the industry leading rFactor 2 and KartKraft simulations. rFactor 2 also serves as the official sim racing platform of Formula E, while also powering F1 Arcade through a partnership with Kindred Concepts. Motorsport Games is an award-winning esports partner of choice for 24 Hours of Le Mans, Formula E, BTCC, the FIA World Rallycross Championship and the eNASCAR Heat Pro League, among others. Motorsport Games is building a virtual racing ecosystem where each product drives excitement, every esports event is an adventure and every story inspires.
Forward-Looking Statements
Certain statements in this press release which are not historical facts are forward-looking statements within the meaning of Section 27A of the Securities Act of 1933, as amended, and Section 21E of the Securities Exchange Act of 1934, as amended, and are provided pursuant to the safe harbor provisions of the Private Securities Litigation Reform Act of 1995. Any statements in this press release that are not statements of historical fact may be deemed forward-looking statements. Words such as “continue,” “will,” “may,” “could,” “should,” “expect,” “expected,” “plans,” “intend,” “anticipate,” “believe,” “estimate,” “predict,” “potential,” and similar expressions are intended to identify such forward-looking statements. All forward-looking statements involve significant risks and uncertainties that could cause actual results to differ materially from those expressed or implied in the forward-looking statements, many of which are generally outside the control of Motorsport Games and are difficult to predict. Examples of such risks and uncertainties include, without limitation, market and other conditions, statements regarding the completion of the registered direct offering, the satisfaction of customary closing conditions related to the registered direct offering and the anticipated use of proceeds therefrom. Additional factors that could cause actual results to differ materially from those expressed or implied in the forward-looking statements can be found in Motorsport Games’ filings with the SEC, including its Annual Report on Form 10-K for the fiscal year ended December 31, 2021, its Quarterly Reports on Form 10-Q filed with the SEC during 2022, as well as in its subsequent filings with the SEC. Motorsport Games anticipates that subsequent events and developments may cause its plans, intentions and expectations to change. Motorsport Games assumes no obligation, and it specifically disclaims any intention or obligation, to update any forward-looking statements, whether as a result of new information, future events or otherwise, except as expressly required by law. Forward-looking statements speak only as of the date they are made and should not be relied upon as representing Motorsport Games’ plans and expectations as of any subsequent date.
Website and Social Media Disclosure:
Investors and others should note that we announce material financial information to our investors using our investor relations website (ir.motorsportgames.com), SEC filings, press releases, public conference calls and webcasts. We use these channels, as well as social media and blogs, to communicate with our investors and the public about our company and our products. It is possible that the information we post on our websites, social media and blogs could be deemed to be material information. Therefore, we encourage investors, the media and others interested in our company to review the information we post on the websites, social media channels and blogs, including the following (which list we will update from time to time on our investor relations website):
TROY, Mich., Feb. 2, 2023 /PRNewswire/ — Kelly (Nasdaq: KELYA, KELYB), a leading specialty talent solutions provider, will release its fourth-quarter and full-year earnings before the market opens on Thursday, February 16, 2023. In conjunction with its fourth-quarter and full-year earnings release, Kelly will publish a financial presentation on the Investor Relations page of its public website and will host a conference call at 9 a.m. ET.
The call may be accessed in one of the following ways:
Via the Telephone (877) 692-8955 (toll free) or (234) 720-6979 (caller paid) Enter access code 5728672 After the prompt, please enter ”#”
A recording of the conference call will be available after 2:30 p.m. ET on February 16, 2023, at (866) 207-1041 (toll-free) and (402) 970-0847 (caller-paid). The access code is 1472042#. The recording will also be available at kellyservices.com during this period.
About Kelly®
Kelly Services, Inc. (Nasdaq: KELYA, KELYB) connects talented people to companies in need of their skills in areas including Science, Engineering, Education, Office, Contact Center, Light Industrial, and more. We’re always thinking about what’s next in the evolving world of work, and we help people ditch the script on old ways of thinking and embrace the value of all workstyles in the workplace. We directly employ more than 350,000 people around the world, and we connect thousands more with work through our global network of talent suppliers and partners in our outsourcing and consulting practice. Revenue in 2021 was $4.9 billion. Visit kellyservices.com and let us help with what’s next for you.
The Acquired Portfolio of Infectious Disease Assets Includes a Class of Potential Broad Spectrum Oral Antiviral Agents, TNX-3900 with a Host-Directed Mechanism
Tonix Plans to Develop the TNX-3900 Series of Molecules as Oral Antivirals Either as Monotherapy or in Combination with Other Antivirals
The TNX-3900 Class of Antivirals Has a Novel Mechanism of Action Based on Inhibition of Certain Cathepsin Proteases which are Required for Cell Infection by Many Viruses like SARS-CoV-2
Sina Bavari, Ph.D., Tonix EVP of Infectious Disease R&D and Director of the Frederick, MD Research and Development Center (RDC) was a Scientific Founder of Healion Bio, Inc.
CHATHAM, N.J., Feb. 02, 2023 (GLOBE NEWSWIRE) — Tonix Pharmaceuticals Holding Corp. (Nasdaq: TNXP) (Tonix or the Company), a clinical-stage biopharmaceutical company, today announced an agreement whereby Tonix has acquired all of the assets of Healion Bio, Inc. (Healion) including its entire portfolio of next-generation antiviral technology assets. Healion’s drug portfolio includes a class of broad-spectrum small molecule oral antiviral drug candidates with a novel host-directed mechanism of action. Host-directed antivirals modulate human cells and tissues and are different from direct-acting antivirals which inhibit virus proteins and processes. Tonix’s TNX-3900, formerly known as HB-121, are cathepsin protease inhibitors, some of which have strong activity in vitro against SARS-CoV-2.
“We are excited to develop Healion’s drug programs that include TNX-3900, which is a class of drugs with potential broad spectrum anti-viral activity, either as monotherapies or in combination with other antivirals”, said Seth Lederman, M.D., Chief Executive Officer of Tonix Pharmaceuticals. “Broad-spectrum antiviral agents have the potential to reduce viral load and allow the adaptive immune system to alert the other arms of the immune system to mount a protective response. Examples of other classes of host-directed antivirals that have been approved by the U.S. Food and Drug Administration (FDA) include alpha interferon like Pegasys® (peginterferon alfa-2a) for viral hepatitis, the CCR5 antagonist Selzentry® (maraviroc) for HIV, and the anti-IL-6 receptor antagonist monoclonal antibody Actemra® (tocilizumab) for COVID-19.”
Sina Bavari, Ph.D., Executive Vice President for Infectious Disease Research at Tonix said, “I am pleased to be reunited with the infectious disease assets of Healion, since I was the scientific founder of Healion after I retired from my position as Chief of R&D at the United States Army Medical Research Institute of Infectious Disease (USAMRIID). While Healion made some progress developing these advanced technologies, Tonix’s state-of-the art facilities and depth of drug development expertise have the potential to advance the TNX-3900 class of drugs into clinical trials. On behalf of the talented scientific team that I direct at our 48,000 square-foot cutting-edge infectious disease research facility in Frederick, Md., I am pleased to add this technology to the therapeutic development programs underway.”
About TNX-3900
TNX-3900 is the term for a series of molecules that inhibit essential cathepsins which are required by viruses such as coronaviruses and filoviruses to infect cells. Because of the unique antiviral mechanism of these compounds, the Company believes they can potentiate the activity of other antivirals with differing mechanisms. The Company believes this makes cathepsin inhibitors suitable for combination therapy.
Tonix Pharmaceuticals Holding Corp.*
Tonix is a clinical-stage biopharmaceutical company focused on discovering, licensing, acquiring and developing therapeutics to treat and prevent human disease and alleviate suffering. Tonix’s portfolio is composed of central nervous system (CNS), rare disease, immunology and infectious disease product candidates. Tonix’s CNS portfolio includes both small molecules and biologics to treat pain, neurologic, psychiatric and addiction conditions. Tonix’s lead CNS candidate, TNX-102 SL (cyclobenzaprine HCl sublingual tablet), is in mid-Phase 3 development for the management of fibromyalgia with a new Phase 3 study launched in the second quarter of 2022 and interim data expected in the second quarter of 2023. TNX-102 SL is also being developed to treat Long COVID, a chronic post-acute COVID-19 condition. Tonix initiated a Phase 2 study in Long COVID in the third quarter of 2022. TNX-1300 (cocaine esterase) is a biologic designed to treat cocaine intoxication and has been granted Breakthrough Therapy designation by the FDA. A Phase 2 study of TNX-1300 is expected to be initiated in the second quarter of 2023. TNX-1900 (intranasal potentiated oxytocin), a small molecule in development for chronic migraine, is expected to enter the clinic with a Phase 2 study in the first quarter of 2023. TNX-601 ER (tianeptine hemioxalate extended-release tablets) is a once-daily formulation of tianeptine being developed as a potential treatment for major depressive disorder (MDD) with a Phase 2 study expected to be initiated in the first quarter of 2023. Tonix’s rare disease portfolio includes TNX-2900 (intranasal potentiated oxytocin) for the treatment of Prader-Willi syndrome. TNX-2900 has been granted Orphan Drug designation by the FDA. Tonix’s immunology portfolio includes biologics to address organ transplant rejection, autoimmunity and cancer, including TNX-1500, which is a humanized monoclonal antibody targeting CD40-ligand (CD40L or CD154) being developed for the prevention of allograft and xenograft rejection and for the treatment of autoimmune diseases. A Phase 1 study of TNX-1500 is expected to be initiated in the second quarter of 2023. Tonix’s infectious disease pipeline includes a vaccine in development to prevent smallpox and monkeypox, TNX-801, a next-generation vaccine to prevent COVID-19, TNX-1850, a platform to make fully human monoclonal antibodies to treat COVID-19, TNX-3600, and humanized anti-SARS-CoV-2 monoclonal antibodies, TNX-3800, recently licensed from Curia. TNX-801, Tonix’s vaccine in development to prevent smallpox and monkeypox, also serves as the live virus vaccine platform or recombinant pox vaccine (RPV) platform for other infectious diseases. A Phase 1 study of TNX-801 is expected to be initiated in Kenya in the second half of 2023.
*All of Tonix’s product candidates are investigational new drugs or biologics and have not been approved for any indication.
This press release and further information about Tonix can be found at www.tonixpharma.com.
Forward Looking Statements
Certain statements in this press release are forward-looking within the meaning of the Private Securities Litigation Reform Act of 1995. These statements may be identified by the use of forward-looking words such as “anticipate,” “believe,” “forecast,” “estimate,” “expect,” and “intend,” among others. These forward-looking statements are based on Tonix’s current expectations and actual results could differ materially. There are a number of factors that could cause actual events to differ materially from those indicated by such forward-looking statements. These factors include, but are not limited to, risks related to the failure to obtain FDA clearances or approvals and noncompliance with FDA regulations; delays and uncertainties caused by the global COVID-19 pandemic; risks related to the timing and progress of clinical development of our product candidates; our need for additional financing; uncertainties of patent protection and litigation; uncertainties of government or third party payor reimbursement; limited research and development efforts and dependence upon third parties; and substantial competition. As with any pharmaceutical under development, there are significant risks in the development, regulatory approval and commercialization of new products. Tonix does not undertake an obligation to update or revise any forward-looking statement. Investors should read the risk factors set forth in the Annual Report on Form 10-K for the year ended December 31, 2021, as filed with the Securities and Exchange Commission (the “SEC”) on March 14, 2022, and periodic reports filed with the SEC on or after the date thereof. All of Tonix’s forward-looking statements are expressly qualified by all such risk factors and other cautionary statements. The information set forth herein speaks only as of the date thereof.
VIRGINIA CITY, NEVADA, February 2, 2023 – Comstock Inc. (NYSE: LODE) (“Comstock” or the “Company”) is pleased to announce that Mr. Corrado De Gasperis, Executive Chairman and CEO, will attend the Nevada Clean Energy & Transportation Conference and participate in a three-person panel discussing manufacturing in the electrification supply chain. The Nevada Clean Energy & Transportation Conference kicks off today, February 2, at the Peppermill Resort in Reno, NV.
“Manufacturing and recycling of critical battery grade minerals and metals are vitally important to sustainably reduce reliance on fossil fuels,” stated Mr. De Gasperis, Comstock Inc’s executive chairman and chief executive officer. “Nevada is naturally expanding its existing mining and metallurgical leadership into these technologically-advanced discovery, extraction and beneficiation processes.”
The Nevada Clean Energy & Transportation Conference is hosted by the Nevada Battery Coalition and the Nevada Clean Energy Forum. This new trade association is enabling the full potential of the lithium-ion battery supply chain in Nevada. Comstock participated in establishing the Nevada Battery Coalition with the following companies: 3PL, Albemarle, American Lithium Corp/Tonopah Lithium Corp, Aqua Metals, Cypress Development, Dragonfly Energy, Ioneer, Lithion Battery, Lithium Americas, NV Energy, Panasonic, and Tesla.
Comstock also recently announced an award by the U.S. Department of Energy (“DOE”) of its $2,000,000 grant application to build a pre-pilot scale system to demonstrate one of Comstock’s unique new pathways to produce renewable diesel, sustainable aviation fuel, gasoline, and marine fuel from forestry residues and other forms of lignocellulosic biomass at dramatically improved yield, efficiency and cost in comparison to known methods for decarbonizing transportation.
About Comstock
Comstock (NYSE: LODE) innovates technologies that contribute to global decarbonization and circularity by efficiently converting under-utilized natural resources into renewable fuels and electrification products that contribute to balancing global uses and emissions of carbon and through the deployment of more advanced mineral and material discovery technologies. To learn more, please visit www.comstock.inc.
Forward-Looking Statements
This press release and any related calls or discussions may include forward-looking statements within the meaning of Section 27A of the Securities Act of 1933, as amended, and Section 21E of the Securities Exchange Act of 1934, as amended. All statements, other than statements of historical facts, are forward-looking statements. The words “believe,” “expect,” “anticipate,” “estimate,” “project,” “plan,” “should,” “intend,” “may,” “will,” “would,” “potential” and similar expressions identify forward-looking statements but are not the exclusive means of doing so. Forward-looking statements include statements about matters such as: future industry market conditions; future explorations or acquisitions; future changes in our exploration activities; future prices and sales of, and demand for, our products; land entitlements and uses; permits; production capacity and operations; operating and overhead costs; future capital expenditures and their impact on us; operational and management changes (including changes in the Board of Directors); changes in business strategies, planning and tactics; future employment and contributions of personnel, including consultants; future land sales; investments, acquisitions, joint ventures, strategic alliances, business combinations, operational, tax, financial and restructuring initiatives, including the nature, timing and accounting for restructuring charges, derivative assets and liabilities and the impact thereof; contingencies; litigation, administrative or arbitration proceedings; environmental compliance and changes in the regulatory environment; offerings, limitations on sales or offering of equity or debt securities, including asset sales and associated costs; and future working capital, costs, revenues, business opportunities, debt levels, cash flows, margins, taxes, earnings and growth. These statements are based on assumptions and assessments made by our management considering their experience and their perception of historical and current trends, current conditions, possible future developments, and other factors they believe to be appropriate. Forward-looking statements are not guarantees, representations or warranties and are subject to risks and uncertainties, many of which are unforeseeable and beyond our control and could cause actual results, developments, and business decisions to differ materially from those contemplated by such forward-looking statements. Some of those risks and uncertainties include the risk factors set forth in our filings with the SEC and the following: adverse effects of climate changes or natural disasters; adverse effects of global or regional pandemic disease spread or other crises; global economic and capital market uncertainties; the speculative nature of gold or mineral exploration, and lithium, nickel and cobalt recycling, including risks of diminishing quantities or grades of qualified resources; metal recycling, processing or mining activities; costs, hazards and uncertainties associated with precious metal based activities, including environmentally friendly and economically enhancing clean mining and processing technologies, precious metal exploration, resource development, economic feasibility assessment and cash generating mineral production; costs, hazards and uncertainties associated with metal recycling, processing or mining activities; contests over our title to properties; potential dilution to our stockholders from our stock issuances, recapitalization and balance sheet restructuring activities; potential inability to comply with applicable government regulations or law; adoption of or changes in legislation or regulations adversely affecting our businesses; permitting constraints or delays; ability to achieve the benefits of business opportunities that may be presented to, or pursued by, us, including those involving battery technology, quantum computing and advanced materials development, and development of cellulosic technology in bio-fuels and related carbon-based material production; ability to successfully identify, finance, complete and integrate acquisitions, joint ventures, strategic alliances, business combinations, asset sales, and investments that we may be party to in the future; changes in the United States or other monetary or fiscal policies or regulations; interruptions in our production capabilities due to capital constraints; equipment failures; fluctuation of prices for gold or certain other commodities (such as silver, zinc, lithium, nickel, cobalt, cyanide, water, diesel, gasoline and alternative fuels and electricity); changes in generally accepted accounting principles; adverse effects of war, mass shooting, terrorism and geopolitical events; potential inability to implement our business strategies; potential inability to grow revenues; potential inability to attract and retain key personnel; interruptions in delivery of critical supplies, equipment and raw materials due to credit or other limitations imposed by vendors; assertion of claims, lawsuits and proceedings against us; potential inability to satisfy debt and lease obligations; potential inability to maintain an effective system of internal controls over financial reporting; potential inability or failure to timely file periodic reports with the Securities and Exchange Commission; potential inability to list our securities on any securities exchange or market or maintain the listing of our securities; and work stoppages or other labor difficulties. Occurrence of such events or circumstances could have a material adverse effect on our business, financial condition, results of operations or cash flows, or the market price of our securities. All subsequent written and oral forward-looking statements by or attributable to us or persons acting on our behalf are expressly qualified in their entirety by these factors. Except as may be required by securities or other law, we undertake no obligation to publicly update or revise any forward-looking statements, whether because of new information, future events, or otherwise.
Neither this press release nor any related calls or discussions constitutes an offer to sell, the solicitation of an offer to buy or a recommendation with respect to any securities of the Company, the fund, or any other issuer.
Contact information:
Comstock Inc. P.O. Box 1118 Virginia City, NV 89440 www.comstock.inc
Corrado De Gasperis Executive Chairman & CEO Tel (775) 847-4755 degasperis@comstockinc.com
Zach Spencer Director of External Relations Tel (775) 847-5272 Ext.151 questions@comstockinc.com