The FOMC Votes to Raise Rates for Sixth Time (2022)
The Federal Open Market Committee (FOMC) voted to raise overnight interest rates from a target of 3.00%-3.25% to the new level of 3.75% – 4.00% at the conclusion of its November 2022 meeting. The monetary policy shift in bank lending rates was as expected by economists and the markets. The recent focus has been more on what the next move in December might look like. There were no clues given in the statement following the meeting. Many, including some members of Congress that recently wrote a letter to Chair Powell, have urged the Fed to be more dovish, while others suggest the central bank is still behind and hasn’t moved aggressively enough. A third contingent believes there may be more work to be done, but there should first be a pause to see what the impact has been of five aggressive moves.
The statement accompanying the policy shift also included a discussion on U.S. economic growth continuing to remain positive. There was little changed. Language from that statement can be found below:
Fed Release November 2, 2022
Recent indicators point to modest growth in spending and production. Job gains have been robust in recent months, and the unemployment rate has remained low. Inflation remains elevated, reflecting supply and demand imbalances related to the pandemic, higher food and energy prices, and broader price pressures.
Russia’s war against Ukraine is causing tremendous human and economic hardship. The war and related events are creating additional upward pressure on inflation and are weighing on global economic activity. The Committee is highly attentive to inflation risks.
The Committee seeks to achieve maximum employment and inflation at the rate of 2 percent over the longer run. In support of these goals, the Committee decided to raise the target range for the federal funds rate to 3-3/4 to 4 percent. The Committee anticipates that ongoing increases in the target range will be appropriate in order to attain a stance of monetary policy that is sufficiently restrictive to return inflation to 2 percent over time. In determining the pace of future increases in the target range, the Committee will take into account the cumulative tightening of monetary policy, the lags with which monetary policy affects economic activity and inflation, and economic and financial developments. In addition, the Committee will continue reducing its holdings of Treasury securities and agency debt and agency mortgage-backed securities, as described in the Plans for Reducing the Size of the Federal Reserve’s Balance Sheet that were issued in May. The Committee is strongly committed to returning inflation to its 2 percent objective.
In assessing the appropriate stance of monetary policy, the Committee will continue to monitor the implications of incoming information for the economic outlook. The Committee would be prepared to adjust the stance of monetary policy as appropriate if risks emerge that could impede the attainment of the Committee’s goals. The Committee’s assessments will take into account a wide range of information, including readings on public health, labor market conditions, inflation pressures and inflation expectations, and financial and international developments.
Take-Away
Higher interest rates can weigh on stocks as companies that rely on borrowing may find their cost of capital has increased. The risk of inflation also weighs on the markets. Additionally, investors find that alternative investments that pay a known yield may, at some point, be preferred to equities. For these reasons, higher interest rates are of concern to the stock market investor. However, an unhealthy, highly inflationary economy also comes at a cost to the economy, businesses, and households.
The next FOMC meeting is also a two-day meeting that takes place December 14-15. If the updates to GDP, the pace of employment, and overall economic activity is little changed, the Federal Reserve is expected to move again, perhaps not in as big of a step.
The Many Factors that Come Into a Fed Rate Decision are Mind Boggling
What do the FOMC members look at as they’re changing interest rates and whipping up new policy stances?
The Federal Open Market Committee, or FOMC, meets eight times a year. There are 12 members; seven are board members of the Federal Reserve System, and five are Reserve Bank presidents, including the president of the Federal Reserve Bank of New York, who serves as president of the committee. The group, as a whole, is arguably among the most powerful entities in the world. What is it that this group, that impacts all of us, focus on? And what specifically will they weigh into their decision at the current meeting?
Labor markets and prices are top on the Fed’s list and specifically part of their mandate. Also feeding into the mandate are contributing factors like housing, growth trends, and risks to monetary policy.
Prices (Inflation Rates)
Inflation remains elevated. In September, the Consumer Price Index (CPI) picked up to 0.4%. Energy prices declined in each month of the third quarter, dropping a cumulative 11.3% since June. The Fed will have to discern if this is sustainable or a function of oil reserve releases that will need replacing. Food prices continued high, although at a slower 0.8% increase during September.
Core CPI inflation (which strips out energy and food) started the third quarter at a somewhat slow pace—increasing just 0.3% in July. The trend went against the Fed as it rose by 0.6% in both August and September. Price growth for services was the largest contributor to an increase in core CPI in the third quarter.
One of the two mandates of the Federal Reserve is to keep inflation at bay. Chairman Powell has said they are targeting a 2% annual inflation level. While nothing that has been reported in price increases since the last meeting has approached that low of a target, the Fed also has to consider their tightening moves do not work to lower demand (especially in food and energy) rapidly.
The Federal Reserve’s preferred measure of inflation is the PCE price index; this is the measure they use with their 2% target. The PCE price index typically shows lower price growth than CPI because it uses a different methodology in its calculation, but the drivers of both measures remain similar. Over the year ending September, the headline PCE price index rose 6.2 percent, while the core PCE price index was up 5.1 percent.
Jobs (Employment and Wages)
Labor markets are still tight. The economy has added an additional 3.8 million jobs this year through September. This includes 1.1 million during the most recent quarter. During the third quarter, the U.S. economy exceeded pre-pandemic employment levels. The unemployment rate hasn’t budged much, and as of September, the rate held at a comfortable 3.5 percent rate.
The broadest measure of unemployment—the U-6 rate is a measure of labor underutilization that includes underemployment and discouraged workers, in addition to the unemployed. The U-6 rate has also remained behaved all year. It stood at 6.7 percent in September, the lowest rate in the history of the series (starting in January 1994).
When the Fed pushes on a lever for one of its mandates, in this case it is tightening to reign in inflation, it has to watch the impact on its other mandate, in this case, the job market. So far, there is nothing that has occurred on the employment side that should tell the Fed they have gone too far too fast.
.In fact, the labor numbers may suggest they should discuss whether they have moved nearly fast enough. Competition for employees continued as the economy added an additional 3.8 million through September 2022 (1.1 million during the third quarter). Notably, during the third quarter, the economy surpassed pre-pandemic employment levels as of August 2022.
Image: FOMC participants meet in Washington, D.C., for a two-day meeting on September 20-21, 2022, Federal Reserve (Flickr).
Housing Markets
Housing demand decreased in the third quarter as affordability (lending rates + prices), with economic uncertainty weighed on homebuyers. During September, 90% of all home sales were of existing homes. This pace declined 1.5 percent over the month (down 23.8 percent on a twelve-month basis). New single-family home sales dropped a large 10.9% in September; this was the seventh monthly decline.
Homes available for sale have now risen from all-time lows; this includes new and existing.
Over the past few years, home prices have increased dramatically; this was fueled by Fed policy. Prices still remain above longer-term trendlines. The Case-Shiller national house price index measures sales prices of existing homes; this was up 13% over the year ending August 2022. For reference, for the 12 months ended August 2021, prices rose 20%. The prior year they had only increased 5.8%.
Housing plays a huge role in economic health. The Fed is well aware of all the housing-related inputs to the 2008 financial crisis and the part easy money plays in market crashes. Orchestrating an orderly slowdown to the boom in housing is certainly critical to the Fed’s success.
Other Risks to Economy
Eight times a year, information related to each of the 12 Federal Reserve districts is gathered and bound in a publication known as theBeige Book. This summary of economic activity throughout the U.S. is provided approximately two weeks before each FOMC meeting, so members have a chance to evaluate economic activity over the diverse businesses the U.S. engages in.
U.S. Inflation can arise from conditions outside of the control of the U.S. For example Russia’s invasion of Ukraine has added upward pressure to inflation this year. This impact may have to be determined and netted out of calculations and policy as the Fed can’t fight this inflation pressure with monetary policy. An example would be the Fed can’t alter global food shortages brought on by war.
Dollar strength or weakness comes from many things. One of the most impactful is the difference in interest rates net of inflation between countries and their native currency. If the Fed raises rates when a competing currency has not, there is a chance there will be more demand for the alternative currency, which would weaken the dollar. Further complicating this for the Federal Resreve is a lower dollar is inflationary as it causes import prices to rise, a stronger dollar can reduce domestic economic activity as exports fall. The U.S. dollar has been rising and is now at its strongest in 20 years.
Commodity Prices were elevated in the first half of this year, mostly by energy. Although there was some relief from gas prices over the summer, energy is expected to rise into the colder months. They may rise further as the U.S. Strategic Petroleum Reserves are used less to control prices, this may be curtailed. The White House’s two goals of sharply reducing Russian revenue and avoiding further disruptions to global energy supplies while at the same time reducing oil use and production within the U.S. are a tanglement the Fed needs to consider. These can be very impactful to costs and economic activity, yet The Fed has no direct levers to impact these economic inputs.
World economies play a part in our own economic pace. If the Fed were to tighen aggressively while the global business is slowing, the impact of the tightening might be more pronounced than if the world economies are booming. Demand for goods and services impacts prices; the U.S. doesn’t live in a vacuum, and demand for our production and our demand for foreign production all must weigh on the Feds outlook for global economic health.
According to the IMF’s latest World Economic Outlook, global growth is expected to slow to 3.2 percent in 2022 and just 2.7 percent in 2023. At the same time, central banks around the world are tightening monetary policy to fight high global rates of inflation. In addition, there has been financial instability in some major world economies. These rising risks to the global growth outlook may feed back into the U.S. outlook by weakening international demand for U.S. goods and service exports. On the positive economic side, China is considering easing its Zero-COVID policy, which could eventually ease the supply chain impact to inflation.
Take Away
The original question was, “What do the FOMC members look at as they’re changing interest rates and whipping up new policy stances?” The answer is they have to look at everything. The recent mix of “everything” shows growth and employment in the U.S. have sustained at an even keel. Will previous rate hikes to calm inflation eventually take their toll? This is probably the big question the FOMC will be evaluating. Other domestic issues, including housing and the financial markets, are certainly to be weighed as well – a market crash of any magnitude could quickly slow economic activity.
The Fed has little control over what goes on overseas but must be aware of and hedge its policy to allow for.
All told, the Federal Reserve has a very difficult job. The report of the new monetary policy stance should hit the wire at 2 pm ET today (November 2).
Looking Back at October and Forward to Year-End 2022
The stock market for October was a home run for many industries. In fact, only a few market sectors were negative, each by less than one percent. After a losing first three quarters in most categories, investors are now asking, are we out of the losing slump? Did I already miss the best plays? There are still two months left in 2022, and there are a number of expected events that could cause high volatility (up/down). If you’ve been a market spectator, you want to know, should I get on the field and maybe take advantage of this streak? If you’ve been involved and are now at a recent high, you may instead consider taking a seat for the last two months.
Let’s look back and then forward as we enter the final two months of the year. Below we look at the month behind us in stocks, gold, and crypto. There is something that may be unfolding is stocks that is worth steering around.
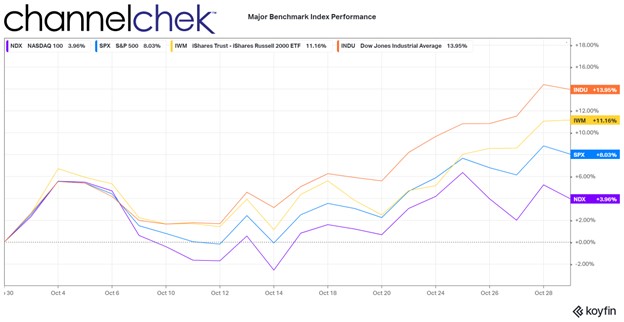
Large industrials, as measured by the Dow 30, had the best comparative performance in October. In fact, the Dow had its best month since 1976. Some investors have been rotating out of large high-tech and into more traditional businesses, like large industrial companies. Another reason it has gotten attention is of the 30 stocks in the Dow Industrials, at least 27 are expected to pay dividends; the lower stock prices from months of decline have raised the expected dividend yields to levels where investors are finding value and doing some reallocating. For example, Dow Chemicals (DOW)with a yield near 5% (plus any appreciations) or Verizon (VZ) at 7% can be appealing, especially for assets of retirees.
The small-cap stocks, as measured by the Russell 2000, weren’t far behind the Dow 30. This group has been lagging for some time and, by many measures, including price/earnings, offers value, while many larger stocks are still considered overpriced. Another thing working in favor of small U.S.-based companies is a likely customer universe that is not hurt by a strong dollar and international trade. In fact, there are small companies that can be shown to have benefitted from a strong native currency and have a competitive advantage with lower borrowing needs. Many analysts expect continued outperformance of the small-cap sector as it offers value and less global disruption.
The top 500 largest stocks, as measured by the S&P 500, had a very good month but are being dragged down by the large weighting of a few huge companies that the market feels have gotten way ahead of where they should be reasonably priced. The Nasdaq 100, shown above as returning only around 3.6%, has been hurt by this index weighting as well. These indexes had once benefitted from these few stocks flying high during the pandemic; the post-pandemic world, as well as global headwinds, are now working against them.
Investors have been taught that index funds and ETFs provide diversification, but that has never been true of Dow-indexed funds (30 stocks). And the S&P and Nasdaq 100, with heavy weightings in a few companies, only give the illusion of broad exposure. The S&P 500 and Nasdaq 100 relative performance during October may cause more investors to consider hand-selecting companies with lower P/Es, lower global exposure, and higher growth potential.
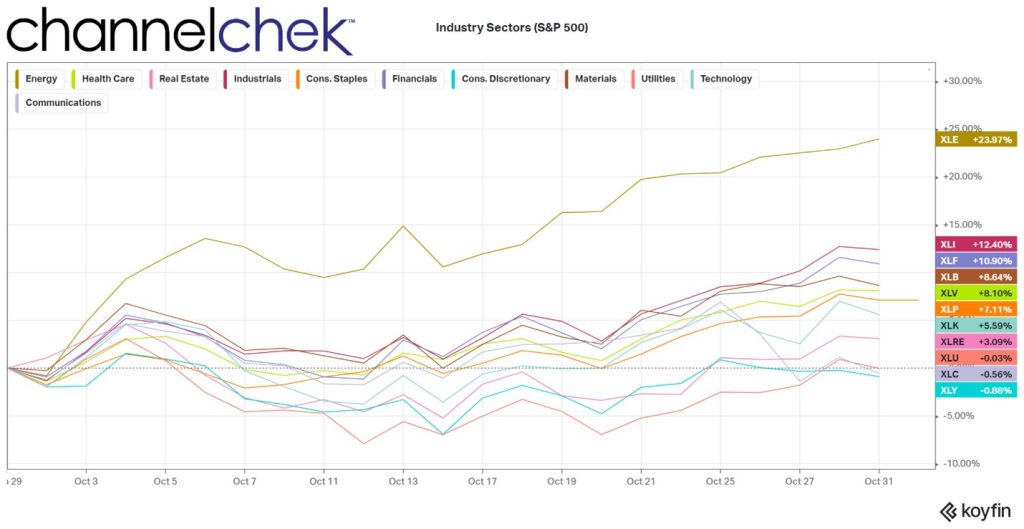
Oil companies regained their lead as they have been a sector detached from other stocks since late 2019. The industrial sector was second and followed by the only other industry above double digits, finance. Most (not all) financial companies benefit from higher interest rates, and those that take deposits (short-term) and lend money (long-term) do best with a steep yield curve.
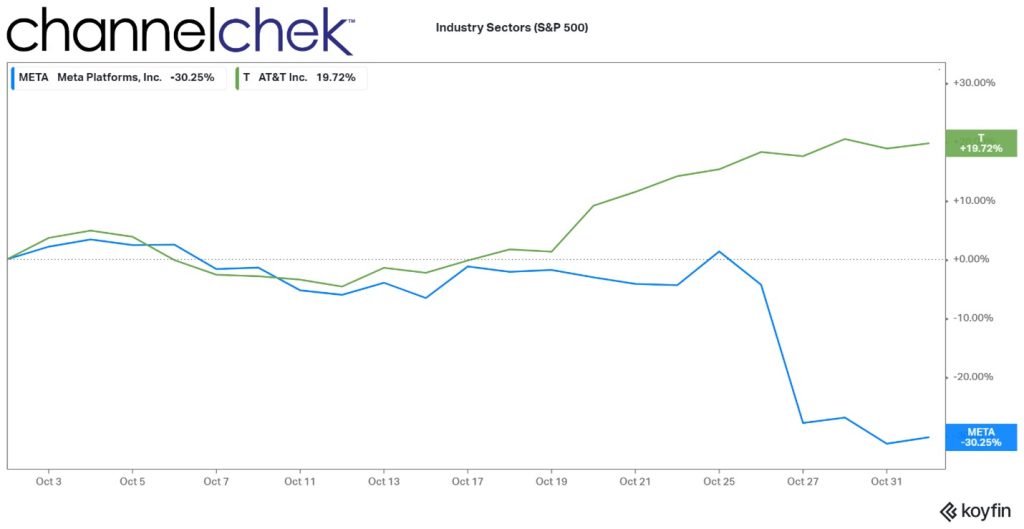
On the bottom of the list are consumer discretionary companies, which are hurt by the strong dollar and a weakening economy; this sector is followed by communication. Communication is worth a deeper dive as it exemplifies how the weighting of stocks in popular indexes can hurt index returns – some say high-flying, highly weighted stocks are even in a bubble.
Below the chart compares two names in the S&P 500 that are also represented in the communications index. Meta (META) is 17.70% of the index and is down 30% in October. AT&T (T) is 4.70% of the communications index; it returned nearly 20% for the month. The funds weighting methodology that worked to the advantage of index investors, until it didn’t, has worked against some index investors.
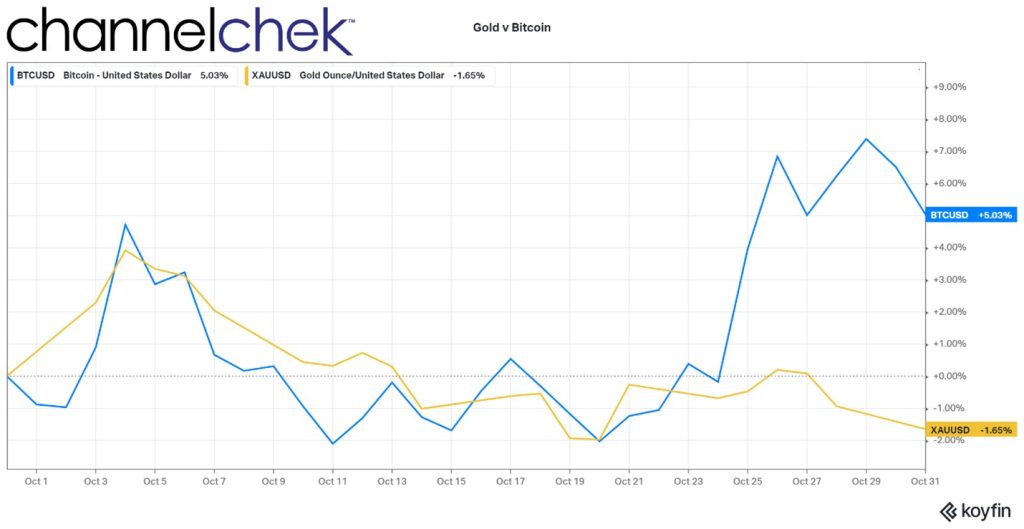
There is a rivalry of sorts between larger, more accepted cryptocurrencies and gold. Gold wants to regain its centuries-old place as the hard asset that best represents safety, even in the worst conditions, and Bitcoin or Ether, which is looking for respect, as the alternative asset that represents safety.
Crypto has been loosely moving in the same direction as stocks all year. October was no exception, as its price per dollar rose significantly during the month. Gold, despite much worry in the world, continued a slow downtrend.
Gold and Bitcoin Performance
Source: Koyfin
Take Away
Stock market participants that held on finally got a month where it was hard not to come out ahead. The question now is, do you take the gains and sit tight while the fed tightening, election, war, and global recession settle? Or do you look at the current dynamics and allocate where the highest probability of success lies? Maybe small-cap value stocks or oil and gas companies.
There is one thing investors have been warned about repeatedly over the years by well-respected investors, including Michael Burry. There is a risk inherent in indexes now that a few extremely “overpriced” stocks represent a large percentage of index funds.
Investors evaluating smaller, individual stocks have found the data and analysis on Channelchek to be indispensable. Be sure to sign-up for Channelchek at no cost to receive unbiased research on companies that are less talked about, but may have a place in your portfolio mix.
What Other Than a Large Rate Hike Can Investors Expect this Week?
Another 75 basis point hike is expected on Wednesday after the November 1-2 FOMC meeting. The discussion that is expected to immediately follow is will the Federal Reserve slow or pause its tightening from there. Those answers can’t be certain as even the Fed hasn’t seen the economic numbers unfold that will lead to the next meeting and play a part in the decision.
Since March, the FOMC has raised rates a cumulative 300 basis points. If they move .75 percent this week, the fed funds target range will be 3.75%-4.00%. This range was last experienced after the January 2008 meeting.
In September’s Summary of Economic Projections, the FOMC forecast for the fed funds rate was 1.25 percent above the current level or .50 percent above what most expect we will have by the end of the week. The statement and remarks following the next FOMC meeting by Chairman Powell may suggest that the FOMC is going to slow down the upward movement in rates while they see if previous rate hikes have begun to have a slowing impact on the economic pace.
The second scheduled event with the most potential to impact markets is the October Employment Situation on Thursday.
From there, all attention and talk may be on the elections next week, as they can have a powerful impact on market moves.
Monday 10/31
9:45 am US Chicago Purchasing Managers Report (PMI). The consensus is 47.3. For September, this survey of business conditions in the Chicago area showed a collapse to 45.7. A small improvement is expected from the October Survey
10:30 am Dallas Fed Manufacturing Survey is expected to come in at -18.0. This would be the sixth straight negative reading. This survey tracks manufacturing in Texas; for September, the results were -17.2.
3:00 pm US Farm Prices are expected to have come down during October by -1.8%, showing a year-over-year rate of 20% increase in farm prices. This is an important inflationary gauge as farm prices are a leading indicator of food price changes Consumer Price Index (CPI). There is a direct relationship between inflation and interest rates; markets can be influenced as interest rate expectations rise and fall.
Tuesday 11/1
The Federal Open Market Committee meets eight times a year in order to determine the near-term direction of monetary policy. The November meeting extends through November 2. After the meeting, typically at 2 pm, any change in monetary policy is announced.
10:00 am US Construction Spending is expected to have fallen by -.5%. Construction spending fell 0.7 percent in August, which was the seventh straight lower-than-expected result, showing lower activity in this important economic sector.
10:00 am JOLTS report consensus is 9.875 million. These reported job openings have been falling over several months; the previous month’s (August) openings reported were 10.05 million. The acronym JOLTS stands for Job Openings and Labor Turnover Survey.
Wednesday 11/2
Motor Vehicle Sales (US) are expected to have increased to 14.2 million from 13.5 million in September. The pattern of consumption is a direct influencer on company earnings and stock prices. Strong economic growth translates to healthy corporate profits and higher stock prices.
10:30 am EIA Petroleum Report shows crude inventory changes, as well as gasoline and other petroleum products. The Energy Information Administration provides this report weekly. During periods when inflation and fuel prices are a concern, the data in these reports can play a wider-than-normal role in influencing stock, bond, and of course, commodity price levels.
FOMC Announcement usually comes at 2:00 pm. The expectations had not changed since the last meeting when it became widely expected that the Federal Reserve would raise overnight lending rates at this meeting by 0.75%. A big focus will be on the policy statement following the meeting to sense at what pace removing accommodation will continue in the US.
Thursday 11/3
8:30 am US Jobless Clams are expected to be 222,000 for the week ending October 29. The prior week they had been 217,000. Employment is one of the Feds’ primary concerns as it fights inflation which also tops the list.
10:00 am US Factory orders are expected to have risen in September by 0.3%. The prior month this leading indicator of future economic activity was flat.
10:30 am EIA Natural Gas weekly report will update the current stocks and storage as well as production information from five regions within the US.
Friday 11/4
8:30 am, the Employment Situation report is released. It is expected to show an unemployment rate of 3.6%, or 210,000. The results of this survey have the potential to jar markets late in the week as one of the more important measures of a healthy economy (weak or overheated) is employment levels.
What Else
If the week brings more clarity from the Federal Reserve and likely next moves, investors may begin to focus on retail numbers as the calendar moves toward the shopping season.
Is the Halloween Investment Strategy a Trick or a Treat?
What Is the Halloween Strategy? Is it statistically reliable? What have the results been?
The directive, “Always remember to buy in November,” has a few different names; the Halloween effect, the Halloween indicator, are among the more common. It answers the question, If I sell in May and walk away, when do I come back? This is because the “Halloween Strategy” and the “Sell in May” strategies are related — they are different ways of suggesting the same action. The results should be identical.
What Is It?
The Halloween strategy is over a century old. Buying when October ends is essentially a market-timing strategy based on the thought that the overall stock market performs better between Oct. 31st (Halloween) and May 1st than it performs from May through the end of October. The directive suggests first that market timing yields better results than buy and hold. Secondly, it says the probability of better results compared to buying and holding is increased, over this period. Those who subscribe to this approach recommend not investing at all during the summer months.
Evidence suggests this strategy does perform well over time, but despite many theories, there is no clear or agreed-upon reason. A famous study was done by Sven Bouman (AEGON Asset Mgmt.) and Ben Jacobsen (Erasmus University Rotterdam) and published in the American Economic Review December 2002. The study documents the existence of a strong seasonal effect in stock returns based on the Halloween indicator. They found the “inherited wisdom” to be true globally and useful in 36 of the 37 developed and emerging markets they studied. They reported the Sell in May effect tends to be particularly strong in European countries and is robust over time. Their sample evidence shows that in the UK the effect has been noticeable since 1694. They also reported, “While we have examined a number of possible explanations, none of these appears to explain the puzzle convincingly.”
Is it Reliable?
I didn’t go back as far as 1694 the way Sven and Ben did. And I didn’t collect data from emerging and developed markets around the globe. More pertinent to Channelchek readers is whether this strategy used on the U.S. markets has been worthwhile.
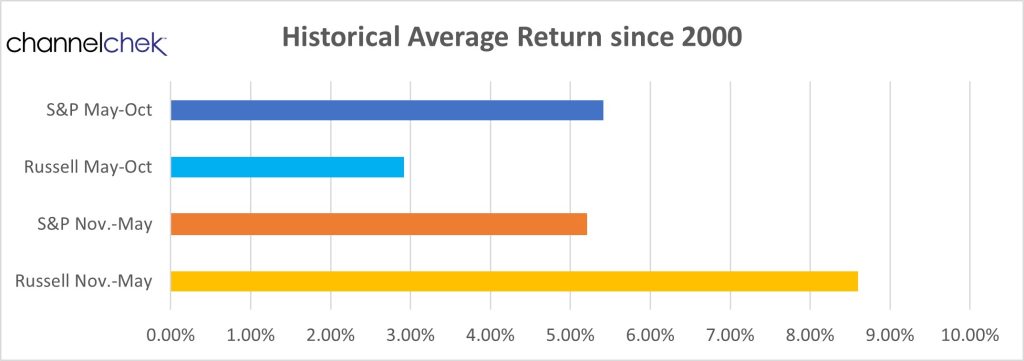
Data Source: Koyfin
The above chart is a compilation of average results for two six-month periods, May through October and November through April. It also looks at two different indexes, the largest stocks in the S&P 500 (blue shades) index and small-cap stocks of the Russell 2000 (orange shades).
What was discovered is that during the period, investors in either of these indexes would have had positive earnings during either “season.” So it supports “buy and hold” wisdom or, at least, staying invested. During the Halloween through May period, the smallcap Russell returned 8.60%, while during the other six months, performance was a weaker 2.92%. The S&P 500 maintained consistent averages in the low 5% area for either period.
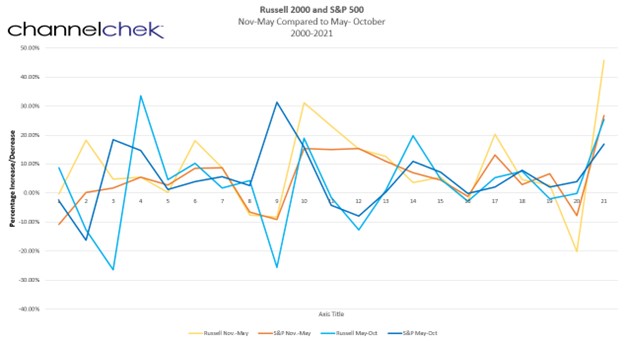
What Have the Results Been?
Since the turn of the century, investors would have fared better if they bought stocks represented in the small-cap average after Halloween, then moved to S&P 500 stocks in May. Below are the results of the 21 periods. The highest returns of either index occurred during the latest Halloween to May cycle. It was the small-cap index that measured a 45.76% gain. The index also measured the second-highest gain during the Sell in May 2004 measurement period. The Sell in May small-cap index also can claim the two lowest performance numbers.
Data Source: Koyfin
Take-Away
The Halloween strategy says that investors should be fully invested in stocks from November through April, and out of stocks from May through October. Variations of this strategy and its accompanying axioms have been around for over a century. Looking at the last 21 years, a deviation that would have paid off would have been moving to small-caps after Halloween.
Both “seasons,” for both measured indexes had positive average earnings. So the notion of staying fully invested is supported using recent data.
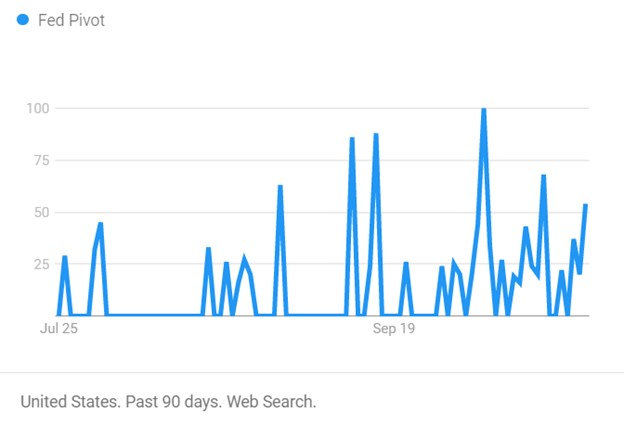
A Lack of Fed Pivot Doesn’t Have to Equate to Lower Stock Prices
The Fed is not likely to have suddenly indicated a pivot.
Despite the stock market rally and fresh news stories suggesting the Fed is indicating a more dovish stance, the notion has one problem. There are limits placed on Federal Open Market Committee (FOMC) participants and whether they can grant interviews or give speeches before policy-setting meetings. They can not interact on the subject of policy. The current blackout period began October 22nd and will carry through the November 2nd final meeting day. So, investors may wish to consider other reasons if the stock market is rallying. Earnings, oversold conditions, year-end rally, perhaps news stories created by bloggers or journalists that don’t possess experience or understanding.
Image: Number of times “Fed Pivot” was searched using Google
Current State of Tightening
This year the Fed has been tightening aggressively after having brought interest rates down aggressively a couple of years back. For many investors, a tightening cycle, ending with interest rates a safe margin above the inflation rate, is not something they can recall. This is because the Fed has been stabilizing employment during tricky times in a way that has lifted the markets out of whatever trouble there may have been. Rates have been well below the average 6% to 8% range. This has been going on since at least 2008 – by some measures, way before.
There have been five times since late Spring that investors and TV’s talking heads were convinced the Fed has gone too far and will now begin bringing rates back. So far, all the hoping has done nothing to help; the track record stands at zero for five. While it remains to be seen and heard what to expect from monetary policy starting mid-next week, the current inflation rate and words that the Fed board members have said indicate another 75 bp hike in funds.
Looking Forward
Can this change? We get a look at third-quarter GDP on Thursday. This measures U.S. domestic production. A bad number could cause the Fed to rethink aggressive tightening. However, the expectations are that it will be higher than it has been all year (2.3% growth rate) which gives the Fed even greater ability to hit the brakes. Also, the PCE Price Index, viewed as the Fed’s preferred inflation indicator, is released Friday (6.3% YoY expected).
The Federal Reserve’s, monetary policy does not cater to the stock market. It does consider it because, of the wealth effect. The wealth effect is where consumers feel poorer because of declines in asset values, and while their disposable income may not have changed, they hunker down and spend less. This secondary impact to spending is the only attention the Fed officially pays to stocks.
Interest Rates
Real interest rates are still negative. Imagine buying a bond knowing that despite being exposed to maturity and credit risk, while tying up money, your spending power will almost certainly be less when it matures. This isn’t why people invest; in fact, if that scenario remains and inflation persists, the best use of savings may be to consider any large purchases you think you may incur in the coming few years and make them now. At the moment, inflation hasn’t shown signs of abating, something has to give; bond investors are going to require higher yields, Japan has already experienced a bond-buyer “strike.”
Where Do We Go from Here
For now, the consensus view is that inflation should drift back down to 3% or even lower by 2025. If energy continues to decline, supply-chain issues are resolved, and a strong U.S. dollar persists, the consensus may be correct. But one should be aware there are very bright economists that deviate from the consensus by plus or minus 300 bp or more.
The markets may have already priced in bad news; rates heading back to normalcy (upward) doesn’t immediately mean a bad stock market. We can easily rally through the end of the year and still experience a sixth time the Fed has refrained from pivoting but instead has made sure its words were cleansed of anything that can be construed as reversing course.
How Deep and How Long Will the Global Energy Crisis Last?
Are we in a global energy crisis? The Executive Director of the International Energy Agency (IEA), Dr. Fatih Birol, is sure of it. He referred to the global situation as a crisis on Tuesday (Oct. 25), speaking first at a conference, and later in an interview on CNBC. He explained that tighter markets for liquefied natural gas (LNG) worldwide and major oil producers cutting supply, have put the world in the middle of “the first truly global energy crisis.”
Our world has never witnessed an energy crisis with this depth and complexity,” according to the IEA head. He explained that until February 24, 2022, Russia was the number one fossil fuel exporter in the world. What has occurred since has been a major turn in oil and natural gas markets. Birol expects the volatility in oil and gas markets will continue throughout the world. When asked on CNBC Internaational if he thought it would be a prolonged war, he made clear that this is not his area of expertise; however, he believes there won’t be a “smooth transition into the next chapter for both oil and natural gas of the energy event.”
U.S. vs OPEC+
As it relates to the U.S. and OPEC being at odds, with OPEC managing toward supply-demand issues, and the U.S. being challenged by inflation, Birol says the two billion barrels cut by the oil-exporting nations is unprecedented. He believes it goes against their ambition to maximize profits as it works against economic growth in a world that is flirting with recession. He also pointed out it isn’t the U.S. that will experience hardship, rather, the emerging and developing countries will be hit hardest.
Image: Fatih Birol, IAEA Imagebank (November 2021)
On the same day, speaking at the Singapore International Energy Week, he shared that higher oil prices would push inflation higher and growth and production to shrink.
IEA projections show global oil consumption growing by 1.7 million barrels a day in 2023. Russian crude will be needed to bridge the gap between demand and supply, Birol said.
Russian Connection
The reduced Russian supply is a result of U.S. and the European Union’s decisions to place partial bans on Russian oil imports after Russia’s invasion of its neighboring country. The current proposed plan as the region heads into the heating season is to institute price caps on Russian resources. That would limit Moscow’s potential profits from oil exports while still allowing modest deliveries. Estimates are that these measures would leave space for between 80% and 90% of Russian oil to flow outside of the price cap. Birol expects this would help to make up for expected shortfalls. “I think this is good, because the world still needs Russian oil to flow into the market for now,” he said.
Oil Reserves
IEA members have built a stockpile of oil reserves that can be released if there’s a need to boost supply or temper prices, according to Birol. “We still have a huge amount of stocks to be released in case we see supply disruptions,” he said. “Currently, it is not on the agenda, but it can come anytime.”
The IEA head says that Europe will get through the winter if the weather remains mild, though somewhat battered. Birol said. “Unless we will have an extremely cold and long winter, unless there will be any surprises in terms of what we have seen, for example, Nord Stream pipeline explosion, Europe should go through this winter with some economic and social bruises.”
Take Away
The Executive Director of the IEA was in Singapore, speaking at a conference and giving media interviews. He did not sugarcoat his expectations. He expects oil and natural gas prices to remain volatile, and believes the emerging markets will be hurt most by OPECs cutting output. As for the upcoming winter, Birol says we are experiencing the worst global energy crisis in history, and it won’t resolve itself soon.
Planning for a Changing Market Environment is Not Without Risks
There are two upcoming events, one scheduled and one not. They each have the potential and perhaps are even likely, to jolt or shift financial markets for a period longer than the ordinary disruptions traders and investors experience over the course of any month. These two items are the U.S. elections, which are approaching quickly, and a resolution of the Russia and Ukraine war.
Mid-Terms
On the U.S. side of the Atlantic, the mid-term election is thought of as a referendum on the person in the Oval Office and their party. The democrats who are in power in both legislative branches and also hold the executive branch are likely to lose the House and perhaps the Senate. The gridlock that would unfold if this occurs would include many government spending plans that have helped drive some investment sectors since January 2021. However, the party currently controlling both are viewed by many market participants as not “Wall Street-friendly,” so this could also weigh into market direction. And just as critical for investors, it would have the ability to shift which sectors are winners and which investments one may wish to lighten up in.
European War
In Europe, the war means a lot of things to those that live there. Focusing only from a global investor standpoint, one’s mind first turns to the energy sector. If the outcome is one where Russia largely has its way and annexes a large portion of Ukraine, how long would it take for normalcy to resume? And what would that look like? If, instead, Putin, who is leading the charge, loses power or his resolve, what would this mean for stocks, commodity prices, and overall investor mood? Should investors pre-think all scenarios and have a plan for each?
What Investment Experts Say
Channelchek spoke to a couple of highly respected, highly credentialed money managers and investment experts and asked about pre-planning.
Eric Lutton, CFA is Chief Investment Officer, at Sound Income Strategies. Eric doesn’t expect Putin to be removed, but cautions that if he is, depending on what follows, it may not automatically be good for markets. He said, “If Putin was “pushed” out of power, a highly unlikely scenario, but if it were to happen, it would mean more unknowns for the market, which would probably be taken as another negative.” Lutton, who has spent a great deal of time in Russia and Northern Europe, explains, “A vacuum of power in Russia would not be a good thing and could escalate the current situation.” Eric believes if a leader chosen by the West was installed, “inflation would fall, and the Fed could ease up on the rate increases.” Lutton does not think that is a scenario we will see any time soon.
The Sound Income Strategies CIO thinks the media overplays any real risk of Putin dropping a nuclear device so close to Russia on land it seeks to annex. But he did entertain the thought, as I pressured him for hypothetical scenario analysis and investment planning thoughts. “As for investors, if a bomb falls, either Putin or a false flag operation, you’d want to be in 100% cash! No place would be safe other than perhaps a handful of industrial defense or war contractors,” Said Eric Lutton.
As it relates to the November 8th mid-term elections, Eric Lutton isn’t expecting a huge “red wave” win. He points to the notion that there are people that would avoid voting red even if it was clear that the policies would better serve the populace. Eric does, however expect Republicans to gain a majority in the House and Senate. Even if they only gain a majority in one branch, Lutton says, “I do think there will be a slight pop in the market, but short-lived as the main factors will be the Fed, inflation, supply chain and ongoing conflict in Ukraine.”
Robert Johnson, PhD, CFA, CAIA, is the CEO and Chair at Economic Index Associates. He apologetically offered conventional wisdom, suggesting that it could be a mistake for investors to, “…concern themselves with broad market moves or the crisis du jour.” Johnson, instead, recommends more tried and true portfolio implementation. This includes suggesting the creation of an Investment Policy Statement (IPS). Dr. Johnson explains that clearly defining, in advance, and in accordance with one’s time horizon and other specifics, such as liquidity needs and tax situation, will define the ground rules necessary during temporary hiccups in the market.
As it relates to a personal investment policy statement, the Chair of Economic Index Associates says it is best to develop a policy statement in calm, less volatile markets. He says’ “The whole point of an IPS is to guide you through changing market conditions. It should not be changed as a result of market fluctuations.” He did allow for individual changes in circumstances,” It only needs to be revised when your individual circumstances change — perhaps a divorce or other unanticipated life change.”
As added testimony to what Dr. Johnson knew was less than groundbreaking thoughts on the subject of the two future events and what to do in each, he offered, “ I had a former co-worker who, in the run-up to the 2016 election, was convinced that Hillary Clinton was going to win and the stock market was going to crash. So, immediately prior to the election, he sold out of stocks and went to cash. Stocks surged the day following Trump’s victory, and my co-worker bought back into the market — at a higher price.”
Take-Away
Market hiccups are often short-lived.
While it is prudent to keep your eyes open and know what risks and potential rewards may be, it may also be smart to keep investing within specific boundaries. Those boundaries are best defined when volatility and predictability are average. Within the boundaries, there can be room to lighten up or overweight, but not in ways that pull the investor substantially out of line with their original goal while using the predefined arsenal of stocks, bonds, or other financial products.
Housing Is Getting Less Affordable. Governments Are Making It Worse
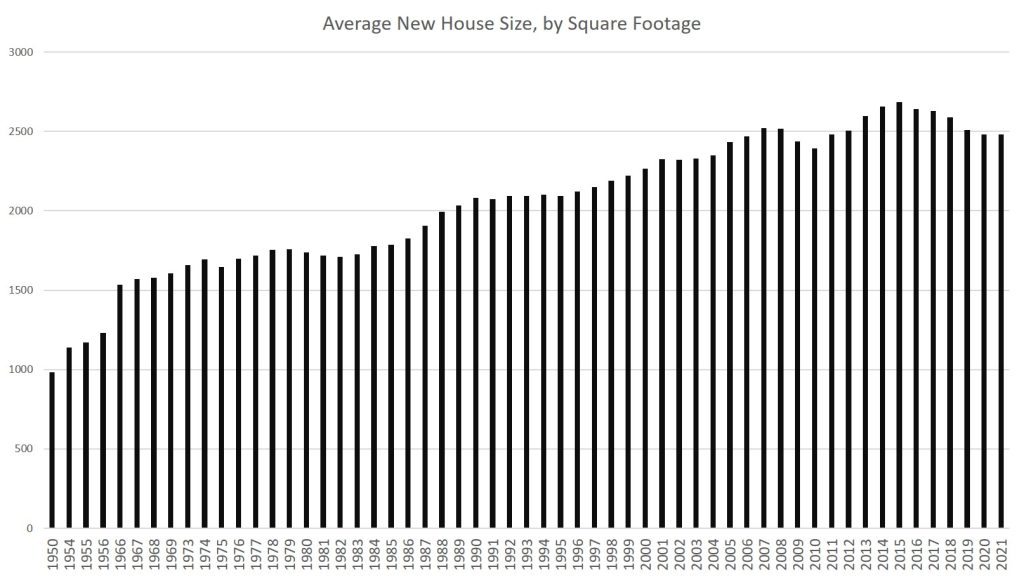
The average square footage in new single-family houses has been declining since 2015. House sizes tend to fall just during recessionary periods. It happened from 2008 to 2009, from 2001 to 2002, and from 1990 to 1991.
But even with strong economic-growth numbers well into 2019, it looks like demand for houses of historically large size may have finally peaked even before the 2020 recession and our current economic malaise. (Square footage in new multifamily construction has also increased.)
According to Census Bureau data, the average size of new houses in 2021 was 2,480 square feet. That’s down 7 percent from the 2015 peak of 2,687.
2015’s average, by the way, was an all-time high and represented decades of near-relentless growth in house sizes in the United States since the Second World War. Indeed, in the 48 years from 1973 to 2015, the average size of new houses increased by 62 percent from 1,660 to 2,687 square feet. At the same time, the quality of housing also increased substantially in everything from insulation, to roofing materials, to windows, and to the size and availability of garages.
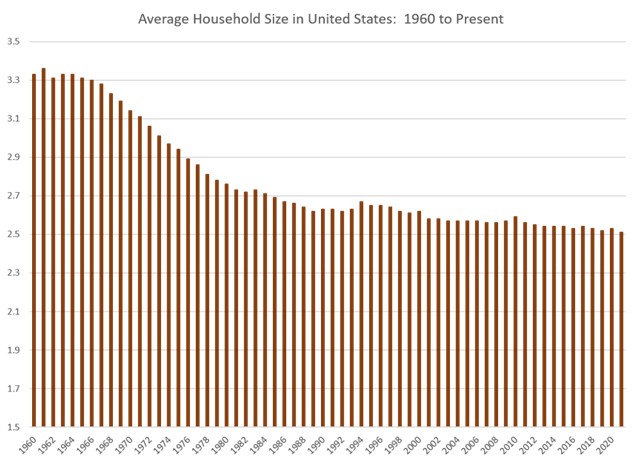
Meanwhile, the size of American households during this period decreased 16 percent from 3.01 to 2.51 people.
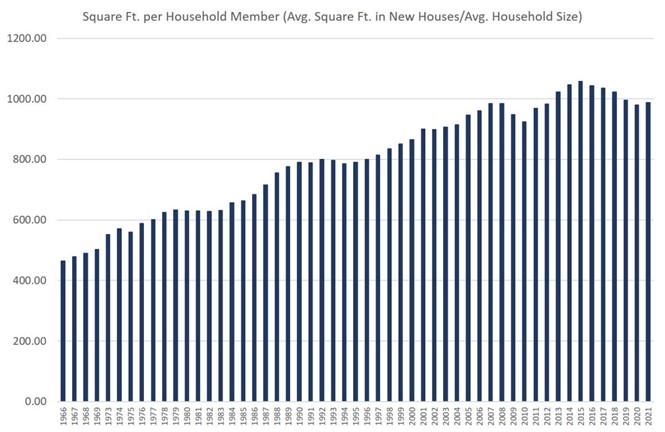
Yet, even with that 7 percent decline in house size since 2015, the average new home in America as of 2021 was still well over 50 percent larger than they were in the 1960s. Home size isn’t exactly falling off a cliff. US homes, on a square-foot-per-person basis, remain quite large by historical standards. Since 1973, square footage per person in new houses has nearly doubled, rising from 503 square feet per person in 1973 to 988 square feet person in 2021. By this measure, new house size actually increased from 2020 to 2021.
This continued drive upward in new home size can be attributed in part to the persistence of easy money over the past decade. Even as homes continued to stay big—and thus stay comparatively expensive—it was not difficult to find buyers for them. Continually falling mortgage rates to historical lows below even 3 percent in many cases meant buyers could simply borrow more money to buy big houses.
But we may have finally hit the wall on home size. In recent months we’re finally starting to see evidence of falling home sales and falling home prices. It’s only now, with mortgage rates surging, inflation soaring, and real wages falling—and thus home price affordability falling—that there are now good reasons for builders to think “wow, maybe we need to build some smaller, less costly homes.” There are many reasons to think that they won’t, and that for-purchase homes will simply become less affordable. But it’s not the fault of the builders.
This wouldn’t be a problem in a mostly-free market in which builders could easily adjust their products to meet the market where it’s at. In a flexible and generally free market, builders would flock to build homes at a price level at which a large segment of the population could afford to buy those houses. But that’s not the sort of economy we live in. Rather, real estate and housing development are highly regulated industries at both the federal level and at the local level. Thanks to this, it is becoming more and more difficult for builders to build smaller houses at a time when millions of potential first-time home buyers would gladly snatch them up.
How Government Policy Led to a Codification of Larger, More Expensive Houses
In recent decades, local governments have continued to ratchet up mandates as to how many units can be built per acre, and what size those new houses can be. As The Washington Post reported in 2019, various government regulations and fees, such as “impact fees,” which are the same regardless of the size of the unit, “incentivize developers to build big.” The Post continues, “if zoning allows no more than two units per acre, the incentive will be to build the biggest, most expensive units possible.”
Moreover, community groups opposed to anything that sounds like “density” or “upzoning” will use the power of local governments to crush developer attempts to build more affordable housing. However, as The Post notes, at least one developer has found “where his firm has been able to encourage cities to allow smaller buildings the demand has been strong. For those building small, demand doesn’t seem to be an issue.”
Similarly, in an article last month at The New York Times, Emily Badger notes the central role of government regulations in keeping houses big and ultimately increasingly unaffordable. She writes how in recent decades,
“Land grew more expensive. But communities didn’t respond by allowing housing on smaller pieces of it. They broadly did the opposite, ratcheting up rules that ensured builders couldn’t construct smaller, more affordable homes. They required pricier materials and minimum home sizes. They wanted architectural flourishes, not flat facades. …”
It is true that in many places empty land has increased in price, but in areas where the regulatory burden is relatively low—such as Houston—builders have nonetheless responded with more building of housing such as townhouses.
In many places, however, regulations continue to push up the prices of homes.
Badger notes that in Portland, Oregon, for example, “Permits add $40,000-$50,000. Removing a fir tree 36 inches in diameter costs another $16,000 in fees.” A lack of small “starter homes” is not due to an unwillingness on the part of builders. Governments have simply made smaller home unprofitable.
“You’ve basically regulated me out of anything remotely on the affordable side,” said Justin Wood, the owner of Fish Construction NW.
In Savannah, Ga., Jerry Konter began building three-bed, two-bath, 1,350-square-foot homes in 1977 for $36,500. But he moved upmarket as costs and design mandates pushed him there.
“It’s not that I don’t want to build entry-level homes,” said Mr. Konter, the chairman of the National Association of Home Builders. “It’s that I can’t produce one that I can make a profit on and sell to that potential purchaser.”
Those familiar with how local governments zone land and set building standards will not be surprised by this. Local governments, pressured by local homeowners, will intervene to keep lot sizes large, and to pass ordinances that keep out housing that might be seen by voters as “too dense” or “too cheap-looking.”
Yet, as much as existing homeowners and city planners would love to see nothing but upper middle-class housing with three-car garages along every street, the fact is that not everyone can afford this sort of housing. But that doesn’t mean people in the middle can only afford a shack in a shanty town either — so long as governments will allow more basic housing to be built.
But there are few signs of many local governments relenting on their exclusionary housing policies, and the result has been an ossified housing policy designed to reinforce existing housing, while denying new types of housing that is perhaps more suitable to smaller households and a more stagnant economic environment.
Eventually, though, something has to give. Either governments persist indefinitely with restrictions on “undesirable” housing — which means housing costs skyrocket — or local governments finally start to allow builders to build housing more appropriate to the needs of the middle class.
If current trends continue, we may finally see real pressure to get local governments to allow more building of more affordable single-family homes, or duplexes, or townhouses. If interest rates continue to march upward, this need will become only more urgent. Moreover, as homebuilding materials continue to become more expensive thanks to 40-year highs in inflation—thanks to the Federal Reserve—there will be even more need to find ways to cut regulatory costs in other areas.
For now, the results have been spotty. But where developers are allowed to actually build for a middle-class clientele, it looks like there’s plenty of demand.
About the Author
Ryan McMaken (@ryanmcmaken) is a senior editor at the Mises Institute. Ryan has a bachelor’s degree in economics and a master’s degree in public policy and international relations from the University of Colorado. He is the author of Breaking Away: The Case for Secession, Radical Decentralization, and Smaller Polities (forthcoming) and Commie Cowboys: The Bourgeoisie and the Nation-State in the Western Genre. He was a housing economist for the State of Colorado.
Will the November Fed rate announcement cause a stock market rally?
The next time the Federal Reserve is expected to adjust the target range of the Fed Funds overnight lending rate is Wednesday, November 2nd. Few have doubt at this point that this will again be a 0.75% increase. That level is already baked into equities. Stock market strength and direction shouldn’t veer much from the rate move but could dramatically turn as a result of the Fed’s forward guidance. If Chairman Powell & Co. suggests a slower benchmark lending rate increase, it would be a very welcome sign for investors.
Focus on the Post Meeting Announcement
There are already signs the Fed may slow the pace of Fed Funds increases. There are also indications it may alter its quantitative tightening (QT) in a way that could quicken a yield curve steepening. In other words, the speed of QT may increase. To date, the real rate of return on bonds, of most all maturities, is viewed as unnatural as they are below zero (Yield – Inflation = Real Rate). While an increase in QT may do more to raise rates and reduce the money supply, the effect is stealthier; it doesn’t provide a panicky headline for investors to react to abruptly.
Some Fed governors have already shown signs that they believe the best course from here is to slow the ratcheting up of the funds level and perhaps even stop raising Fed Funds rates early next year. A hiatus would allow them time to see if the moves have had an impact and give members a chance to see if further moves are prudent. The Fed always runs the risk of overreacting and going too far when tightening; this “oversteering” by previous Feds has occurred a high percentage of the time as they contend with a lag between monetary policy shifts and economic reaction.
Where We Are, Where We’re Going
In the most aggressive pace since early 1980, so far in 2022, the Fed raised its benchmark federal-funds rate by 0.75 points at each of its past three meetings. The most recent move was in late September. This left the overnight interest rate at a range between 3% and 3.25%.
The stock market wants the Fed to slow down. It rallied in July and August on expectations that the Fed might slow the pace of increase. Slowing, at least at the time, would have conflicted with the central bank’s inflation target because easy financial conditions stimulate spending, economic growth, and related inflation pressures. This rally in stocks may have prompted Powell to redraft a very public speech to economists in late August. He spoke about nothing else for eight minutes at Jackson Hole except for his resolve to win the fight against higher prices.
But sentiment related to how forceful the FOMC now needs to be may be shifting. Fed Vice Chairwoman Lael Brainard, joined by other officials, have recently hinted they are uneasy with raising rates by 0.75 points beyond next month’s meeting. In a speech on Oct. 10th, Brainard laid out a case for pausing rate rises, noting how they impact the economy over time.
Others that are concerned about the danger of raising rates too high include Chicago Fed President Charles Evans. Evans told reporters on Oct. 10th that he was worried about assumptions that the Fed could just cut rates if it decided they were too high. He felt a need to share his thought that promptly lowering rates is always easier in theory than in practice. The Chicago Fed President said he would prefer to find a rate level that restricted economic growth enough to lower inflation and hold it there even if the Fed faced “a few not-so-great reports” on inflation. “I worry that if the way you judge it is, ‘Oh, another bad inflation report—it must be that we need more [rate hikes],’… that puts us at somewhat greater risk of responding overly aggressive,” Evans said.
Kansas City Fed President Esther George also had something to say on this topic last week. She said she favored moving “steadier and slower” on rate increases. “A series of very super-sized rate increases might cause you to oversteer and not be able to see those turning points,” according to the Kansas City Fed President.
Others like Fed governor Waller don’t view steady 0.75% increases as a done deal but instead something to be reviewed, “We will have a very thoughtful discussion about the pace of tightening at our next meeting,” Waller said in a speech earlier this month.
The caution surrounding oversteering isn’t unanimous; at least one Fed official wants to see proof that inflation is falling before easing up on the economic brake pedal. “Given our frankly disappointing lack of progress on curtailing inflation, I expect we will be well above 4% by the end of the year,” said Philadelphia Fed President Patrick Harker.
The ultimate result is likely to come down to what Mr. Powell decides as he seeks to fashion a consensus. In the past, votes, while not always unanimous, tend to defer to the Chairperson at the time.
Take-Away
If, after the next FOMC meeting, the Fed is entertaining a lower 0.50% rate rise in December (not 0.75%), they will prepare the markets (bond, stock, and foreign exchange) for the decision in the moments and weeks following their Nov. 1-2 meeting. If this occurs, it could cause stocks to perform well just before election day and perhaps make up some lost ground in the year’s final two months.
Tailwinds Causing Investors to Love the Small Cap Sector
Investors have been reeling in U.S. small-cap stocks, and many have experienced the market rewarding them. As the U.S. dollar has been unrelentingly strong in 2022, the cost of products in any other currency has increased, this makes sales more difficult for multinational companies. The lower sales, of course, have the impact of weighing on the profits of U.S. companies that derive a large part of their earnings from overseas trade. This puts the smaller stocks at an advantage.
U.S. Dollar Tailwind
Goods valued in dollars, for example, using The WSJ Dollar Index which measures a basket of 16 currencies against the U.S. currency, are now up 16% on the year. This represents the minimum increase of the cost of products sold after the foreign exchange transaction, before inflation.
This has little impact on small U.S.-based companies that don’t transact as much or at all outside the U.S. borders. This is because companies in the small-cap S&P 600 generate only 20% of their revenue outside the U.S., compared with large-cap S&P 500 stocks that generate 40% of sales internationally, according to FactSet.
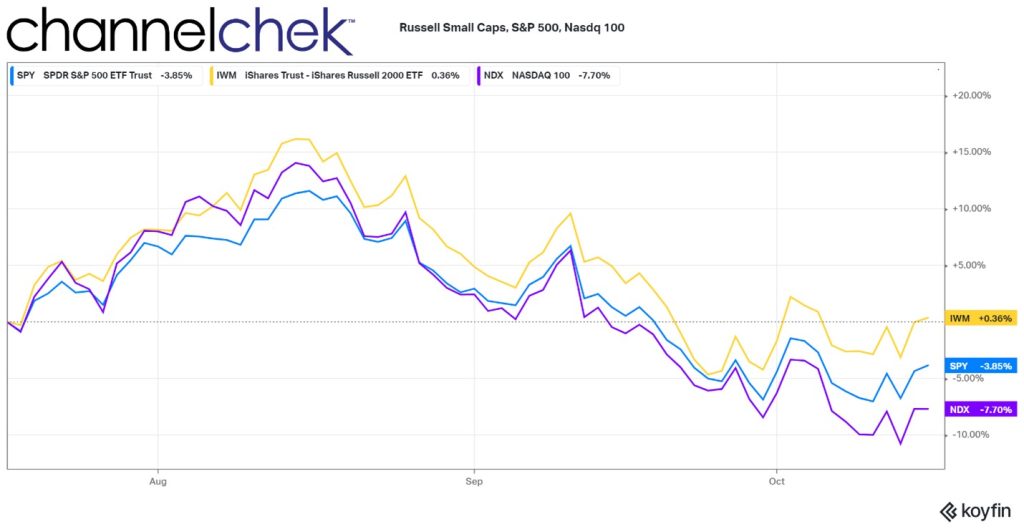
This by itself gives small-cap stocks, in the aggregate, an edge over large-cap indexes like the S&P 500. However, small-caps haven’t been unscathed by the overall negative market sentiment this year. But, in recent months, value investors have been putting more upward pressure on the smaller, more U.S.-centric companies than on companies in the Nasdaq 100 or S&P 500. In fact, the small-cap Russell index is the only one of the three indexes showing green over the past three months. It has also been outperforming in shorter periods like one month, 10 days, and 5 days.
Value Tailwind
Wall Street often uses the ratio of a company’s share price to its earnings (P/E ratio) as a gauge for whether a stock appears cheap or overpriced. The small-cap universe, by this measure, is very attractive relative to themselves in recent years and certainly relative to large-cap valuations now.
The S&P 600 is trading at 10.8 times expected earnings over the next 12 months, according to FactSet as of Friday. That is below its 20-year average of 15.5 and well below the S&P 500’s forward price/earnings ratio of 15.3.
The Russell Small-Cap 2000 is up .36% versus the S&P 500, down 3.85%, and Nasdaq 100, down 7.70%. Not shown on the graph below, the S&P 600 small cap index is flat on the period.
According to Royce Investment’s Third Quarter Chartbook, when comparing the stock market segments, four observations stand out. According to their Market Overview, these are:
1) Small-Cap Value, Small-Cap Core, and Small-Cap Growth are the cheapest segments of U.S. equities, 2) These segments are the only ones that are below their 25-year average valuation,
3) While all three value segments (Small-Cap, Mid-Cap, and Large-Cap) have nearly identical 25-year average valuations, their current valuations are vastly different, and
4) Mid-Cap Growth and Large-Cap valuations still have a long way to fall to reach their 25-year average valuations.
The presumption is with the segments all having the same 25-year average valuations and small-cap being below its average, while mid-cap and large-cap has to go down to reach its mean, that not only is small-cheap, but the other segments are still expensive.
Individually, some of the largest companies in the U.S. have shared their individual risks brought on by fluctuations in the currency market. Nike Inc., Fastenal Co., Domino’s Pizza Inc. and some others have pointed to negative foreign-exchange impacts during recent earnings calls. Microsoft warned of these pressures back in June.
Small-Cap Examples
Some standouts, not necessarily in either the S&P 600 or Russell 2000, small-cap indices, but found on Channelchek are, Bowlero (BOWL), with a market cap of 2.4 billion and performance of up 26.6% over the same three-month period shown in the chart above. For the same period, Comtech Telecommunications (CMTL), with a market cap of 281.5 million, and some international business, is up 12.6%. And RCI Hospitality Holdings (RICK), with a market cap of $705.9 million, has a three-month return of 45.7%. These examples can be found on Channelchek with complete, up-to-date research, alongside many other actionable opportunities.
Take Away
If yesterday’s trade isn’t working because of factors working against it, perhaps what wasn’t working yesterday is now coming into favor. The tailwind for smaller companies is coming from a few different places; they include having a higher percentage of domestic customers and also the law of reversion to the mean. The continued headwinds for larger companies include being much more likely to have problems that include foreign customer FX, and valuations that are still sitting above the 25-year average.
Is Meta the Wrong Path for Facebook, or is it Just Ahead of its Time?
Not all ideas are good ideas, even when they come from billionaire tech start-up founders like Mark Zuckerberg.
Michael Burry, the legendary investor of “Big Short” fame, has been criticizing the social media giant’s metaverse strategy. Burry joins others in questioning why Zuck would change the Facebook formula and spend billions embracing something that is far from real. Many of Zuckerberg’s critics are other successful billionaires like Elon Musk and Mark Cuban. Other critics are investors that have endured Meta share’s 62.3% ($570 billion) decline since January.
Burry founded and manages the hedge fund Scion Asset Management. Burry tweeted a message that seems to say Meta management blew it – and suggests they have blown it by historic proportions by taking a deep dive into something that may or may not have legs – the metaverse.
Image: @BurryDeleted (Twitter)
You don’t have to have been alive in the mid-1980s to know what Burry was saying when he posted, “Seems Meta has a New Coke problem.” Any business school textbook lists Coca-Cola’s changing the formula of its best-selling product as the #1 lesson in corporate blunders. It was an expensive change that failed miserably and caused the company to revert back to its original product or risk losing a lot more ground against rivals.
A Sweet Refresher
New Coke was a much sweeter version of the Coca-Cola people had become accustomed to using to wash down their pizza slices, or a burger and fries. It was introduced by Coca-Cola in April 1985 during the cola war Pepsi was waging.
At the time Coca Cola was perhaps one of the most recognized brands in the world. But, Pepsi stole customers after it ran a few Michael Jackson commercials suggesting its sugar water was the “choice of a new generation,” and also backed it up with ads showing blind taste test preferences. Between the taste test science and everyone wanting to be more like Michael Jackson, Coke lost market share. Coke reacted by reformulating its product and did its own blind side-by-side tests that indicated that consumers seemed to prefer the new sweeter taste, similar to Pepsi. The company then decided to market the reformulated recipe – New Coke was born.
Max Headroom was the spokesman for New Coke, Like the Grand Canyon (Flickr)
New Coke was introduced in April 1985, and within weeks they were receiving 5,000 angry calls a day. The number grew from there. Seventy-nine days after their initial announcement, Coca-Cola held a press conference in July 1985 to offer a mea culpa and announce the return of the original Coca-Cola “classic” formula.
Will Zuckerberg Relent?
So far, Facebook, I mean Meta, still wants to identify as a metaverse company, despite there being very few metaverse customers. The company is making sure users have accessories available and just unveiled a new virtual reality headset selling for $1,500 called the Meta Quest Pro. Zuckerberg says lower priced, presumably not “pro,” will follow ($300-$500 zone).
When one has built a business from a college dorm, a garage, or their mother’s basement, and it attains the kind of growth that Facebook, Apple, Amazon, or others have, it’s hard to keep growing at the pace investors and other onlookers have become accustomed to. This leads to a scenario where investors are exposed to a risk best described as the bigger they are, the farther they have to fall.
And Facebook has fallen, not just in dollar value, but in ranking among its peers. Does this mean Zuckerberg is not right? The game isn’t over, and there aren’t many of us that can say, with honesty, that we are more forward-looking or have more luck than Zuck.
Is Michael Burry Right?
There is a whole universe of stocks beyond metaverse investments. Huge successful companies like Facebook or even Coca-Cola have ample resources to build and grow but lose nimbleness and growth potential, unlike the potential smaller companies enjoy. Huge companies are also more likely to have a “say yes to the boss, and you’ll be rewarded” culture, rather than a small company culture which is more “show the boss you can make them money, and you’ll be rewarded” culture.
Zuckerberg and Meta may very well be moving forward with a mistake that could be enshrined in textbooks years from now. However, like Coke, they may find that if it’s a lemon, they can make lemonade. Coca-Cola emerged from the brief departure from their main product strengthened as consumers discovered what life was like without their favorite soft drink.
Take Away
Michael Burry is worth paying attention to. He thinks differently and has been correct enough to always listen. The metaverse is new; does this mean it won’t grow and become something only a visionary like Mark Zuckerberg can imagine? It has been an expensive and slow start. I suspect Facebook was much less expensive to get off the ground, and adoption also required ancillary products to be useable by the masses.
A lesson investors should remember from this is how difficult it is for large companies to grow from their current offerings and huge corporate base.
Channelchek is a platform created to help investors uncover the next Apple, the next Moderna, or the next Facebook. It’s a resource to dig deeper into these less celebrated fledgling opportunities and to leave investors with enough understanding to decide whether they should take their own action by buying stock and becoming an owner of something with greater than average potential.
A certain EV Company may try to charge up its stock with a buyback.
Are stock buybacks good for companies, good for investors, and better than dividends? Last week, TESLA (TSLA) investors became excited about a tweet from founder Elon Musk that could suggest the company may bow to large shareholders and do a stock buyback. The implications for a company buying back shares and stockholders are many. Below you’ll find details on what the most typical considerations are and what it means from an investor’s standpoint.
What Is a Stock Buyback?
A stock buyback is when a public company uses cash in reserves or borrowed funds to buy shares of its own stock on the open market. A company may do this to consolidate ownership, preserve a higher stock price, boost financial ratios, work to reduce the cost of capital, or to return higher asset values to shareholders.
Investors find out when a public companies that has decided to do a stock buyback announces that the board of directors has passed a “repurchase authorization.” The amount authorized provides how much will be allocated or raised to buy back shares, or in some circumstances, the number of shares or percentage of shares outstanding it aims to purchase.
During the stock buyback, the company goes to the open market as any investor would and purchases shares of its stock in competition with other market participants. The added demand and later reduced shares available (float), puts upward pressure on the stock price. Stockholders then find their shares trade at a higher price than they would have. Shareholders are not obligated to sell their stock to the company, and a stock buyback doesn’t target any specific group of holders—retail and institutional all participate.
Public companies that have decided to do a stock buyback typically announce that the board of directors has passed a “repurchase authorization,” which details how much money will be allocated to buy back shares—or the number of shares or percentage of shares outstanding it aims to buy back.
Why Do a Stock Buyback?
The primary reason a company will buy back shares is to create value for its shareholders. Remember, fewer shares should cause those still being transacted in the open market to be trading at a higher price.
Boards of public companies’ primary responsibility are to look out for shareholders’ interests. At the top of this list is maximizing shareholder value. With this in mind, companies are always finding ways to generate the highest possible returns for their investors. This, at its most fundamental level, includes increasing the value of its stock and rewarding its investors. Buybacks and dividends work to maximize value for shareholders.
Declaring a dividend is the most direct method to return cash to shareholders; there are advantages to stock buybacks:
Tax efficiency – Dividend payments are taxed as income, whereas rising share values aren’t taxed at all. Any holders who sell their shares back to the company may recognize capital gains taxes, but shareholders who do not sell to reap the reward of a higher share value and no additional taxes until they decide when to cash in.
Directly boost share prices – The main goal of any share repurchase program is to deliver a higher share price. The board may feel that the company’s shares are undervalued, making it a good time to buy them. Meanwhile, investors may perceive a buyback as an expression of confidence by the management. After all, why would a company want to buy back stock it anticipates would decline in value?
More flexibility than dividends – Any company that initiates a new dividend or increases an existing dividend will need to continue making payments over the long term. That’s because they risk lower share values and unhappy investors if they reduce or eliminate the dividend going forward. Meanwhile, since share buybacks are one-offs, they are much more flexible tools for management.
Offset dilution – Growing companies may find themselves in a race to attract talent. If they issue stock options to retain employees, the options that are exercised over time increase the company’s total number of outstanding shares—and dilute existing shareholders. Buybacks are one way to offset this effect.
How is Value Impacted?
Key metrics investors and stock analysts use to value a public are impacted by a buyback. For example, cash is removed from a company’s balance sheet, and the number of shares trading is reduced.
Once a company has bought back its own shares, they are either canceled which reduces the number of shares available to trade (not just on the open market), or held by the company as treasury shares. These are not counted as outstanding shares, which has implications for many important measures of a company’s financial fundamentals.
Metrics important to investors, like earnings per share (EPS) are calculated by dividing a company’s profit by the number of outstanding shares. Mathematically, by reducing the number of outstanding shares, a higher EPS results as the quotient.
Price-to-earnings ratios (P/E ratio) are also mathematically improved as a higher price to the same earnings is desirable to shareholders. It helps investors measure a company’s relative valuation by comparing its stock price to its EPS.
Who Else Has Done a Buyback in 2022?
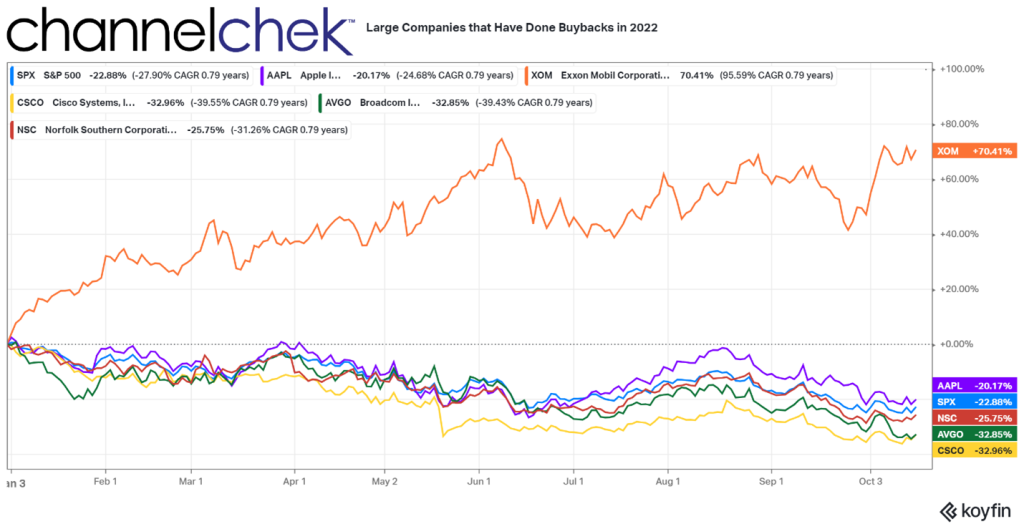
If Tesla does indeed get approval from its board of directors to buy back shares, it won’t be the only large company that has in 2022. Apple (AAPL) bought back 3.5% of its shares in May ($90 billion), Exxon (XOM) bought back 2.9% of its shares in February ($10 billion), Broadcom (AVGO) bought 4.3% of its shares in May, Cisco Systems (CSCO) bought 6.4% of its shares in February (6.4%), and Norfolk Southern purchased 14.6% of its shares ($10 billion) in March.
In some cases, a buyback may not be the best way for companies to build value for shareholders:
It may not be the best use of cash. Long-range growth and building future profits come from investing in company growth, not company stock. Stockholders may prefer, depending on available opportunities for the company and other variables, that the company take a longer-term view. Stock buybacks create quick price gains but may not be the best long-term use of cash. Also, cash for a potential unforeseen challenge to the company could be comforting to some investors, depending on the situation.
When interest rates are low, companies increase their debt-financed share buybacks. In the years just prior to the pandemic, up to half of all buybacks were financed using the low-interest rates at the time. Below-average interest rates incentivized companies to borrow money to spend on share buybacks to boost stock prices. Depending on the scenario, this debt on the balance sheet may long-term weigh on shareholders.
Take Away
Profitable public companies may add value for investors through a stock buyback, also known as share buyback or share repurchase program.
If you are invested in Tesla or another company that may announce a share repurchase program, is this something to be happy about? As a rule, if a public company is profitable, has the cash to spare and its shares are relatively undervalued, then a buyback could be a positive, especially short term.
However, if the company is repurchasing shares of stock while it stymies future growth potential, it could cost long-term investors.