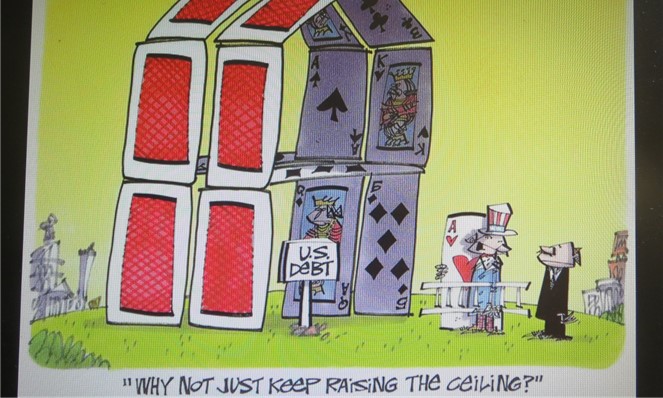
How Liquid Has the Treasury Market Been in 2022?
The health of the US Treasury market impacts almost all other markets. This is because the “risk-free” market (US Treasuries) and its relationship to the US dollar is the foundation from which other markets stand. If it is in trouble, all markets suffer. The “health” measure most associated with securities like treasuries is liquidity or whether money can be raised when needed. Other measures include market spread between the bid and the ask, trading activity levels, and price impact or how a large transaction impacts the price.
A just released report by New York Fed economists Michael Fleming and Claire Nelson discuss the current state of the U.S. Treasury markets from the unique point of view and access to information of the New York Fed.
The report follows:
How Liquid Has the Treasury Market Been in 2022?
Policymakers and market participants are closely watching liquidity conditions in the U.S. Treasury securities market. Such conditions matter because liquidity is crucial to the many important uses of Treasury securities in financial markets. But just how liquid has the market been and how unusual is the liquidity given the higher-than-usual volatility? In this post, we assess the recent evolution of Treasury market liquidity and its relationship with price volatility and find that while the market has been less liquid in 2022, it has not been unusually illiquid after accounting for the high level of volatility.
Why Liquidity Matters
The U.S. Treasury securities market is the largest and most liquid government securities market in the world. Treasury securities are used to finance the U.S. government, to manage interest rate risk, as a risk-free benchmark for pricing other financial instruments, and by the Federal Reserve in implementing monetary policy. Having a liquid market is important for all these purposes and thus of great interest to market participants and policymakers alike.
Measuring Liquidity
Liquidity typically refers to the cost of quickly converting an asset into cash (or vice versa) and is measured in a variety of ways. We consider three commonly used measures, calculated using high-frequency data from the interdealer market: bid-ask spreads, order book depth, and price impact. The measures are for the most recently auctioned
(on-the-run) two-, five-, and ten-year notes (the three most actively traded Treasury securities, as shown in this post) and are calculated for New York trading hours (defined as 7 a.m. to 5 p.m.). Our data source is BrokerTec, which is estimated to account for 80 percent of trading in the electronic interdealer broker market.
The Market Has Been Relatively Illiquid in 2022
The bid-ask spread—the difference between the lowest ask price and the highest bid price for a security—is one of the most popular liquidity measures. As shown in the chart below, bid-ask spreads have widened out in 2022, but have remained well below the levels observed during the COVID-related disruptions of March 2020 (examined in this post). The widening has been somewhat greater for the two-year note relative to its average and relative to its level in March 2020.
Bid-Ask Spreads Have Widened Modestly
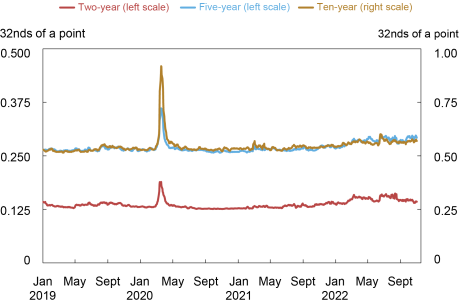
Source: Authors’ calculations, based on data from BrokerTec.
Notes: The chart plots five-day moving averages of average daily bid-ask spreads for the on-the-run two-, five-, and ten-year notes in the interdealer market from January 2, 2019, to October 31, 2022. Spreads are measured in 32nds of a point, where a point equals one percent of par.
The next chart plots order book depth, measured as the average quantity of securities available for sale or purchase at the best bid and offer prices. Depth levels again point to relatively poor liquidity in 2022, but with the differences across securities more striking. Depth in the two-year note has been at levels commensurate with those of March 2020, whereas depth in the five-year note has remained somewhat higher—and depth in the ten-year note appreciably higher—than the levels of March 2020.
Order Book Depth Lowest since March 2020
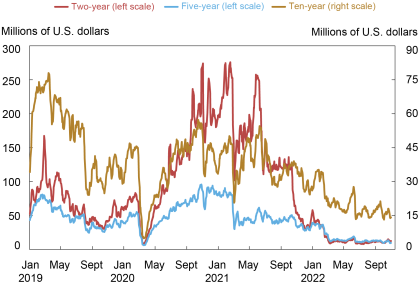
Source: Authors’ calculations, based on data from BrokerTec.
Notes: The chart plots five-day moving averages of average daily depth for the on-the-run two-, five-, and ten-year notes in the interdealer market from January 2, 2019, to October 31, 2022. Data are for order book depth at the inside tier, averaged across the bid and offer sides. Depth is measured in millions of U.S. dollars par.
Measures of the price impact of trades also suggest a notable deterioration of liquidity. The next chart plots the estimated price impact per $100 million in net order flow (that is, buyer-initiated trading volume less seller-initiated trading volume). A higher price impact suggests reduced liquidity. Price impact has been high this year, and again more notably so for the two-year note relative to the March 2020 episode. That said, price impact looks to have peaked in late June and July, and to have declined most recently (in October).
Price Impact Highest since March 2020
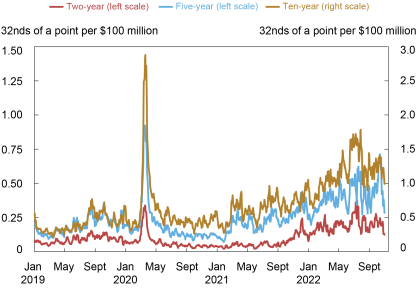
Liberty Street Economics chart plots the estimated price impact per $100 million in net order flow for the two-, five-, and ten-year notes in the interdealer market from January 2, 2019, to October 31, 2022. Source: Authors’ calculations, based on data from BrokerTec.
Notes: The chart plots five-day moving averages of slope coefficients from daily regressions of one-minute price changes on one-minute net order flow (buyer-initiated trading volume less seller-initiated trading volume) for the on-the-run two-, five-, and ten-year notes in the interdealer market from January 2, 2019, to October 31, 2022. Price impact is measured in 32nds of a point per $100 million, where a point equals one percent of par.
Note that we start our analysis of liquidity in this post in 2019 and not earlier. One reason is to highlight the developments in 2022. Another reason is that the minimum price increment for the two-year note was halved in late 2018, creating a break in the note’s bid-ask spread and depth series. Longer time series of bid-ask spreads, order book depth, and price impact are plotted in this post and this paper. The longer history indicates that the price impact in the two-year note is currently at levels comparable to those seen during the 2007-09 global financial crisis, as well as in March 2020.
Volatility Has Also Been High
Pandemic-induced supply disruptions, high inflation, policy uncertainty, and geopolitical conflict have led to a sizable increase in uncertainty about the expected path of interest rates, resulting in high price volatility in 2022, as shown in the next chart. As with liquidity, volatility has been especially high lately for the two-year note relative to its history, likely reflecting the importance of near-term monetary policy uncertainty in explaining the current episode. Volatility has caused market makers to widen their bid-ask spreads and post less depth at any given price (to manage the increased risk of taking on positions), and for the price impact of trades to increase, illustrating the well-known negative relationship between volatility and liquidity.
Price Volatility Highest Since March 2020
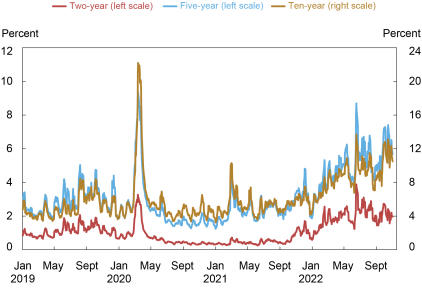
Source: Authors’ calculations, based on data from BrokerTec.
Notes: The chart plots five-day moving averages of price volatility for the on-the-run two-, five-, and ten-year notes in the interdealer market from January 2, 2019, to October 31, 2022. Price volatility is calculated for each day by summing squared one-minute returns (log changes in midpoint prices) from 7 a.m. to 5 p.m., annualizing by multiplying by 252, and then taking the square root. It is reported in percent.
Liquidity Has Tracked Volatility
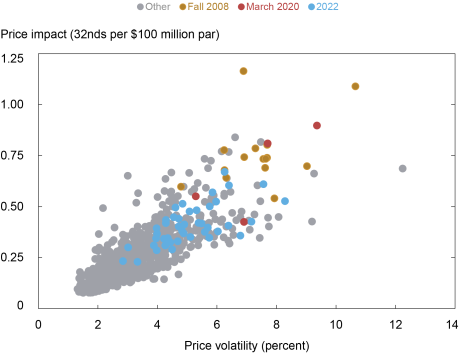
To assess whether liquidity has been unusual given the level of volatility, we provide a scatter plot of price impact against volatility for the five-year note in the chart below. The chart shows that the 2022 observations (in blue) fall in line with the historical relationship. That is, the current level of liquidity is consistent with the current level of volatility, as implied by the historical relationship between these two variables. This is true for the ten-year note as well, whereas for the two-year note the evidence points to somewhat higher-than-expected price impact given the volatility in 2022 (as also occurred in fall 2008 and March 2020).
Liquidity and Volatility in Line with Historical Relationship
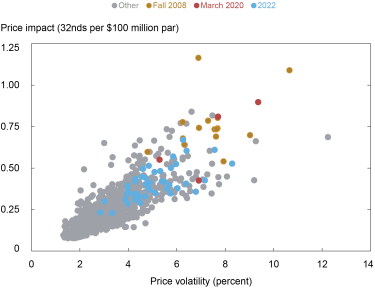
Liberty Street Economics chart plots price impact against price volatility by week for the five-year note from January 2, 2005, to October 28, 2022.
Source: Authors’ calculations, based on data from BrokerTec.Notes: The chart plots price impact against price volatility by week for the on-the-run five-year note from January 2, 2005, to October 28, 2022. The weekly measures for both series are averages of the daily measures plotted in the preceding two charts. Fall 2008 points are for September 21, 2008 – January 3, 2009, March 2020 points are for March 1, 2020 – March 28, 2020, and 2022 points are for January 2, 2022 – October 29, 2022.
The preceding analysis is based on realized price volatility—that is, on how much prices are actually changing. We repeated the analysis with implied (or expected) price volatility, as measured by the ICE BofAML MOVE Index, and found similar results for 2022. That is, liquidity for the five- and ten-year notes is in line with the historical relationship between liquidity and expected volatility, whereas liquidity is somewhat worse for the two-year note.
Note also that while liquidity may not be especially high relative to volatility, one might then ask whether volatility itself is unusually high. Answering this question is beyond our scope here, although we will note that there are good reasons for volatility to be high, as discussed above.
Trading Volume Has Been High
Despite the high volatility and illiquidity, trading volume has held up this year. High trading volume amid high illiquidity is common in the Treasury market, and was also observed during the market disruptions around the near-failure of Long-Term Capital Management (see this paper), during the 2007-09 financial crisis (see this paper), during the October 15, 2014, flash rally (see this post), and during the COVID-19-related disruptions of March 2020 (see this post). Periods of high uncertainty are associated with high volatility and illiquidity but also high trading demand.
Nothing to Be Concerned About?
Not exactly. While Treasury market liquidity has been in line with volatility, there are still reasons to be cautious. The market’s capacity to smoothly handle large flows has been of ongoing concern since March 2020, as discussed in this paper, as Treasury debt outstanding continues to grow. Moreover, lower-than-usual liquidity implies that a liquidity shock will have larger-than-usual effects on prices and perhaps be more likely to precipitate a negative feedback loop between security sales, volatility, and illiquidity. Close monitoring of Treasury market liquidity—and continued efforts to improve the market’s resilience—remain important.
Citation:
“How Liquid Has the Treasury Market Been in 2022?,” Federal Reserve Bank of New York Liberty Street Economics, November 15, 2022, https://libertystreeteconomics.newyorkfed.org/2022/11/how-liquid-has-the-treasury-market-been-in-2022/.