Old School Versus New School are your Investments Inline with the Changing Investor Makeup?
Investing tastes and strategies vary by generation. And as technologies advance and provide self-directed investors with new methodologies, all investors should pay attention to shifts in the marketplace. According to a report by APEX Fintech Solutions, millennials, and Gen Z are gaining wealth at a rate of 25%, while all generations increased at only 16%. There are major implications for market moves as trillions are controlled by those that may have different risk tolerance, different holding periods, or a broadly different knowledge base about many companies and their products.
What Was Measured
The data compiled in the APEX report analyzed more than 1.3 million Gen Z accounts, in addition to
over 4.0 million millennial accounts, 2.0 million held by Gen X, and over half a million baby boomers. The numbers are calculated as of December 31, 2022. It also compared managed accounts to self-directed investments.
The four generations were defined in this way:
Z: Born 1997-2012 (25 and younger) – Generation Z
M: Born 1981-1996 (26-41 years old) – Millenials
X: Born 1965-1980 (42-57 years old) – Generation X
B: Born 1946-1964 (58-76 years old) – Baby Boomers
Notable Investment Trends and Differences
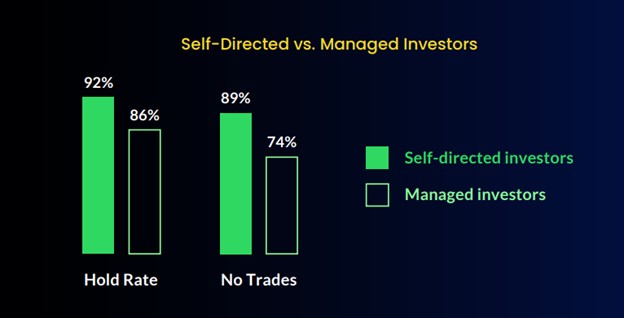
Sifting through the stats (Q1 2020 – Q2 2022) and comparing self-directed investors with professionally managed accounts, self-directed, as a whole, did comparatively little selling at the lows of the stock market during the pandemic-inspired sell-off (early 2020). Instead, the peak in selling (the low for the hold rate) for self-directed accounts came at the height of meme stock and market run-up in Q1 2021. Over the period, including when selling was at its peak, managed accounts consistently were more active, changing and adding to positions at a much higher rate. Self-directed portfolios were more likely to enter a position, hold it and at times add to current positions.
During the last quarter of 2022, the most popular stocks held by all generations remained the same while the companies positioned in the remainder of the account holdings were in flux and altered quite a bit. The top stocks held were Tesla (TSLA), Apple Inc. (AAPL), Amazon.com, Inc. (AMZN) and Microsoft Corp (MSFT); these were core holdings that were barely traded by any generational grouping.
Below these holdings, each generation had different sets of significant shifts, with real estate investment trusts growing for all four generational groups. Industrials and Energy Sectors were also favored across generations, while holdings in service-related industries were reduced. The two strongest performing sectors in Q4, across the generational rankings, were industrials and energy.
Across all generational holdings, industrials were led by General Electric (GE), Lockheed Martin Corp (LMT), Raytheon Technologies Corp (RTX), Boeing Co (BA), and Delta Air Lines, Inc. (DAL), while energy stocks were led by namely Chevron Corporation (CVX) and Exxon Mobil Corp (XOM), and followed closely by BP plc (BP), Energy Transfer LP Unit (ET), and Enterprise Products Partners LP (EPD).
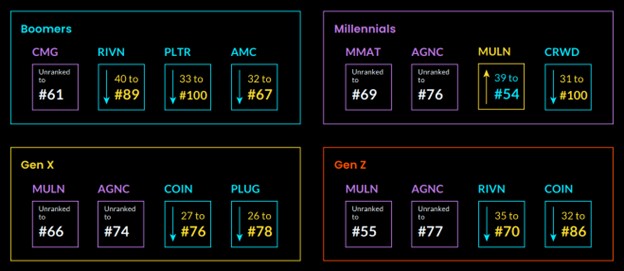
The tickers that dropped the most on the APEX top 100 list included Rivian (RIVN), which dipped an average of 27.8 spots across all generations, followed by AMC, which slipped 11.8 spots lower. For Gen Z, millennials and Gen X they also reduced holdings in TTD , DKNG and RBLX which dropped between 18 to 27 positions lower in the top 100 holdings.
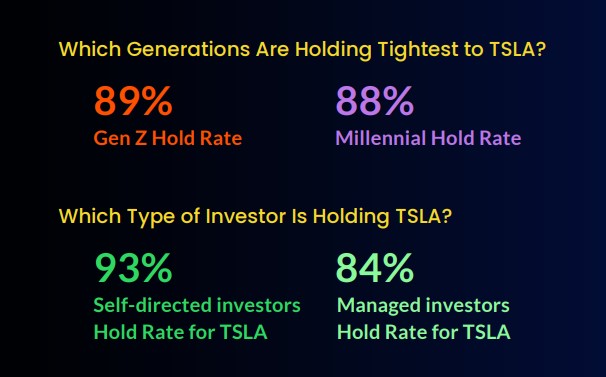
Tesla (TSLA) which had been in the number one position for Gen X and Gen Z, dropped to number two last quarter as Apple (AAPL) regained popularity. TSLA spent nine consecutive quarters in the top spot, all for Gen Z, TSLA had a four-quarter streak. At number two, TSLA is still a popular stock, especially with Millennials and Gen Z, they chose to hold at the highest rates, even as the price plummeted.
For self-directed investors of all ages, the TSLA hold rate is significantly higher (93%) than for investors who use managed brokerage services (84%).
Throughout the fourth quarter of 2022, retail investors displayed a risk-managed approach to trading and strategic investing as they measured recession risks and a changed monetary policy. Millennials were the most active traders in the fourth quarter, the numbers indicate they were engaged and paid attention as market conditions evolved.
Take Away
There are two big takeaways from the study, the first is that retail investors are gaining power and have become savvier and in tune with smart investing.
The second takeaway is related to the first. Since the start of 2020, combined assets for all generations have risen 16% to $52.4 trillion. Two age groupings, millennials and Gen Z, are gaining wealth at a much higher 25% pace. The massive shift in market power is unfolding and has major implications for how, when, and why investments are transacted.
The markets are mostly up on the year, with stocks around 5.5% higher, bonds and the $ U.S. dollar near 1%, and bitcoin near 46.5% above the December 31st level. Last week there was concern that the positive start most asset classes had at the beginning of the year is going to give a sizeable portion back, perhaps all and then some. This concern was heightened by a measure that shows that inflation’s decline may be tacking higher. There are no inflation reports scheduled in the upcoming week to worry about, and few Fed President addresses to be concerned with.
Monday 2/27
8:30 AM ET, Durable Goods Orders are expected to have dropped off by 4% in January. They had surged in December primarily because of aircraft orders. When transportation is removed to reveal the core Durable Goods reading, it is expected to be flat with no change from the prior month’s volume of orders.
10:00 AM ET, The National Association of Realtors is expected to report that Pending Home Sales rose 1% in January from the prior month. This level increase would be at a slower pace than the 2.5% increase in the prior period.
10:30 AM ET, The Dallas Fed Manufacturing Survey is expected to have declined for the ninth consecutive month. The consensus among economists is down 9.0 versus down 8.4.
Tuesday 2/28
8:30 AM ET, International Trade in Goods is expected to widen as economists expect exports to have fallen off. The expectation of a $91 billion trade deficit for the U.S. in January is $1.3 billion wider than December’s measurements.
9:45 PM ET, The Institute for Supply Management uses a survey to create a composite of business conditions in the Chicago area. The leading indicator is expected to come in at 45 for February, which would be an uptick from January’s 44.3.
10:00 AM ET, Consumer Confidence has been falling; the report released on Tuesday is expected to show a rise of 1.3 points to 108.4.
1:00 PM ET, Money Supply (M1 and M2) are measures of liquidity, it includes household savings, savings and checking deposits, and money market mutual funds. Over the past few years, money supply measures weren’t getting much attention. As households are dealing with rising prices, it may be interesting for investors to see if amounts immediately available to households are declining at a pace that may begin to hamper spending and economic growth.
Wednesday 3/01
10:00 PM ET, The ISM Manufacturing Index surveys business nationally to get the pulse on expected business levels. The forward-looking indicator is expected to have improved to 47.9 versus 47.4 the prior month.
Thursday 3/02
8:30 AM ET, Jobless Claims have been a nail-biter number recently, often well off of expectations. For the week ending February 25th, claims are supposed to show an increase in claims to 200,000.
Friday 3/03
10:00 AM ET, ISM Services Index had a strong January at 55.2, it is expected to trail off some and have a February reading of 54.5.
12:00 PM, Atlanta Federal Reserve President Raphael Bostic has been rattling markets with his ongoing and perhaps heightened hawkish rhetoric. FOMC member Bostic is not a voting member, but his words have the power to move markets.
4:15 PM, Thomas Barkin is the Richmond Federal Reserve President. He is scheduled to speak after the market closes. If the Fed is looking to adjust expectations before its late March meeting, FOMC member Barkin may be one that carries that message.
What Else
Earnings reports will continue with some of the most watched being Occidental Petroleum (OXY), and Zoom (Z.M.) on Monday. Retailer Target (TGT) reports on Tuesday, Salesforce (CRM), and NIO (NIO) on Wednesday , and Anheiser Busch (BUD) on Thursday.
The U.S. Supreme Court will begin hearing two cases on student loan debt forgiveness beginning on Tuesday. Expect some non-market-moving discourse on this subject during the week.
Toronto, Ontario, February 24, 2023 – Aurania Resources Ltd. (TSXV: ARU; OTCQB: AUIAF; Frankfurt: 20Q) (“Aurania” or the “Company”) is pleased to announce that it will be attending the Prospector’s and Developers International Convention (PDAC) being held March 5th – 8th, 2023 at the Metro Toronto Convention Centre (MTCC) in Toronto, Canada.
PDAC Booth Location
Aurania will be exhibiting at booth 2948 in the Investors Exchange located in the MTCC South Building, Level 800. Please note our new booth location. For more information about PDAC and registration, please visit https://www.pdac.ca/convention/registration.
March 5th – 5:00pm Shareholder Meet and Greet with Management
Aurania is hosting a meet-and-greet for shareholders on Sunday, March 5th from 5:00pm-8:00pm in Salon 1, 19th Floor, at The Fairmont Royal York Hotel, 100 Front Street West, Toronto, Ontario. Due to capacity limitations, we kindly ask that you confirm your attendance no later than March 1st by RSVP to info@aurania.com.
March 6th – 9:05am Ecuador Day
Ecuador Day will take place on Monday, March 6th at 8:00am ET in Room 206F at the MTCC. Ecuador Day is being organized and hosted by the Ecuador Chamber of Mines and will run from 8:00am-12:00pm. Representatives from the Government of Ecuador are expected to provide an update on the mining industry in Ecuador during this event.
March 7th – 10:00am Panel on Planning for Sustainable Mineral Development 101
Aurania’s Head of CSR, Ms. Carolina Lasso, has been invited to participate in a session sub-topic titled “Setting the stage for success with the S in ESG: Engagement and agreement making in early exploration” on Tuesday, March 7th at 10:00am in Room 715 at the MTCC.
ERM – Environmental Resources Management has put together this two-hour lightning talks panel in collaboration with the PDAC Sustainability Committee. The panel will feature key sub-topics within the sustainable mining framework explored by junior companies, community members, investors, and expert speakers. Click here for more information:
Aurania is a mineral exploration company engaged in the identification, evaluation, acquisition and exploration of mineral property interests, with a focus on precious metals and copper in South America. Its flagship asset, The Lost Cities – Cutucu Project, is located in the Jurassic Metallogenic Belt in the eastern foothills of the Andes mountain range of southeastern Ecuador.
Information on Aurania and technical reports are available at www.aurania.com and www.sedar.com, as well as on Facebook at https://www.facebook.com/auranialtd/, Twitter at https://twitter.com/auranialtd, and LinkedIn at https://www.linkedin.com/company/aurania-resources-ltd-.
For further information, please contact:
Carolyn Muir
VP Corporate Development & Investor Relations
Aurania Resources Ltd.
(416) 367-3200
carolyn.muir@aurania.com
Neither the TSX-V nor its Regulation Services Provider (as that term is defined in the policies of the TSX-V) accepts responsibility for the adequacy or accuracy of this release.
RICHMOND, Va.–(BUSINESS WIRE)– Bowlero Corp., (NYSE: BOWL) the global leader in bowling entertainment, completed the acquisition of The Big Event in New Jersey on February 14th. This announcement marks the Company’s first completed acquisition in calendar year 2023, out of a robust pipeline of remaining acquisitions.
Brett Parker, President & Chief Financial Officer of Bowlero Corp., stated, “Today’s announcement illustrates our continued commitment to expanding our unit base and simultaneously improving our average unit volumes.”
The Big Event is located in Cherry Hill, NJ, 20 miles outside of Philadelphia. This impressive 36 lane center features billiards, ping pong, shuffleboard, arcade games and VIP private event rooms. The acquisition of The Big Event marks the Company’s 10th location in the state of New Jersey. This center opened under Bowlero Corp. management on Friday, February 17th.
Parker stated in closing, “We look forward to welcoming this center to our growing national footprint and, as always, we remain focused on growth while continuing to prioritize a world-class experience for our guests.”
Thus far in fiscal year 2023 Bowlero Corp completed 12 acquisitions.
About Bowlero Corp Bowlero Corp. is the global leader in bowling entertainment, media, and events. With more than 325 bowling centers across North America, Bowlero Corp. serves more than 30 million guests each year through a family of brands that includes Bowlero, Bowlmor Lanes, and AMF. In 2019, Bowlero Corp. acquired the Professional Bowlers Association, the major league of bowling, which boasts thousands of members and millions of fans across the globe. For more information on Bowlero Corp., please visit BowleroCorp.com
Mark Reichman, Senior Research Analyst, Natural Resources, Noble Capital Markets, Inc.
Refer to the full report for the price target, fundamental analysis, and rating.
Significant progress at Kingsway. Exploration and drilling at the company’s 100%-owned Kingsway gold project is targeting the Appleton Fault over a 12-kilometer strike length. With approximately $17 million in cash, Labrador Gold has ample financial resources to fund the remaining 34,000 meters of drilling of the company’s planned 100,000-meter drill program.
2023 drilling program. Drilling will continue this year at the Big Vein target and further drilling will be undertaken at the Midway and Pristine targets. Labrador Gold currently has two drill rigs deployed at the Big Vein target. The company expects to add a third rig to drill northeast of the Pristine target which could later move to the Midway target, and a fourth rig to drill in an area (“The Gap”) between Big Vein and Pristine.
Equity Research is available at no cost to Registered users of Channelchek. Not a Member? Click ‘Join’ to join the Channelchek Community. There is no cost to register, and we never collect credit card information.
This Company Sponsored Research is provided by Noble Capital Markets, Inc., a FINRA and S.E.C. registered broker-dealer (B/D).
*Analyst certification and important disclosures included in the full report. NOTE: investment decisions should not be based upon the content of this research summary. Proper due diligence is required before making any investment decision.
FAT Brands (NASDAQ: FAT) is a leading global franchising company that strategically acquires, markets, and develops fast casual, quick-service, casual dining, and polished casual dining concepts around the world. The Company currently owns 17 restaurant brands: Round Table Pizza, Fatburger, Marble Slab Creamery, Johnny Rockets, Fazoli’s, Twin Peaks, Great American Cookies, Hot Dog on a Stick, Buffalo’s Cafe & Express, Hurricane Grill & Wings, Pretzelmaker, Elevation Burger, Native Grill & Wings, Yalla Mediterranean and Ponderosa and Bonanza Steakhouses, and franchises and owns over 2,300 units worldwide. For more information on FAT Brands, please visit www.fatbrands.com.
Joe Gomes, Managing Director – Generalist Analyst, Noble Capital Markets, Inc.
Joshua Zoepfel, Research Associate, Noble Capital Markets, Inc.
Refer to the full report for the price target, fundamental analysis, and rating.
4Q22 Results. FAT Brands reported 4Q22 revenue of $103.8 million, up 39.9% y-o-y from $74.2 million in the year ago quarter. The increased revenue reflects the 2021 acquisitions and ongoing recovery from COVID impacts as SSS was up 2.7%. FAT reported adjusted EBITDA of $19.6 million in the quarter, down from $24.6 million in 3Q22. Net loss for the quarter was $70.8 million, or a loss of $4.29 per share, compared to a net loss of $19.6 million, or a loss of $1.38 per share, last year. We had projected revenue of $104.8 million and a net loss of $16.5 million, or a loss of $0.99 per share.
One-Time Items Impact. The quarter’s results were impacted by a number of one-time non-cash charges, including a $16.1 million non-cash reserve on employee retention credits, a $14 million non-cash trademark impairment charge, and a $20.4 million valuation allowance.
Equity Research is available at no cost to Registered users of Channelchek. Not a Member? Click ‘Join’ to join the Channelchek Community. There is no cost to register, and we never collect credit card information.
This Company Sponsored Research is provided by Noble Capital Markets, Inc., a FINRA and S.E.C. registered broker-dealer (B/D).
*Analyst certification and important disclosures included in the full report. NOTE: investment decisions should not be based upon the content of this research summary. Proper due diligence is required before making any investment decision.
Cumulus Media (NASDAQ: CMLS) is an audio-first media company delivering premium content to over a quarter billion people every month — wherever and whenever they want it. Cumulus Media engages listeners with high-quality local programming through 406 owned-and-operated radio stations across 86 markets; delivers nationally-syndicated sports, news, talk, and entertainment programming from iconic brands including the NFL, the NCAA, the Masters, CNN, the AP, the Academy of Country Music Awards, and many other world-class partners across more than 9,500 affiliated stations through Westwood One, the largest audio network in America; and inspires listeners through the Cumulus Podcast Network, its rapidly growing network of original podcasts that are smart, entertaining and thought-provoking. Cumulus Media provides advertisers with personal connections, local impact and national reach through broadcast and on-demand digital, mobile, social, and voice-activated platforms, as well as integrated digital marketing services, powerful influencers, full-service audio solutions, industry-leading research and insights, and live event experiences. Cumulus Media is the only audio media company to provide marketers with local and national advertising performance guarantees. For more information visit www.cumulusmedia.com.
Michael Kupinski, Director of Research, Noble Capital Markets, Inc.
Patrick McCann, Research Associate, Noble Capital Markets, Inc.
Refer to the full report for the price target, fundamental analysis, and rating.
Better than expected Q4. The company reported Q4 revenue of $251.3 million, roughly flat with the year earlier quarter. Excluding political revenue of $8.3 million, Q4 revenue was down a modest 3% from the prior year period. Adj. EBITDA of $42.7 million was down a modest 1.2%. Both Q4 revenues and Adj. EBITDA beat our expectations, by 4.3% and 13.9%, respectively.
National underperformed. Excluding Political advertising, National advertising, including Network, decreased %. Cumulus is heavily weighted to National/Network advertising, accounting for 45% of total revenues. For many in the industry, National is a more modest 12% to 15% of total advertising.
Equity Research is available at no cost to Registered users of Channelchek. Not a Member? Click ‘Join’ to join the Channelchek Community. There is no cost to register, and we never collect credit card information.
This Research is provided by Noble Capital Markets, Inc., a FINRA and S.E.C. registered broker-dealer (B/D).
*Analyst certification and important disclosures included in the full report. NOTE: investment decisions should not be based upon the content of this research summary. Proper due diligence is required before making any investment decision.
Mark Reichman, Senior Research Analyst, Natural Resources, Noble Capital Markets, Inc.
Refer to the full report for the price target, fundamental analysis, and rating.
Fourth quarter and full year 2022 financial results. Coeur reported adjusted fourth quarter and full year 2022 losses per share of $(0.06) and $(0.32), respectively, and in line with our estimates. Fourth quarter and full year adjusted EBITDA were $35.9 million and $139.0 million. Full year gold and silver ounces produced were 330.3 thousand and 9.8 million, respectively, while ounces sold were 330.0 thousand and 9.8 million. Free cash flow during the fourth quarter and full year 2022 amounted to $(84.5) million and $(326.7) million due in part to heavy capital expenditures of $113.1 million and $352.4 million, respectively. On balance, financial results were in line with our expectations.
Completion of the Rochester expansion is expected by mid-2023. As of December 31, 2022, approximately $605 million of the $650 million to $670 million project cost has been committed, while $494 million had been incurred.
Equity Research is available at no cost to Registered users of Channelchek. Not a Member? Click ‘Join’ to join the Channelchek Community. There is no cost to register, and we never collect credit card information.
This Research is provided by Noble Capital Markets, Inc., a FINRA and S.E.C. registered broker-dealer (B/D).
*Analyst certification and important disclosures included in the full report. NOTE: investment decisions should not be based upon the content of this research summary. Proper due diligence is required before making any investment decision.
Baudax Bio is a pharmaceutical company focused on innovative products for acute care settings. ANJESO is the first and only 24-hour, intravenous (IV) COX-2 preferential non-steroidal anti-inflammatory (NSAID) for the management of moderate to severe pain. In addition to ANJESO, Baudax Bio has a pipeline of other innovative pharmaceutical assets including two novel neuromuscular blocking agents (NMBs) and a proprietary chemical reversal agent specific to these NMBs. For more information, please visit www.baudaxbio.com.
Gregory Aurand, Senior Research Analyst, Healthcare Services & Medical Devices, Noble Capital Markets, Inc.
Refer to the full report for the price target, fundamental analysis, and rating.
Baudax Bio reported 4Q 2022. While we had removed 4Q ANJESO revenues with the announced ANJESO discontinuation at the end of December, the Company reported 4Q revenues of $0.310 million in the quarter. Net loss per share for 4Q 2022 was $12.33 per share as compared to our outlook of $9.76 per share loss as the Company took additional write-offs related to ANJESO.
Baudax Bio reported full year 2022. For the year 2022, Baudax Bio generated revenues of $1.27 million, up from $1.08 million in the 2021 year. The Company took a write-down for impairment of intangibles of $19.7 million. The full year impairment write-down for property and equipment totaled $4.2 million. The reported full year 2022 net loss was $58.8 million or a loss of $177.30 per share compared to our full year 2022 expected loss of $55.3 million or $189.44 per share.
Equity Research is available at no cost to Registered users of Channelchek. Not a Member? Click ‘Join’ to join the Channelchek Community. There is no cost to register, and we never collect credit card information.
This Company Sponsored Research is provided by Noble Capital Markets, Inc., a FINRA and S.E.C. registered broker-dealer (B/D).
*Analyst certification and important disclosures included in the full report. NOTE: investment decisions should not be based upon the content of this research summary. Proper due diligence is required before making any investment decision.
ACCO Brands Corporation is one of the world’s largest designers, marketers and manufacturers of branded academic, consumer and business products. Our widely recognized brands include AT-A-GLANCE®, Esselte®, Five Star®, GBC®, Kensington®, Leitz®, Mead®, PowerA®, Quartet®, Rapid®, Rexel®, Swingline®, Tilibra®, and many others. Our products are sold in more than 100 countries around the world. More information about ACCO Brands, the Home of Great Brands Built by Great People, can be found at www.accobrands.com.
Joe Gomes, Managing Director – Generalist Analyst, Noble Capital Markets, Inc.
Joshua Zoepfel, Research Associate, Noble Capital Markets, Inc.
Refer to the full report for the price target, fundamental analysis, and rating.
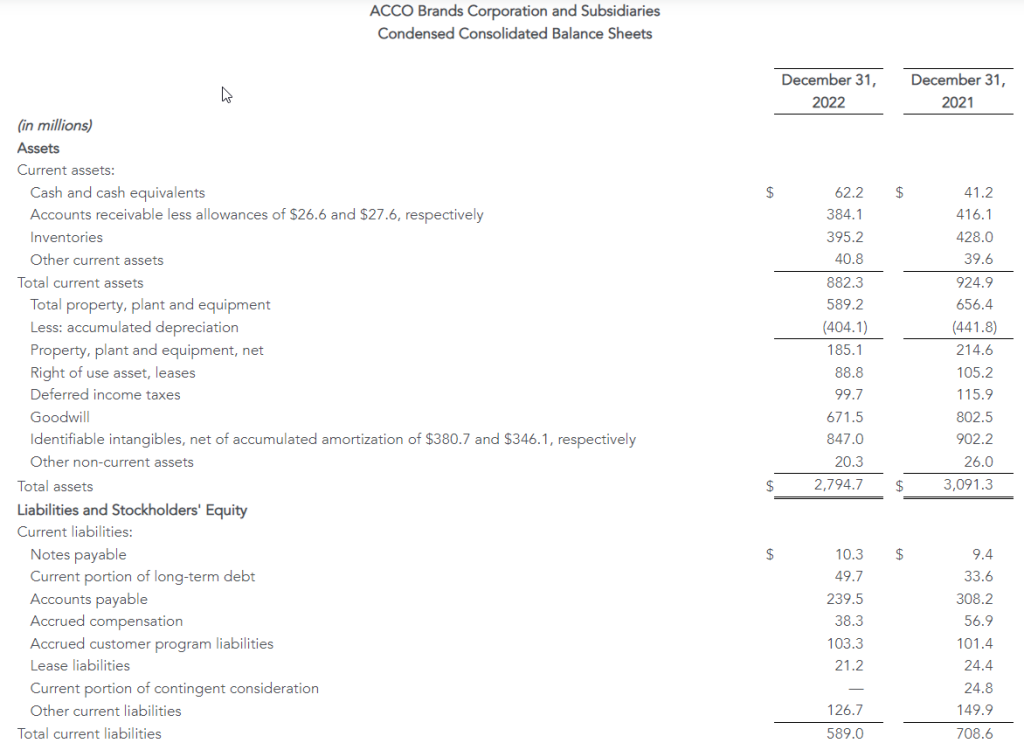
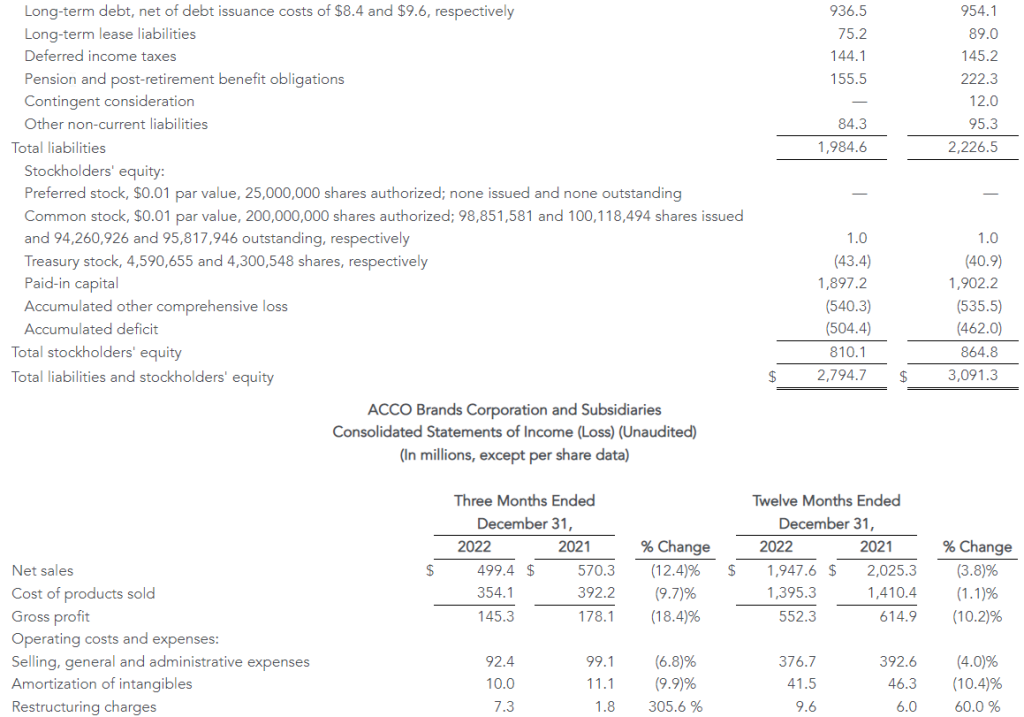
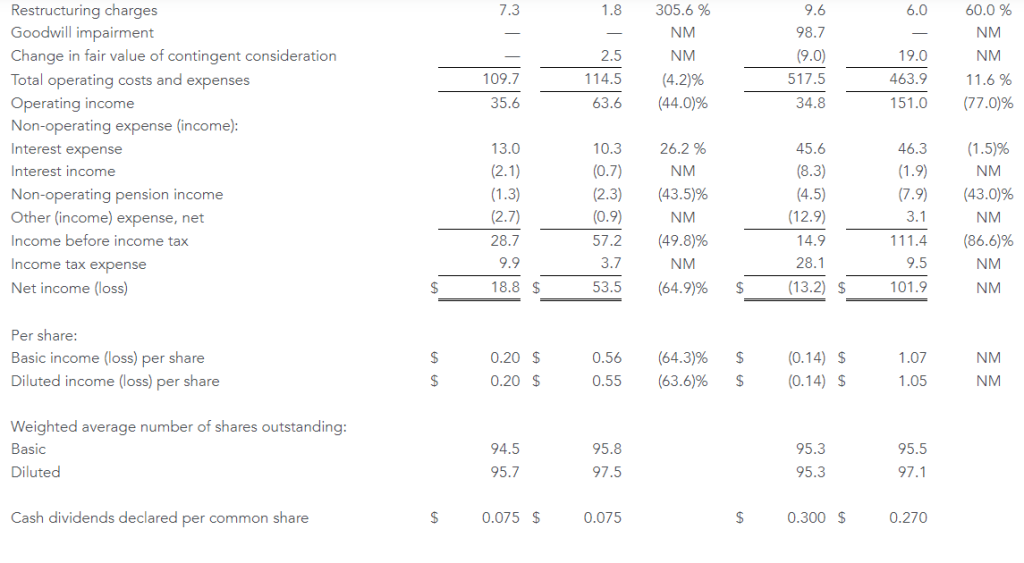
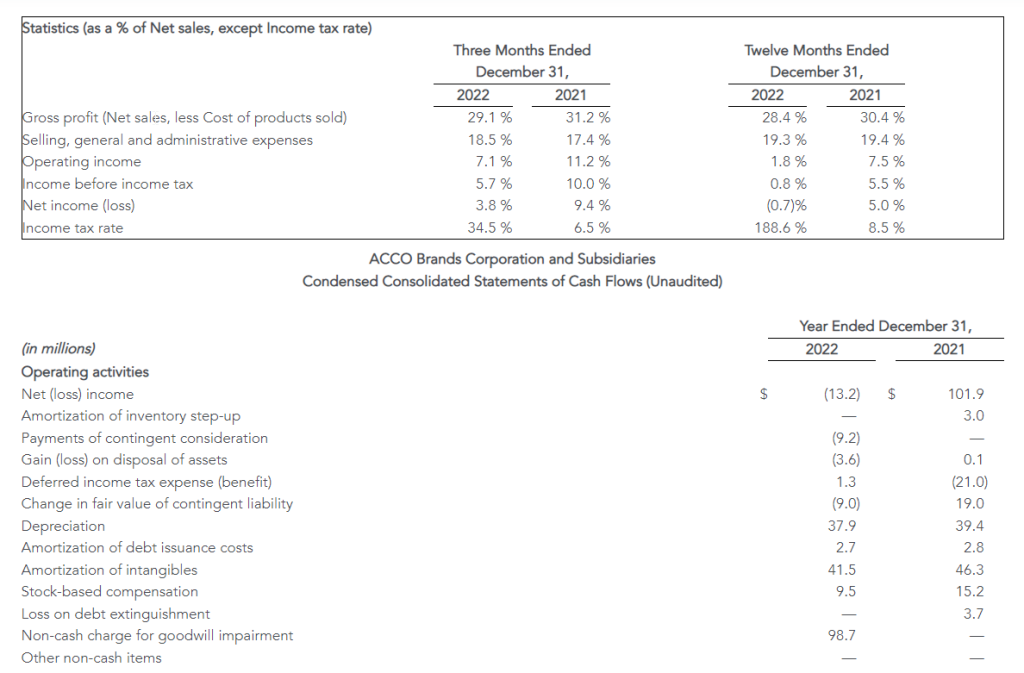
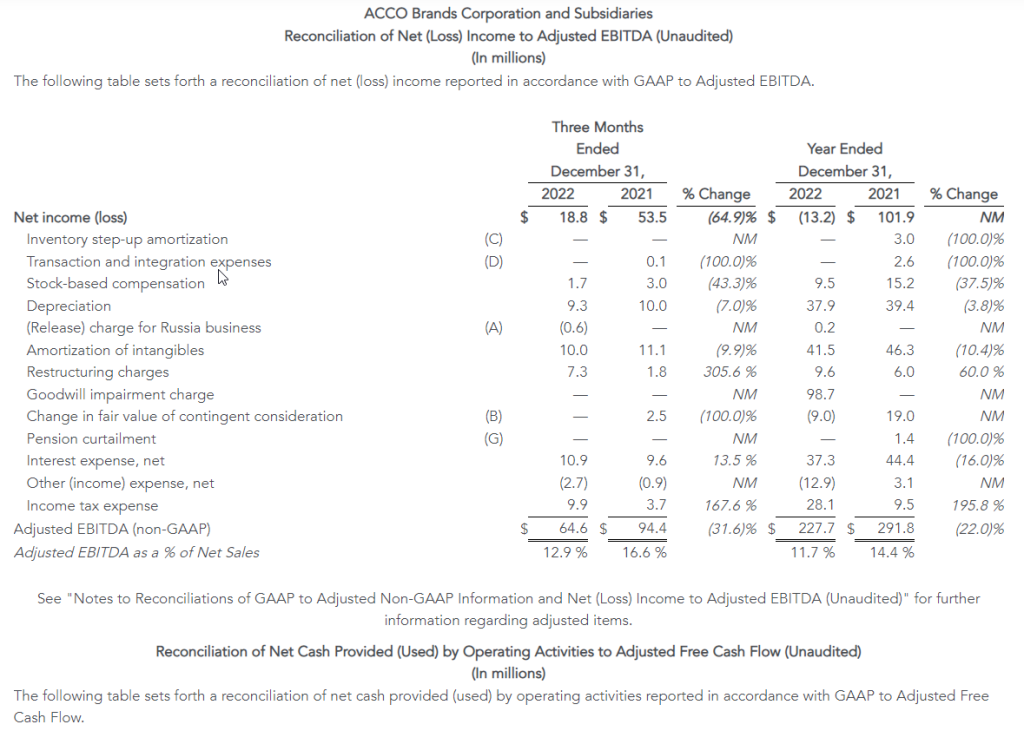
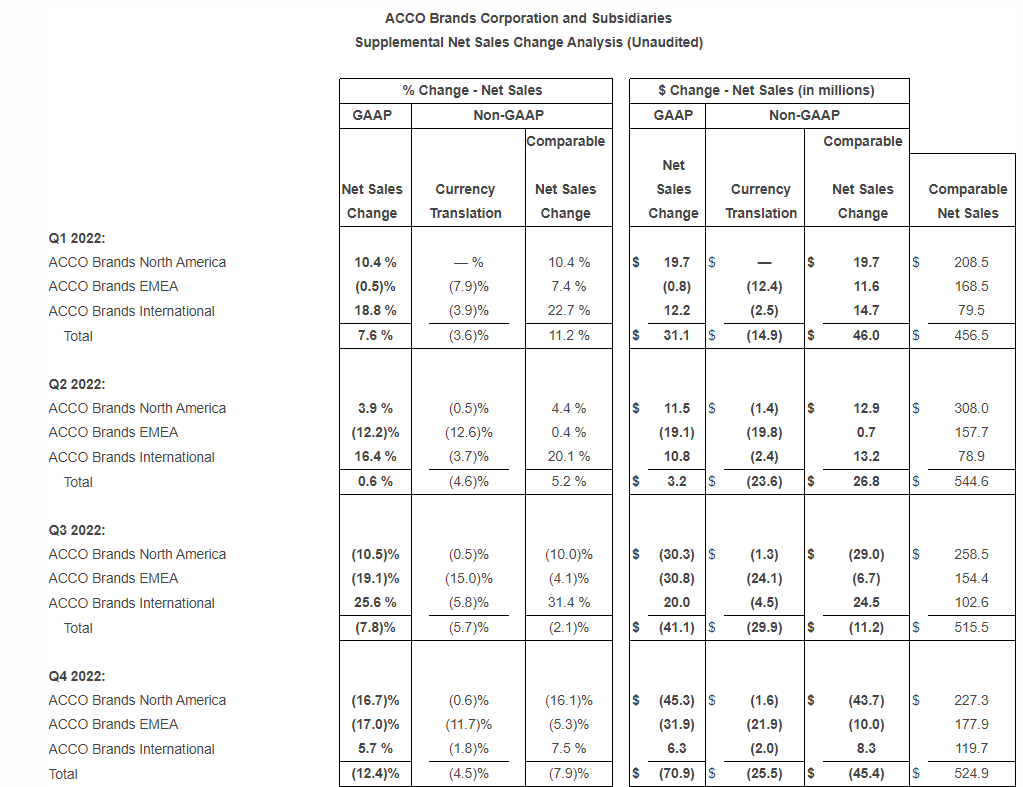
4Q Results. ACCO Brands posted net sales of $499.4 million, a decrease of 12.4% from the prior year’s $570.3 million. Operating income for the quarter was at $35.6 million versus $63.6 million the prior year due to lower sales volumes and higher inflation. Net income was reported at $18.8 million, or $0.20 per diluted share, compared to $53.5 million, or $0.55/sh, last year. We estimated revenue of $510.0 million, operating income of $47 million, net income of $26 million, and EPS of $0.28.
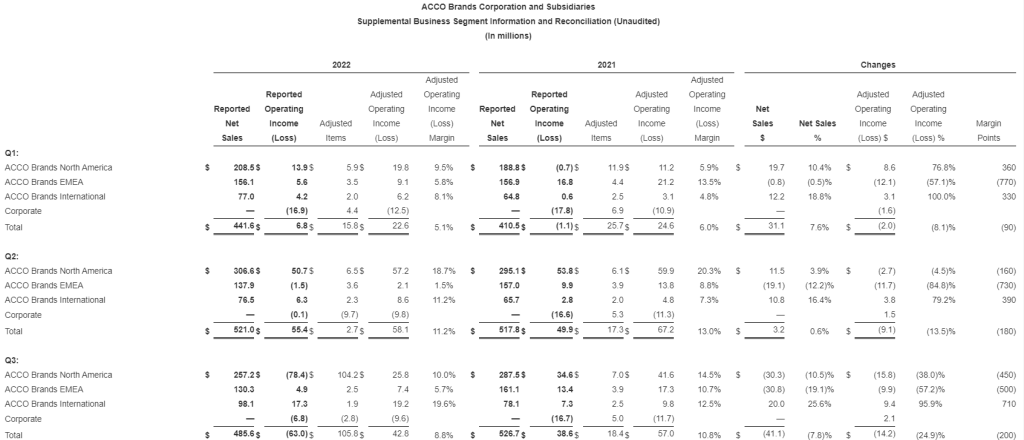
Revenue Segments. North America saw a decrease in sales to $225.7 million versus $271.0 million the prior year with operating income of $8.9 million versus $34.2 million a year ago. EMEA sales were $156.0 million versus $187.9 million the year prior, with operating income of $12.7 million versus $21.6 million. Lastly, International had sales of $117.7 million, an increase from last year’s $111.4 million, with operating income of $22.7 million, an increase over last year’s $20.9 million.
Equity Research is available at no cost to Registered users of Channelchek. Not a Member? Click ‘Join’ to join the Channelchek Community. There is no cost to register, and we never collect credit card information.
This Company Sponsored Research is provided by Noble Capital Markets, Inc., a FINRA and S.E.C. registered broker-dealer (B/D).
*Analyst certification and important disclosures included in the full report. NOTE: investment decisions should not be based upon the content of this research summary. Proper due diligence is required before making any investment decision.
Use of Psychedelics to Treat PTSD, OCD, Depression and Chronic Pain – a Researcher Discusses Recent Trials, Possible Risks
New research is exploring whether psychedelic drugs, taken under strict medical supervision, might help in treating post-traumatic stress disorder, chronic pain, depression and obsessive-compulsive disorder. Dr. Jennifer Mitchell – a professor in the Departments of Neurology and Psychiatry & Behavioral Science in the School of Medicine at the University of California, San Francisco was interviewed by SciLine. She discusses what scientists have found to date about the effectiveness of these drugs in treating these disorders and how best for them to be administered. Highlights and key excerpts of the interview have been transcribed and published below.
What are psychedelic drugs and how do they work?
Dr. Jennifer Mitchell: Psychedelic basically means “mind manifesting,” suggesting that the compound assists one in uncovering subject matter that perhaps is otherwise deeply hidden from the conscious mind.
It’s a slightly different term from hallucinogen, which you see used almost interchangeably at times with the term psychedelic.
A hallucinogen by definition is something that makes you see, hear, smell something that isn’t otherwise there, so you can imagine there’s a lot of overlap between psychedelics and hallucinogens.
Which types of psychedelic drugs are being studied by researchers for potential therapeutic use?
Dr. Jennifer Mitchell: The two most well studied drugs at this point are MDMA and psilocybin.
MDMA is being evaluated mainly for treatment of post-traumatic stress disorder treatments, and psilocybin mainly for treatment of resistant depression and major depressive disorder.
MDMA is the furthest along because there’s phase 3 data (data from late-stage research) and the possibility that a new drug application would be submitted to the FDA sometime later this year.
LSD is also being evaluated for a number of different indications, most notably obsessive-compulsive disorder.
And then a couple of sort of heavier hitters are now being tested in primarily healthy control populations, including drugs like mescaline and ayahuasca.
What have scientists discovered about whether these drugs are effective in treating health problems like PTSD or chronic pain?
Dr. Jennifer Mitchell: The drugs so far appear to be quite effective. I think one key, though, is that they’re typically being administered in conjunction with some form of psychotherapy.
So it’s important to keep that in mind when we look at the results from some of these recent trials that these are not drugs that are being administered in isolation. You are not taking home a bottle of pills and taking those twice a day as you would, say, an antidepressant. These are administered in a very particular way.
What is involved in therapeutic treatment using these drugs?
Dr. Jennifer Mitchell: Typically, prior to taking the drug at all, subjects participate in a number of preparatory sessions so that they understand a little bit about what is going to happen on an experimental session day.
And then subjects come into a room that looks very much like a comfortable living room, and they spend all day there. The drug is administered typically in the morning. For psilocybin, you’re looking at a six-hour dosing session, and for MDMA, an eight-hour dosing session.
You are in the company of a group of trained providers: therapists, psychedelic facilitators, psychiatrists and clinical research coordinators.
What are the potential risks of using psychedelic drugs for therapeutic purposes?
Dr. Jennifer Mitchell: One concern we’ve had is cardiovascular risk, and so we are taking great care in some of the clinical trials at present to evaluate cardiovascular burden, including heart attack risk, during and after the experiment. This evaluation includes tracking the heart rate and blood pressure of the participants.
In addition, researchers are worried about suicidality, in part because these are treatment-resistant populations that we’re starting off with, and so there’s a concern that perhaps, if they’re destabilized – either by the psychedelic, or just by tapering off their other meds in order to be part of a psychedelic trial – that we could run the risk of suicidality.
Lastly, I think the FDA has been concerned about the possibility that psychedelics are addictive, and so we’ve been following up with study participants to ensure that they aren’t engaging in drug seeking or drug taking outside of the study.
What do we know about the safety of taking psychedelics outside the clinical context?
Dr. Jennifer Mitchell: I think we’ve all heard stories from the ‘60s and ’70s of people taking psychedelics and having very bad experiences. What we know now is that the environment in which you take the psychedelic is of the utmost importance. It’s not appropriate at this point to try to take some of these substances or replicate some of these protocols on your own without oversight.
Watch the full interview to hear more about psychedelic medicine.
SciLine is a free service based at the nonprofit American Association for the Advancement of Science that helps journalists include scientific evidence and experts in their news stories.
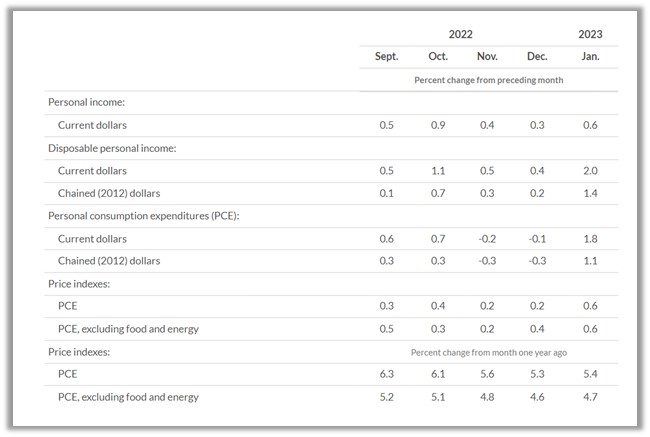
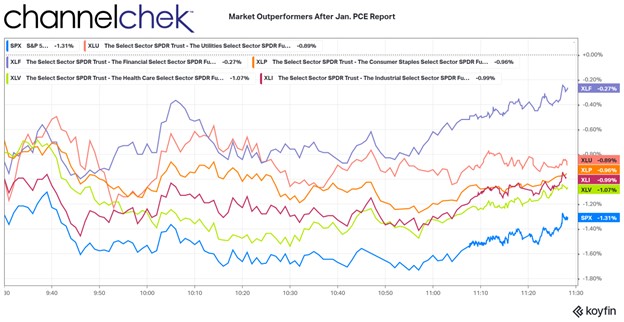
What Sectors Outperformed the Market after the PCE Inflation Shock?
When an investor inquires, “What stocks do well with high inflation?” they are often asking, “What sectors do well with rising interest rates?,” because inflation expectations often drive rate moves. The text book response usually given are: consumer staples, banks and financials, and commodities. The PCE indexes are considered the Fed’s preferred indicator of inflation trends. The PCE surprised markets on the high side when released on February 24th. What can investors now expect from higher-than-forecast inflation?
Rather than look at old information on what outperforms the overall market when inflation expectations rise, I thought it would be informative and more useful to see what is outperforming under current 2023 conditions and climate. The chart below and the remainder of this simple study is a snapshot three hours after the news settled in among investors (11:30am ET, February 24th).
There were five S&P sectors that outperformed the S&P 500 a few hours after the inflation number showed an almost across-the-board acceleration in price increases. At this point, the S&P 500 had already fallen 1.31%.
Beating the S&P larger index, but the worst of the five outperformers was Health Care (XLV). The Health sector is considered to be a necessity that consumers find a means to pay for regardless of cost. Within the sector there are companies providing goods and services that are more embraced by investors than others. Within the XLV, many stocks were green after the report.
Outperforming the Health Care sector were stocks making up the Industrial Sector (XLI). This includes large industrial manufacturers like John Deere, General Electric, and Caterpillar. Many of these companies have contracts well out into the future that assures business. What is not ordinarily assured is the cost of manufacturing which can go up with inflation. A number of the top holdings in XLI barely budged on the morning – GE was up .08%, Honeywell was down .18%, and UPS was down just .20%.
Almost even with the Industrial Sector was Consumer Staples (XLP). As with Health Care and to a lesser degree Industrials this sector is where money moves to during inflationary periods. Consumers may be postpone a new car purchase, but they’ll keep their buying habits unchanged for products produced by Colgate, Coca-Cola, Proctor and Gamble, or cigarette manufacturers.
Performing second best after the inflation numbers was the Utility sector (XLU). Again this follows the mindset that consumers can only cutback on water, electricity, and natural gas so much. It is more likely that cutbacks would come in other areas like entertainment, or technology. Technology was the worst performing sector.
The top performer, although still modestly negative, was the Financial sector. This includes insurance, banks and credit card companies, as well as investment firms. Banks, particularly those with a higher percentage of traditional banking business, benefit from a steepening yield curve. Banks use cash as their product line. They borrow short from customers, and lend longer term. As the yield curve steepens, their net income can be expected to rise. This may explain why two of the top three holdings were positive after the report, JP Morgan (JPM), and Wells Fargo (WFC). Brokerage firms also may benefit as accounts uninvested balances can be a source of revenue as financial firms earn interest on them. Rising rates means every balance they can earn on creates additional income.
Larger Index Observations
As indicated earlier, technology was the worst-performing sector. This causes the tech heavy Nasdaq to far underperform the other major indexes. The best performing a few hour after the open was the Dow Industrials, which is comprised of just 30 industrial stocks, many paying consistent dividends. The second best performer, beating both the Dow and S&P 500 was the Russell 2000 Small-Cap index. Small-cap stocks tend to be less affected when borrowing costs change, and tend to have more of their end customers located domestically. The U.S.-based customers is an advantage to smaller stocks when rising rates cause rising dollar values. A rising dollar makes goods or services from the U.S. more expensive overseas.
Take Away
The textbook reply to questions related to rising rates, inflation, and sector rotation in stocks held up after the surprise PCE index increase. Banks, and necessities like heat and consumer goods outperformed. Also small-cap stocks did not disappoint, they also held up better than the overall large cap universe.
One difficulty small and even microcap investors face is that information is less available on many of these companies. And there are a lot of them, including in the sectors that outperform with inflation. One easy way to find which smaller companies are rising to the top is Channelchek’s Market Movers tab. This can be viewed throughout the trading day by clicking here for the link.
Net sales were $1.95 billion, down 4 percent; comparable sales up 1 percent
Gained market share across multiple product categories in North America in 2022
Achieved quarterly sequential margin improvement in EMEA as pricing actions took hold
Realized double-digit sales and profit growth in the International segment
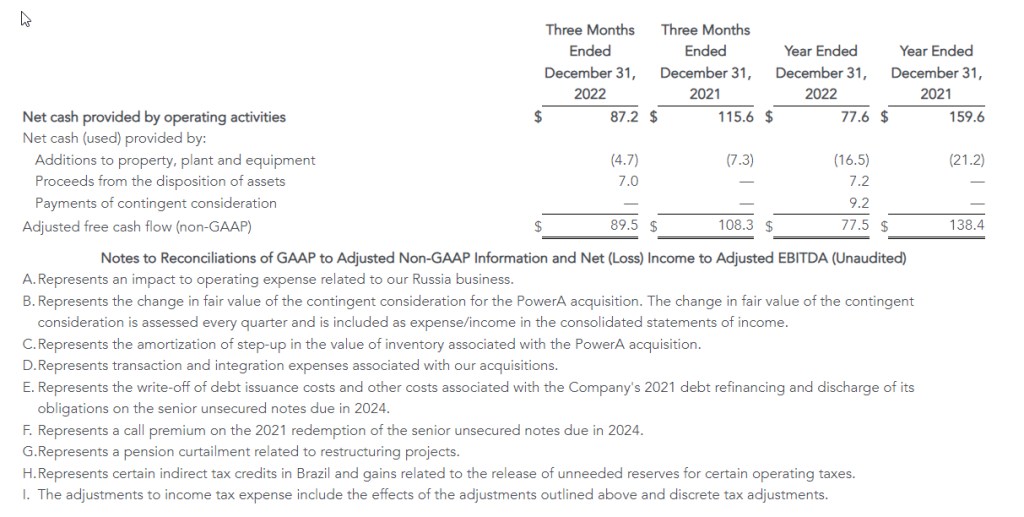
Generated $78 million of cash from operations; adjusted free cash flow of $78 million
During fourth quarter of 2022 actioned annual cost savings of $13 million from significant restructuring initiatives
Full year 2023 outlook anticipates margin expansion and profit growth
LAKE ZURICH, Ill.–(BUSINESS WIRE)– ACCO Brands Corporation (NYSE: ACCO) today announced its fourth quarter and full year results for the period ended December 31, 2022.
“We delivered 1% comparable sales growth in 2022 as we continue to execute on our strategic transformation, including expanding our product categories, broadening our geographic reach and bringing innovative new consumer-centric products to market. This enabled us to achieve market share gains with many of our brands, including Five Star®, Kensington®, Mead®, Quartet® and AT-A-GLANCE®. These successes give us confidence that our strategy of being a more consumer, brand and technology centric company and our portfolio of strong brands will position us to deliver sustainable organic growth over the long-term,” said Boris Elisman, Chairman and Chief Executive Officer of ACCO Brands.
“In 2023 our top priority is to restore our margin profile through incremental pricing actions implemented in January of 2023, the restructuring initiatives undertaken during the fourth quarter of 2022 and the additional productivity programs we will implement in 2023. We expect these actions will drive margin expansion and profit growth for the full year of 2023. With our expected continued strong cash flow in 2023, we will support our quarterly dividend, pay down debt and continue to invest in new product development and go-to-market initiatives, which we expect will better position us for future growth,” added Elisman.
Fourth Quarter Results
Net sales declined 12.4 percent to $499.4 million from $570.3 million in 2021. Adverse foreign exchange reduced sales $25.5 million, or 4.5 percent. Comparable sales fell 7.9 percent. Both reported and comparable sales declines were due to weaker sales of gaming accessories, lower inventory replenishment by our retailer customers and reduced volumes due to a deterioration in the macroeconomic environment. These more than offset global price increases.
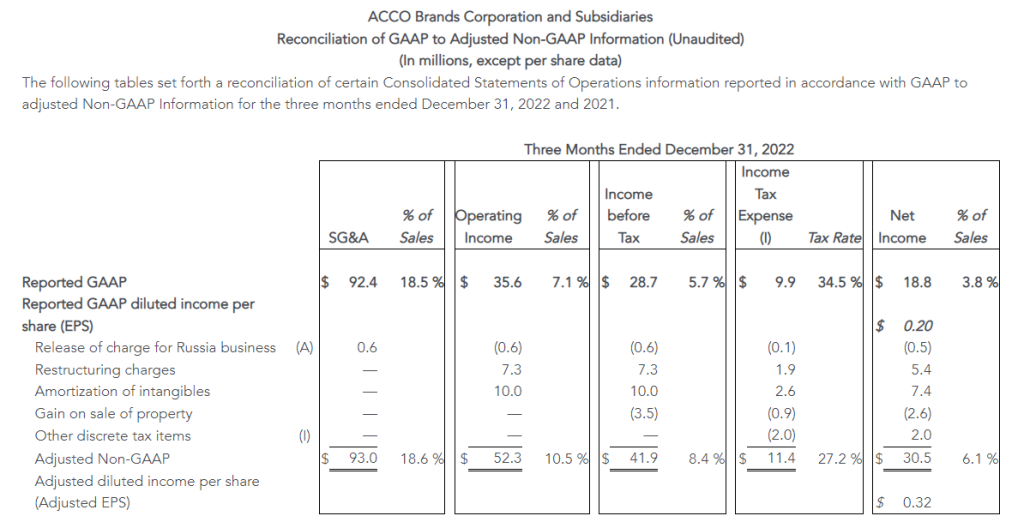
Operating income was $35.6 million versus $63.6 million in 2021, and adjusted operating income decreased to $52.3 million from $79.1 million in the prior year. Both reported and adjusted operating income reflect the impact of lower sales volumes and higher inflation on raw materials, finished goods and transportation costs, which was partially offset by price increases, and reduced SG&A expense due to lower incentive compensation expense. Adverse foreign exchange reduced operating income by $2.2 million.
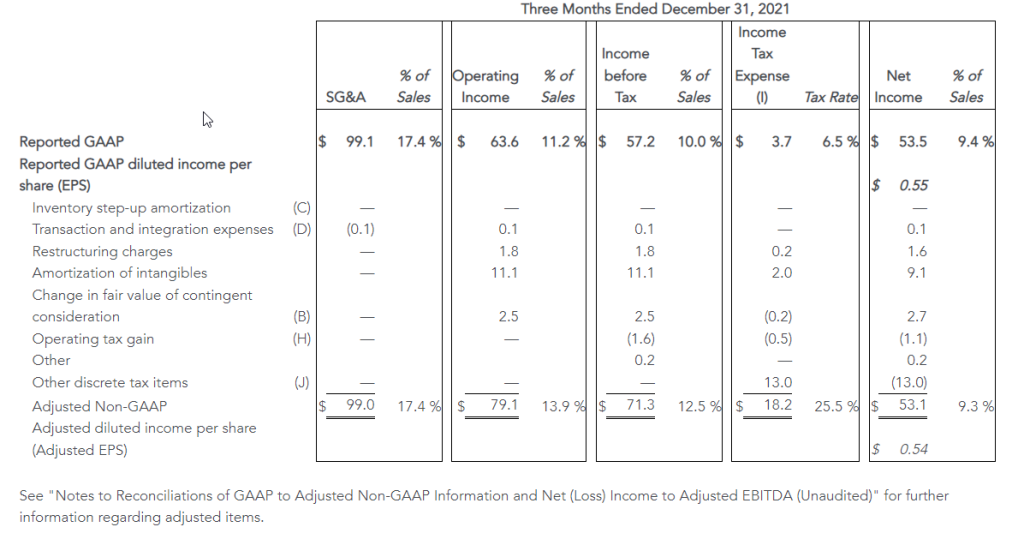
The Company reported net income of $18.8 million, or $0.20 per share, compared with prior year net income of $53.5 million, or $0.55 per share, which included $13.0 million of favorable discrete tax items. Adjusted net income was $30.5 million, or $0.32 per share, compared with $53.1 million, or $0.54 per share in 2021. The remaining declines in underlying reported net income, as well as adjusted net income were due to the items noted above in operating income.
Full Year Results
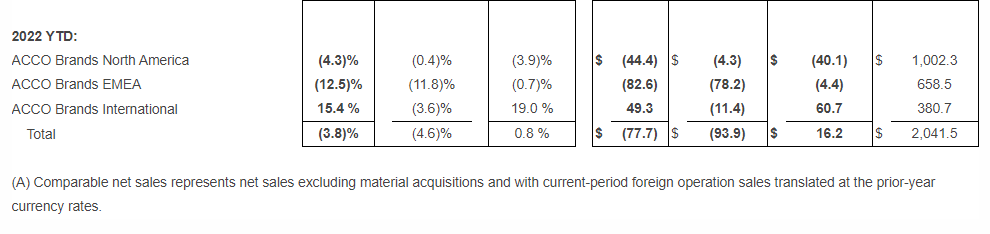
Net sales decreased 3.8 percent to $1.95 billion from $2.03 billion in 2021. The unfavorable impact of foreign exchange reduced sales by $93.9 million, or 4.6 percent. Comparable sales increased 0.8 percent. Both reported and comparable sales reflect the benefit of higher prices in all segments and strong volume growth in the International segment, partially offset by weaker sales of gaming accessories, and lower volumes in North America and EMEA due to the challenging macroeconomic environment.
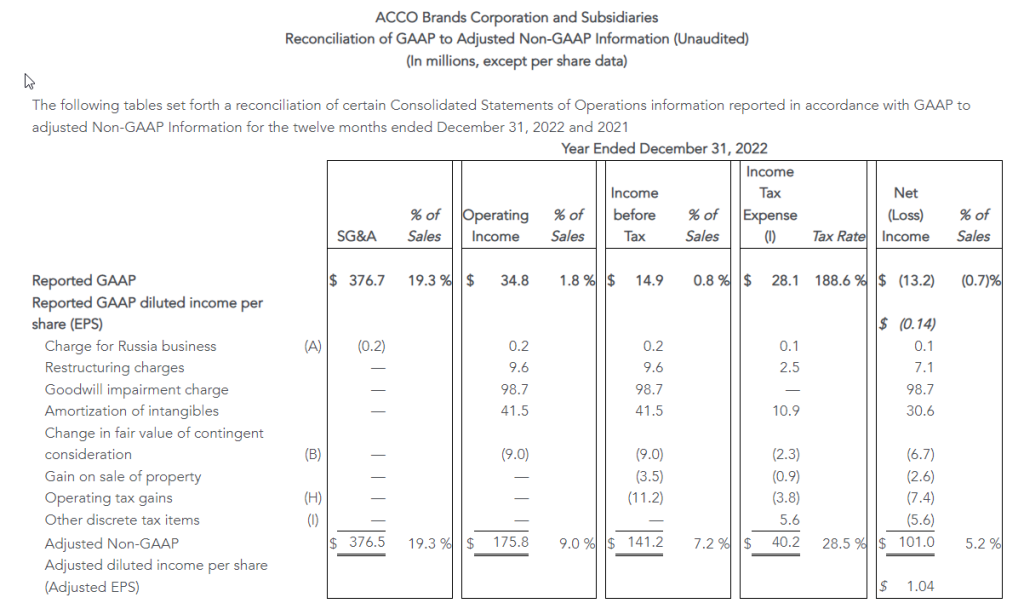
Operating income was $34.8 million compared to $151.0 million in 2021, with the decline primarily due to the non-cash goodwill impairment charge of $98.7 million, partially offset by the favorable change in fair value of $28.0 million related to the PowerA contingent earnout. Adjusted operating income declined to $175.8 million from $227.9 million in 2021. The declines in both reported and adjusted operating income also reflect the impact of inflation that exceeded the benefit of price increases, and reduced volumes, partially offset by reduced SG&A expense which includes lower incentive compensation expense. Unfavorable foreign exchange reduced operating income by $6.3 million.
Net loss was $13.2 million, or ($0.14) per share, compared with net income of $101.9 million, or $1.05 per share, in 2021. The current year net loss includes $98.7 million in non-cash goodwill impairment charges, mitigated by the favorable change in fair value of the contingent earnout consideration of $20.9 million. Prior year net income also included $19.7 million of additional favorable discrete tax items, partially offset by $9.9 million of expenses related to the debt refinancing. Adjusted net income was $101.0 million, compared with $136.8 million in 2021, and adjusted earnings per share were $1.04 compared with $1.41 in 2021. The remaining declines in reported net income and adjusted net income reflect the changes noted above for adjusted operating income, partially offset by higher interest income due to higher cash balances and increased interest rates in Brazil. Interest expense was similar to the prior year.
Capital Allocation and Dividend
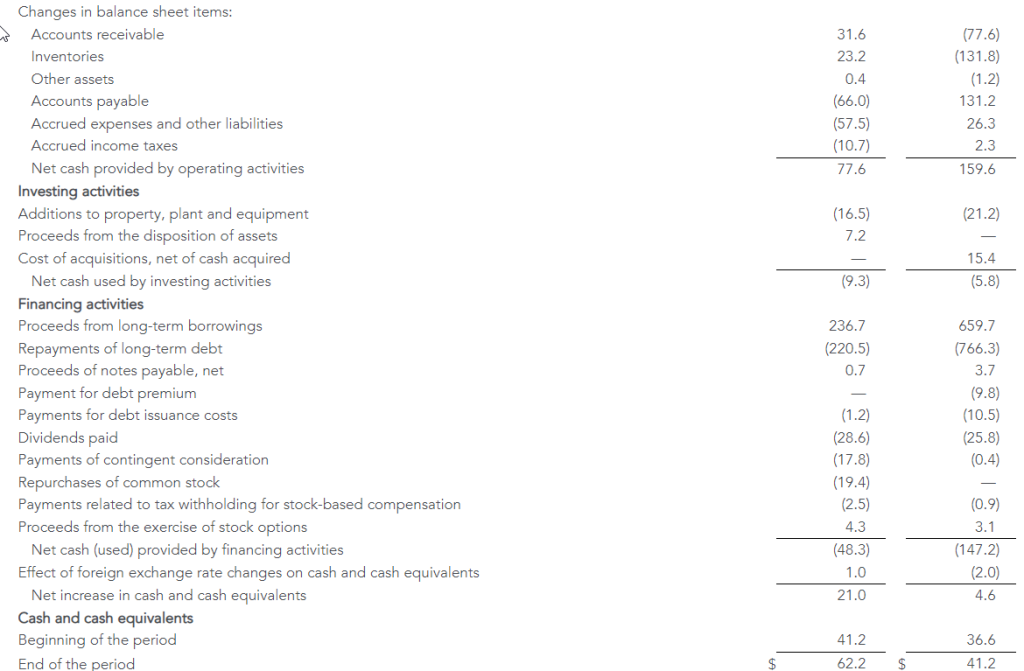
For the full year, the Company’s cash generated by operating activities was $77.6 million versus $159.6 million in the prior year. Adjusted free cash flow in 2022 was $77.5 million, reflecting net investing activity and excluding the operating component of the contingent earnout payment. In 2022 the Company paid $28.6 million in dividends, repurchased 2.7 million shares for $19.4 million and fully paid $27.0 million related to the 2021 PowerA contingent earnout.
ACCO Brands announced on February 17, 2023, that its board of directors declared a regular quarterly cash dividend of $0.075 per share. The dividend will be paid on April 5, 2023, to stockholders of record at the close of business on March 10, 2023.
Restructuring Actions
During the fourth quarter of 2022, the Company developed restructuring plans for both its North America and EMEA operating segments, intended to expand margins through initiatives focused on improving operating efficiency and reducing cost. In the Company’s North America segment, the plan is focused on consolidation of supply chain operations, SKU reduction, automating our sales support process, and sourcing optimization. In the Company’s EMEA segment, the focus is on reducing redundancy and enhancing productivity in its operations, SKU reduction, and sourcing initiatives. The Company anticipates these initiatives will create operating efficiencies and improve profitability, as well as provide for future growth investments. The Company has the following expectations for the restructuring plans:
Targeted annualized operating profit improvement of $13 million, with the vast majority of these savings delivered in 2023
Total profit improvements to be realized approximately 75% through lower SG&A costs and 25% through reduced cost of goods sold
Pre-tax restructuring charges of approximately $7 million were recorded in the fourth quarter, primarily comprised of severance and employee related costs
In addition, the Company has implemented plans to reduce inventory levels, increase inventory turns and improve cash flow and working capital.
Business Segment Results
ACCO Brands North America – Fourth quarter segment net sales of $225.7 million decreased 16.7 percent versus the prior year’s segment net sales of $271.0 million. Adverse foreign exchange reduced sales by 0.6 percent. Comparable sales of $227.3 million were down 16.1 percent. The decrease was primarily due to lower demand for gaming accessories and channel inventory destocking, more than offsetting price increases.
Fourth quarter operating income in North America was $8.9 million versus $34.2 million a year earlier, and adjusted operating income was $18.7 million compared to $41.9 million a year ago, with the decline in both primarily reflecting the impact of lower sales, reduced gross margin rates from negative fixed cost leverage and higher inflation on raw materials, finished goods and transportation costs. In addition, we incurred one-off items in the quarter of $7.8 million, reducing the margin rate by 340 basis points. We anticipate stabilization of product costs in select areas and improved ocean freight rates, which should benefit our margin profile in future periods.
For the full year, 2022 North America net sales of $998.0 million decreased 4.3 percent from $1,042.4 million in 2021, and comparable sales declined 3.9 percent. Higher sales and market share gains in many brands and product categories were more than offset by weaker demand for gaming accessories. Sales were stronger in the first half of 2022, driven by early demand for back-to-school products as retailers pulled their shipments to earlier in the year seeking to secure product for the selling season, while second half sales were challenged by both this pull forward, as well as inventory destocking and a slowdown in demand related to the macroeconomic environment.
In North America, the full year operating loss was $4.9 million versus operating income of $121.9 million in 2021. The loss was primarily due to the $98.7 million non-cash goodwill impairment charge. Adjusted operating income of $121.5 million decreased from $154.6 million in 2021. The decreases to reported operating loss/income and adjusted operating income reflect lower sales volumes and reduced gross margin from higher inflation on raw materials, finished goods and transportation costs.
ACCO Brands EMEA – Fourth quarter segment net sales of $156.0 million decreased 17.0 percent versus the prior year’s segment revenue of $187.9 million. Adverse foreign exchange reduced sales by 11.7 percent. Comparable sales of $177.9 million decreased 5.3 percent versus the prior-year period. Both reported and comparable sales declines were due to lower volumes which more than offset price increases. In Europe, the current energy crisis and significant inflation have created a challenging macroeconomic environment impacting sales.
Fourth quarter operating income in EMEA was $12.7 million versus $21.6 million a year earlier, and adjusted operating income was $18.4 million compared to $24.9 million a year ago. The decreases in both reported operating income and adjusted operating income were due primarily to lower sales and reduced gross margins reflecting negative fixed cost leverage and higher costs for finished goods, raw materials and freight due to significant inflation. In the fourth quarter, EMEA’s operating margin improved on a sequential basis benefiting from pricing actions and deflation in certain product and transportation costs.
Net sales for the full year in the EMEA segment of $580.3 million decreased 12.5 percent from $662.9 million in 2021. The impact of adverse foreign exchange reduced sales $78.2 million, or 11.8 percent. Comparable sales of $658.5 million decreased $4.4 million or 0.7 percent. Both reported and comparable sales declines reflect stronger sales volumes in early 2022 driven by computer accessories and business products, offset by persistent inflation and a challenging demand environment in the second half of the year, as well as the stoppage of sales to Russia.
The EMEA segment posted full-year operating income of $21.7 million compared with operating income of $61.7 million in 2021. Adjusted operating income was $37.0 million, down from $77.2 million in 2021. The declines in both reflects the impact of lower sales volumes and reduced gross margins reflecting higher costs for finished goods, raw materials and freight due to significant inflation and negative fixed cost leverage.
ACCO Brands International – Fourth quarter segment sales of $117.7 million increased 5.7 percent versus the prior year’s segment revenue of $111.4 million. Adverse foreign exchange reduced sales by 1.8 percent. Comparable sales of $119.7 million increased 7.5 percent versus the year-ago period. Both reported and comparable sales increased primarily due to price increases, more than offsetting lower volumes. Strong sales in Brazil benefited from a return to in-person education.
Fourth quarter operating income in the International segment was $22.7 million versus $20.9 million a year earlier, and adjusted operating income was $24.3 million compared to $22.9 million a year ago. The increases in both operating income and adjusted operating income were due primarily to price increases, and the strong performance in our Brazil business.
International segment sales of $369.3 million for the full year increased 15.4 percent from $320.0 million in 2021. Adverse foreign exchange reduced sales by $11.4 million. Comparable sales were $380.7 million, up 19.0 percent, due to increased volume and higher prices, primarily in Latin America from a return of in-person education and work.
Operating income of $50.5 million increased from $31.6 million in 2021. Adjusted operating income of $58.3 million increased from $40.6 million. The increases in both operating and adjusted operating income were primarily due to higher sales volumes, pricing and improved expense leverage.
Commentary and Outlook for 1Q and Full Year 2023
“Our priority in 2023 is to improve our operating profitability and free cash flow through pricing, productivity and restructuring initiatives and more efficient use of working capital. We anticipate that these actions, along with a moderating rate of inflation, will allow us to deliver margin expansion and profit and cash flow growth in 2023. We achieved comparable sales growth in 2022 and are confident in the long term sales potential of our business. Our proven business strategy, which includes geographic diversity, and our strong portfolio of brands and innovative products have us well positioned for continued long term profitable growth,” added Elisman.
“While the current economic environment remains fluid, we have an experienced management team with a proven track record of navigating periods of economic uncertainties. We are also well-capitalized, with no near-term debt maturities and generate consistent free cash flow. We remain confident in our strategic transformation and believe we have taken the right actions to drive long-term shareholder value,” Elisman concluded.
The Company is providing full year 2023 and 1Q outlook. For the full year, we expect comparable sales to be down 3 percent to flat, reflecting a challenging near-term demand environment. Foreign exchange is expected to be neutral to reported revenue. Full year adjusted EPS is expected to rise 4 percent to 8 percent, to $1.08 to $1.12, approaching low double-digit growth in adjusted operating income, partially offset by higher interest and non-cash non-operating pension expenses. 2023 free cash flow is expected to grow to at least $100 million.
Our quarterly sales and profit projection for 2023 will reflect a different cadence than last year. In 2022, the Company experienced good sales growth in the first half of the year reflecting strong demand from the post-pandemic economic recovery. In addition, North America sales benefited from the pull forward of purchases by retailers to ensure product availability for back-to-school. Concerns about the economy, the war in Ukraine and related energy crisis in EMEA challenged demand and our sales in the second half of 2022. In addition, our retail customers proactively curtailed purchases in the back half of the year to aggressively reduce their inventory levels. Against these comparisons, we are projecting our sales to be down in both the first quarter and first half of 2023, with growth anticipated in the second half of the year.
In the first quarter, we expect comparable sales to decline 10 percent to 7 percent, primarily due to the timing of back-to-school shipments and lower sales of gaming accessories in North America, partially offset by higher sales in our International segment. First quarter adjusted EPS is expected to be $0.05 to $0.07 with higher gross margins offset by sales deleveraging, higher interest and non-cash, non-operating pension expenses.
Webcast
At 8:30 a.m. ET on February 24, 2023, ACCO Brands Corporation will host a conference call to discuss the Company’s fourth quarter and full year 2022 results. The call will be broadcast live via webcast. The webcast can be accessed through the Investor Relations section of www.accobrands.com. The webcast will be in listen-only mode and will be available for replay following the event.
About ACCO Brands Corporation
ACCO Brands, the Home of Great Brands Built by Great People, designs, manufactures and markets consumer and end-user products that help people work, learn, play and thrive. Our widely recognized brands include AT-A-GLANCE®, Five Star®, Kensington®, Leitz®, Mead®, PowerA®, Swingline®, Tilibra® and many others. More information about ACCO Brands Corporation (NYSE: ACCO) can be found at www.accobrands.com.
Non-GAAP Financial Measures
In addition to financial results reported in accordance with generally accepted accounting principles (GAAP), we have provided certain non-GAAP financial information in this earnings release to aid investors in understanding the Company’s performance. Each non-GAAP financial measure is defined and reconciled to its most closely related GAAP financial measure in the “About Non-GAAP Financial Measures” section of this earnings release.
Forward-Looking Statements
Statements contained herein, other than statements of historical fact, particularly those anticipating future financial performance, business prospects, growth, strategies, business operations and similar matters, results of operations, liquidity and financial condition, are “forward-looking statements” within the meaning of the Private Securities Litigation Reform Act of 1995. These statements are based on the beliefs and assumptions of management based on information available to us at the time such statements are made. These statements, which are generally identifiable by the use of the words “will,” “believe,” “expect,” “intend,” “anticipate,” “estimate,” “forecast,” “project,” “plan,” and similar expressions, are subject to certain risks and uncertainties, are made as of the date hereof, and we undertake no duty or obligation to update them. Because actual results may differ materially from those suggested or implied by such forward-looking statements, you should not place undue reliance on them when deciding whether to buy, sell or hold the company’s securities.
Our outlook is based on certain assumptions, which we believe to be reasonable under the circumstances. These include, without limitation, assumptions regarding the impact of the COVID-19 pandemic and the war in Ukraine; the impact of inflation and global economic uncertainties, fluctuations in foreign currency exchange rates and acquisitions; and the other factors described below.
Among the factors that could cause our actual results to differ materially from our forward-looking statements are: our ability to successfully execute our restructuring plans and realize the benefits of our productivity initiatives; our ability to obtain additional price increases and realize longer-term cost reductions; the ongoing impact of the COVID-19 pandemic; a relatively limited number of large customers account for a significant percentage of our sales; issues that influence customer and consumer discretionary spending during periods of economic uncertainty or weakness; risks associated with foreign currency exchange rate fluctuations; challenges related to the highly competitive business environment in which we operate; our ability to develop and market innovative products that meet consumer demands and to expand into new and adjacent product categories that are experiencing higher growth rates; our ability to successfully expand our business in emerging markets and the exposure to greater financial, operational, regulatory, compliance and other risks in such markets; the continued decline in the use of certain of our products; risks associated with seasonality; the sufficiency of investment returns on pension assets, risks related to actuarial assumptions, changes in government regulations and changes in the unfunded liabilities of a multi-employer pension plan; any impairment of our intangible assets; our ability to secure, protect and maintain our intellectual property rights, and our ability to license rights from major gaming console makers and video game publishers to support our gaming business; continued disruptions in the global supply chain; risks associated with inflation and other changes in the cost or availability of raw materials, transportation, labor, and other necessary supplies and services and the cost of finished goods; the continued global shortage of microchips which are needed in our gaming and computer accessories businesses; risks associated with outsourcing production of certain of our products, information technology systems and other administrative functions; the failure, inadequacy or interruption of our information technology systems or its supporting infrastructure; risks associated with a cybersecurity incident or information security breach, including that related to a disclosure of personally identifiable information; our ability to grow profitably through acquisitions; our ability to successfully integrate acquisitions and achieve the financial and other results anticipated at the time of acquisition, including planned synergies; risks associated with our indebtedness, including limitations imposed by restrictive covenants, our debt service obligations, and our ability to comply with financial ratios and tests; a change in or discontinuance of our stock repurchase program or the payment of dividends; product liability claims, recalls or regulatory actions; the impact of litigation or other legal proceedings; our failure to comply with applicable laws, rules and regulations and self-regulatory requirements, the costs of compliance and the impact of changes in such laws; our ability to attract and retain qualified personnel; the volatility of our stock price; risks associated with circumstances outside our control, including those caused by public health crises, such as the occurrence of contagious diseases like COVID-19, severe weather events, war, terrorism and other geopolitical incidents; and other risks and uncertainties described in “Part I, Item 1A. Risk Factors” in our Annual Report on Form 10-K for the year ended December 31, 2021, “Part II, Item 1A Risk Factors” in our Quarterly Report on Form 10-Q for the quarter ended September 30, 2022 and in other reports we file with the Securities and Exchange Commission.
About Non-GAAP Financial Measures
We explain below how we calculate each of our non-GAAP financial measures and a reconciliation of our current period and historical non-GAAP financial measures to the most directly comparable GAAP financial measures follows.
We use our non-GAAP financial measures both to explain our results to stockholders and the investment community and in the internal evaluation and management of our business. We believe our non-GAAP financial measures provide management and investors with a more complete understanding of our underlying operational results and trends, facilitate meaningful period-to-period comparisons and enhance an overall understanding of our past and future financial performance.
Our non-GAAP financial measures exclude certain items that may have a material impact upon our reported financial results such as restructuring charges, transaction and integration expenses associated with material acquisitions, the impact of foreign currency exchange rate fluctuations and acquisitions, unusual tax items, goodwill impairment charges, and other non-recurring items that we consider to be outside of our core operations. These measures should not be considered in isolation or as a substitute for, or superior to, the directly comparable GAAP financial measures and should be read in connection with the Company’s financial statements presented in accordance with GAAP.
Our non-GAAP financial measures include the following:
Comparable Sales : Represents net sales excluding the impact of material acquisitions with current-period foreign operation sales translated at prior-year currency rates. We believe comparable sales are useful to investors and management because they reflect underlying sales and sales trends without the effect of acquisitions and fluctuations in foreign exchange rates and facilitate meaningful period-to-period comparisons. We sometimes refer to comparable sales as comparable net sales.
Adjusted Gross Profit : Represents gross profit excluding the effect of the amortization of the step-up in inventory from material acquisitions. We believe adjusted gross profit is useful to investors and management because it reflects underlying gross profit without the effect of inventory adjustments resulting from acquisitions that we consider to be outside our core operations and facilitates meaningful period-to-period comparisons.
Adjusted Selling, General and Administrative (SG&A) Expenses : Represents selling, general and administrative expenses excluding transaction and integration expenses related to material acquisitions. We believe adjusted SG&A expenses are useful to investors and management because they reflect underlying SG&A expenses without the effect of expenses related to acquiring and integrating acquisitions that we consider to be outside our core operations and facilitate meaningful period-to-period comparisons.
Adjusted Operating Income/Adjusted Income Before Taxes/Adjusted Net Income/Adjusted Net Income Per Diluted Share :Represents operating income, income before taxes, net income, and net income per diluted share excluding restructuring and goodwill impairment charges, the amortization of intangibles, the amortization of the step-up in value of inventory, the change in fair value of contingent consideration, transaction and integration expenses associated with material acquisitions, non-recurring items in interest expense or other income/expense such as expenses associated with debt refinancing, a bond redemption, or a pension curtailment, and other non-recurring items as well as all unusual and discrete income tax adjustments, including income tax related to the foregoing. We believe these adjusted non-GAAP financial measures are useful to investors and management because they reflect our underlying operating performance before items that we consider to be outside our core operations and facilitate meaningful period-to-period comparisons. Senior management’s incentive compensation is derived, in part, using adjusted operating income and adjusted net income per diluted share, which is derived from adjusted net income. We sometimes refer to adjusted net income per diluted share as adjusted earnings per share or adjusted EPS.
Adjusted Income Tax Expense/Rate :Represents income tax expense/rate excluding the tax effect of the items that have been excluded from adjusted income before taxes, unusual income tax items such as the impact of tax audits and changes in laws, significant reserves for cash repatriation, excess tax benefits/losses, and other discrete tax items. We believe our adjusted income tax expense/rate is useful to investors because it reflects our baseline income tax expense/rate before benefits/losses and other discrete items that we consider to be outside our core operations and facilitates meaningful period-to-period comparisons.
Adjusted EBITDA: Represents net income excluding the effects of depreciation, stock-based compensation expense, amortization of intangibles, the change in fair value of contingent consideration, interest expense, net, other (income) expense, net, and income tax expense, the amortization of the step-up in value of inventory, transaction and integration expenses associated with material acquisitions, restructuring and goodwill impairment charges, non-recurring items in interest expense or other income/expense such as expenses associated with debt refinancing, a bond redemption, or a pension curtailment and other non-recurring items. We believe adjusted EBITDA is useful to investors because it reflects our underlying cash profitability and adjusts for certain non-cash charges, and items that we consider to be outside our core operations and facilitates meaningful period-to-period comparisons.
Adjusted Free Cash Flow: Represents cash flow from operating activities, excluding cash payments made for contingent earnouts, less cash used for additions to property, plant and equipment, plus cash proceeds from the disposition of assets. We believe adjusted free cash flow is useful to investors because it measures our available cash flow for paying dividends, funding strategic material acquisitions, reducing debt, and repurchasing shares.
Consolidated Leverage Ratio: Represents balance sheet debt, plus debt origination costs and less any cash and cash equivalents divided by adjusted EBITDA. We believe that consolidated leverage ratio is useful to investors since the company has the ability to, and may decide to use a portion of its cash and cash equivalents to retire debt.
We also provide forward-looking non-GAAP comparable sales, adjusted earnings per share, adjusted free cash flow, adjusted EBITDA, and adjusted tax rate, and historical and forward-looking consolidated leverage ratio. We do not provide a reconciliation of these forward-looking and historical non-GAAP measures to GAAP because the GAAP financial measure is not currently available and management cannot reliably predict all the necessary components of such non-GAAP measures without unreasonable effort or expense due to the inherent difficulty of forecasting and quantifying certain amounts that are necessary for such a reconciliation, including adjustments that could be made for restructuring, integration and acquisition-related expenses, the variability of our tax rate and the impact of foreign currency fluctuation and material acquisitions, and other charges reflected in our historical results. The probable significance of each of these items is high and, based on historical experience, could be material.
Christopher McGinnis Investor Relations (847) 796-4320