Eagle Bulk Shipping Inc. (“Eagle”) is a US-based drybulk owner-operator focused on the Supramax/Ultramax mid-size asset class, which ranges from 50,000 and 65,000 deadweight tons in size; these vessels are equipped with onboard cranes allowing for the self-loading and unloading of cargoes, a feature which distinguishes them from the larger classes of drybulk vessels and provides for greatly enhanced flexibility and versatility- both with respect to cargo diversity and port accessibility. The Company transports a broad range of major and minor bulk cargoes around the world, including coal, grain, ore, pet coke, cement, and fertilizer. Eagle operates out of three offices, Stamford (headquarters), Singapore, and Hamburg, and performs all aspects of vessel management in-house including: commercial, operational, technical, and strategic.
Michael Heim, CFA, Senior Research Analyst, Noble Capital Markets, Inc.
Refer to the full report for the price target, fundamental analysis, and rating.
Revenues decline despite the addition of ships as shipping rates decline. Eagle reported an 18% quarterly decline in revenues. A ship addition in September increased Eagle’s operating days. Average TCE rate declined 25% quarterly. The decline in revenues would have been much sharper had it not been for an $11 million realized gain from derivatives.
Operating costs continue to rise. Operating costs have risen steadily in recent quarters. Management again cited increased costs associated with transporting and housing Ukrainian employees. Management believes operating costs per ship will decline in upcoming quarters. Cash breakeven per ship days reached a level above $12,000 in the most recent quarter, close to Eagle’s fixed TCE rate in the upcoming quarter.
Equity Research is available at no cost to Registered users of Channelchek. Not a Member? Click ‘Join’ to join the Channelchek Community. There is no cost to register, and we never collect credit card information.
This Research is provided by Noble Capital Markets, Inc., a FINRA and S.E.C. registered broker-dealer (B/D).
*Analyst certification and important disclosures included in the full report. NOTE: investment decisions should not be based upon the content of this research summary. Proper due diligence is required before making any investment decision.
HOUSTON, March 02, 2023 (GLOBE NEWSWIRE) — Orion Group Holdings, Inc. (NYSE: ORN) (“Company”), a leading specialty construction company, today announced that Austin J. Shanfelter will transition from Executive Chairman to Chairman of the Board of Directors, effective March 2, 2023.
Mr. Shanfelter has served on Orion Group’s Board of Directors since 2007 and was named Chairman in January 2021. From April to September 2022, he assumed the roles of Interim Chief Executive Officer and Interim Chief Financial Officer until Travis Boone, Chief Executive Officer and Scott Thanisch, Chief Financial Officer were appointed in September 2022. Since then, Mr. Shanfelter served as Executive Chairman to ensure a smooth leadership transition. His transition back to Chairman of the Board marks the completion of this successful transition period.
“Orion has been a trusted provider of mission-critical specialty construction services for nearly thirty years,” said Austin J. Shanfelter, Chairman of the Board. “As we look forward to our next chapter, our Board has complete confidence that Travis Boone and Scott Thanisch are the right leadership team with the right experience to unlock the value of our assets by leveraging our distinctive capabilities and long-term customer relationships. Orion Group Holdings is well positioned to benefit from the greater public attention and funding that is now being focused on our country’s critical infrastructure needs. In my sixteen years as a director of our Company, we have never had a more talented and experienced management team and a more engaged board, who are singularly focused on positioning Orion to create sustainable value for all our stakeholders.”
Travis Boone, Chief Executive Officer of Orion Group Holdings said, “I want to thank Austin for his invaluable leadership as Executive Chair during this transition. Since becoming CEO, I have received the full support of a very dedicated and far-sighted Board and I look forward to their continued guidance as we execute our strategic plan to drive sustainable growth and profitability over time.”
Concurrent with Mr. Shanfelter becoming independent Chairman of the Board, Richard L. Daerr, Jr. stepped down as Lead Independent Director to remain as an independent board member. Orion Group Holding’s Board now consists of eight members, seven of whom are independent.
About Orion Group Holdings, Inc.
Orion Group Holdings, Inc., a leading specialty construction company serving the infrastructure, industrial and building sectors, provides services both on and off the water in the continental United States, Alaska, Canada and the Caribbean Basin through its marine segment and its concrete segment. The Company’s marine segment provides construction and dredging services relating to marine transportation facility construction, marine pipeline construction, marine environmental structures, dredging of waterways, channels and ports, environmental dredging, design, and specialty services. Its concrete segment provides turnkey concrete construction services including place and finish, site prep, layout, forming, and rebar placement for large commercial, structural and other associated business areas. The Company is headquartered in Houston, Texas with regional offices throughout its operating areas. Orion Group Holdings, Inc. – Specialty Construction Company (oriongroupholdingsinc.com)
Investor and Media Relations Contacts: Financial Profiles, Inc. Margaret Boyce 310-622-8247 Jack Drapacz 310-622-8230 orn@finprofiles.com
DLH delivers improved health and readiness solutions for federal programs through research, development, and innovative care processes. The Company’s experts in public health, performance evaluation, and health operations solve the complex problems faced by civilian and military customers alike, leveraging digital transformation, artificial intelligence, advanced analytics, cloud-based applications, telehealth systems, and more. With over 2,300 employees dedicated to the idea that “Your Mission is Our Passion,” DLH brings a unique combination of government sector experience, proven methodology, and unwavering commitment to public health to improve the lives of millions. For more information, visit www.DLHcorp.com.
Joe Gomes, Managing Director – Generalist Analyst, Noble Capital Markets, Inc.
Joshua Zoepfel, Research Associate, Noble Capital Markets, Inc.
Refer to the full report for the price target, fundamental analysis, and rating.
More Work. On Tuesday, DLH’s subsidiary Grove Resource Solutions LLC (“GRSi”) was awarded a multiple-award blanket purchase agreement to provide IT services to the National Cancer Institute’s (“NCI”) Center for Biomedical Informatics and Information Technology. The award is for a five-year period with an aggregate ceiling totaling $1.7 billion, and DLH will join seven other awardees in the contract.
Specifics. DLH will be acting as a prime vendor on the contract and provide NCI with the specialized professional IT support required to accomplish their goals. Other orders under call in the contract could include operations and maintenance, information systems security, service desk, engineering, cloud platform management and support, enterprise Software as a Service (“SaaS”) platform management, data management, etc.
Equity Research is available at no cost to Registered users of Channelchek. Not a Member? Click ‘Join’ to join the Channelchek Community. There is no cost to register, and we never collect credit card information.
This Company Sponsored Research is provided by Noble Capital Markets, Inc., a FINRA and S.E.C. registered broker-dealer (B/D).
*Analyst certification and important disclosures included in the full report. NOTE: investment decisions should not be based upon the content of this research summary. Proper due diligence is required before making any investment decision.
Kratos Defense & Security Solutions, Inc. (NASDAQ:KTOS) develops and fields transformative, affordable technology, platforms, and systems for United States National Security related customers, allies, and commercial enterprises. Kratos is changing the way breakthrough technologies for these industries are rapidly brought to market through proven commercial and venture capital backed approaches, including proactive research, and streamlined development processes. At Kratos, affordability is a technology, and we specialize in unmanned systems, satellite communications, cyber security/warfare, microwave electronics, missile defense, hypersonic systems, training and combat systems and next generation turbo jet and turbo fan engine development. For more information go to www.kratosdefense.com.
Joe Gomes, Managing Director – Generalist Analyst, Noble Capital Markets, Inc.
Joshua Zoepfel, Research Associate, Noble Capital Markets, Inc.
Refer to the full report for the price target, fundamental analysis, and rating.
4Q22 Results. Revenue totaled $249.3 million, up 17.8% y-o-y, and at the upper end of the $231-$251 million guidance. Organic growth was 4.1%. Adjusted EBITDA came in at $19.2 million, at the lower end of guidance, versus $23.4 million a year ago. GAAP EPS loss was $0.07 and adjusted EPS net income was $0.08, compared to a net loss of $0.02 and adjusted EPS of $0.11, respectively, a year ago.
Building Momentum. We believe 2023 will be a transformative year for Kratos as programs will be transitioning from development RDT&E or LRIP to funded programs, contracts, or full rate production, driving greater revenue and cash flow.
Equity Research is available at no cost to Registered users of Channelchek. Not a Member? Click ‘Join’ to join the Channelchek Community. There is no cost to register, and we never collect credit card information.
This Research is provided by Noble Capital Markets, Inc., a FINRA and S.E.C. registered broker-dealer (B/D).
*Analyst certification and important disclosures included in the full report. NOTE: investment decisions should not be based upon the content of this research summary. Proper due diligence is required before making any investment decision.
Will Tesla Investors be Inspired or Disappointed on March 1 (Investor Day)?
Tesla’s Investor Day is March 1st. The lead-up to these events is usually filled with speculation of how the founder, Elon Musk, may surprise EV fans and the investment community. Tesla’s (TSLA) innovations and unique marketing and distribution have made it the most valuable car company in the world. Part of that marketing is the mystique and confidence Musk brings whenever he has an audience. The company is also inspiring as it is less than 20 years in the making and is leading a revolution in how automobiles are built, driven, and fueled.
As plans are kept under wraps, most of the rumors as to what to expect fall in the category of speculation. Below are some of the most likely ideas from past announcements from Tesla and across the internet since the meeting date was announced.
Battery Production
Sourcing raw materials for batteries to make certain new EVs have all the needed components is becoming a concern among car manufacturers.
News has leaked of a proposed $3.6 billion Giga factory to produce up to 100 Gwh of batteries. The factory is expected to be in Nevada and eventually be used to assemble the Tesla semi when production eventually starts.
Tesla is expected to build a processing facility to make lithium hydroxide from spodumene concentrate in Corpus Christie, Texas. The location is good for shipping, and it is close to sources of sulfuric acid from the oil industry. This would be the first lithium hydroxide production facility in the U.S. If true, it would help Tesla fulfill the raw material sourcing requirements of the Inflation Reduction Act to qualify its cars for the $7,500 federal tax credit.
Those deals are at market prices; Tesla would reap the profits from processing the spodumene concentrate into hydroxide, but the bulk of the profit from the material supply accrues to the mining company. Tesla has hinted previously of plans to enter the lithium mining business.
The $25,000 EV
First mentioned in 2020, Tesla’s proposed $25,000 car earned the nickname “fluffy pillow” after Musk showed a picture of an object covered by a blanket that many thought resembled a large pillow. The project was put on hold in early 2022 when Musk said Tesla had too much on its plate.
Tesla’s existing best sellers, the Model 3 and Model Y, have been around for a while, a new model, whether it is the truck or an affordable entry level car would freshen up the line-up.
New Factory
Tesla’s production goals put it at or near capacity. The current factory capacity is listed as 1.9 million vehicles per year. The current goal is six million cars a year by 2026. This would require the expansion of existing plants and then some. A new factory takes three years to design, construct, and get rolling. So planning would have to start now. Musk is more likely to build a new plant than change his production goals.
Thoughts from across the internet suggest this could be in Indonesia or Mexico. Cars built in Mexico could qualify for the $7500 tax credit to purchasers.
Capital Raise
To accomplish the above requires money. Currently, there is construction in progress building out Tesla’s German and Texas factories. Billions more would be needed to implement other plans.
There is as of recent reporting, $22 billion in cash on Tesla’s balance sheet. This is a snapshot of quarter-end and not an accurate representation of the company’s finances. Offsetting this large number is $15 billion in trade payables and $7 billion in accrued payables, much of which is due soon.
Tesla may have to go to the market to raise cash for projects that will be presented on March 1st.
About Tesla Day
The investor event will be live-streamed from Tesla’s Gigafactory in Texas, with some of the company’s institutional and retail investors attending in person. According to Tesla’s press release, investors will be able to see its most advanced production line as well as discuss long-term expansion plans, the generation 3 platform, and capital allocation.
Seanergy Maritime Holdings Corp. is the only pure-play Capesize ship-owner publicly listed in the US. Seanergy provides marine dry bulk transportation services through a modern fleet of Capesize vessels. The Company’s operating fleet consists of 17 Capesize vessels with an average age of approximately 12 years and aggregate cargo carrying capacity of approximately 3,011,083 dwt. The Company is incorporated in the Marshall Islands and has executive offices in Glyfada, Greece. The Company’s common shares trade on the Nasdaq Capital Market under the symbol “SHIP” and its Class B warrants under “SHIPZ”.
Michael Heim, CFA, Senior Research Analyst, Noble Capital Markets, Inc.
Refer to the full report for the price target, fundamental analysis, and rating.
Seanergy completes a 10-1 reverse stock split effective February 16, 2023. With the reverse split, the number of outstanding shares is reduced to 18,191,647 from 181,918,471 and then adjusted for the cancellation of fractional shares. We are raising our earnings per share estimates to reflect the change, essentially raising our numbers by ten fold with some adjustment for recent shipping rate weakness.
Our price target increases slightly less than ten fold. We are adjusting our price target to $10 from $1.50 to reflect the reverse stock split. Our PO was increased less than ten times as we have adjusted our models to reflect weaker current shipping rates. In addition, we have changed our valuation methodology from a multiple of next year’s ebitda to a discounted cash flow model. Our new methodology projects out cash flow generation for five years so that long-term valuations will be based on mid-cycle shipping rates (in this case $20,000/day) instead of basing stock valuation on peak or valley shipping rates.
Equity Research is available at no cost to Registered users of Channelchek. Not a Member? Click ‘Join’ to join the Channelchek Community. There is no cost to register, and we never collect credit card information.
This Research is provided by Noble Capital Markets, Inc., a FINRA and S.E.C. registered broker-dealer (B/D).
*Analyst certification and important disclosures included in the full report. NOTE: investment decisions should not be based upon the content of this research summary. Proper due diligence is required before making any investment decision.
Great Lakes Dredge & Dock Corporation is the largest provider of dredging services in the United States. In addition, Great Lakes is fully engaged in expanding its core business into the rapidly developing offshore wind energy industry. The Company has a long history of performing significant international projects. The Company employs experienced civil, ocean and mechanical engineering staff in its estimating, production and project management functions. In its over 131-year history, the Company has never failed to complete a marine project. Great Lakes owns and operates the largest and most diverse fleet in the U.S. dredging industry, comprised of approximately 200 specialized vessels. Great Lakes has a disciplined training program for engineers that ensures experienced-based performance as they advance through Company operations. The Company’s Incident-and Injury-Free® (IIF®) safety management program is integrated into all aspects of the Company’s culture. The Company’s commitment to the IIF® culture promotes a work environment where employee safety is paramount.
Joe Gomes, Managing Director – Generalist Analyst, Noble Capital Markets, Inc.
Joshua Zoepfel, Research Associate, Noble Capital Markets, Inc.
Refer to the full report for the price target, fundamental analysis, and rating.
4Q22 Operating Results. Revenue totaled $146.7 million down from $210 million last year. Gross margin was negative 11%, down from 25.2% in the year ago period. Adjusted EBITDA for the quarter was a negative $24.2 million versus $48.2 million last year. The Company reported a loss of $31.2 million, or a loss of $0.47 per share for the quarter, compared to last year’s net income of $24.7 million, or $0.37 per diluted share.
Drivers. While management in late December had indicated fourth quarter results would be below previous expectations, the decline was even deeper than anticipated. The fourth quarter continued to be impacted by a significantly delayed bid market combined with high inflation, significant weather delays on projects in the Northeast, fewer high margin capital projects, dredging project production issues, higher than anticipated drydock costs, and the retirement of the Terrapin Island.
Equity Research is available at no cost to Registered users of Channelchek. Not a Member? Click ‘Join’ to join the Channelchek Community. There is no cost to register, and we never collect credit card information.
This Company Sponsored Research is provided by Noble Capital Markets, Inc., a FINRA and S.E.C. registered broker-dealer (B/D).
*Analyst certification and important disclosures included in the full report. NOTE: investment decisions should not be based upon the content of this research summary. Proper due diligence is required before making any investment decision.
Euroseas Ltd. was formed on May 5, 2005 under the laws of the Republic of the Marshall Islands to consolidate the ship owning interests of the Pittas family of Athens, Greece, which has been in the shipping business over the past 140 years. Euroseas trades on the NASDAQ Capital Market under the ticker ESEA. Euroseas operates in the container shipping market. Euroseas’ operations are managed by Eurobulk Ltd., an ISO 9001:2008 and ISO 14001:2004 certified affiliated ship management company, which is responsible for the day-to-day commercial and technical management and operations of the vessels. Euroseas employs its vessels on spot and period charters and through pool arrangements.
Michael Heim, CFA, Senior Research Analyst, Noble Capital Markets, Inc.
Refer to the full report for the price target, fundamental analysis, and rating.
Euroseas, LTD reported 2022-4Q results that were generally in line with expectations. Reported EBITDA and Net Income were slightly better than expected due to lower operating costs. However, adjusted EBITDA and Net Income were slightly below expectations due primarily to a $3.9 million reduction associated with the amortization of fair value of below market time charters acquired. The 12.1% increase in net revenues was the result of an increase in the number of vessels (18 versus 15). Average TCE rates of $29,399 per day were slightly above our $28,900 forecast and slightly below year ago rates of $30,068. Steady rates reflect ESEA’s full charter position.
The future continues to look bright for Euroseas. 80% of its ships are fixed for 2023 and 54% for 2024 representing $425 million in contracted revenues. The full order book has become especially important given a sharp decline in shipping rates in the second half of 2022. Unfortunately, a company has repudiated its charter with Euroseas. The company is growing with the order of nine newbuilds — the first of which is to be delivered next month and has a three-year charter at $48,000 per day. The addition of ships at a favorable rate should help offset a decline in rates as ships come off charter and prices are reset to current shipping rates.
Equity Research is available at no cost to Registered users of Channelchek. Not a Member? Click ‘Join’ to join the Channelchek Community. There is no cost to register, and we never collect credit card information.
This Research is provided by Noble Capital Markets, Inc., a FINRA and S.E.C. registered broker-dealer (B/D).
*Analyst certification and important disclosures included in the full report. NOTE: investment decisions should not be based upon the content of this research summary. Proper due diligence is required before making any investment decision.
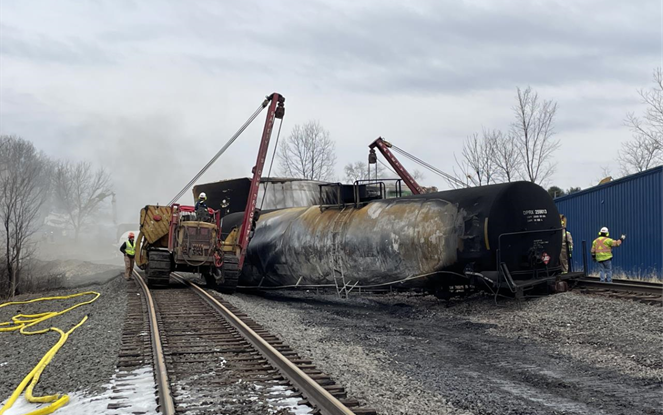
How Dangerous Was the Ohio Chemical Train Derailment? An Environmental Engineer Assesses the Long-Term Risks
State officials offered more details of the cleanup process and a timeline of the environmental disaster during a news conference on Feb. 14, 2023. Nearly a dozen cars carrying chemicals, including vinyl chloride, a carcinogen, derailed on the evening of Feb. 3, and fire from the site sent up acrid black smoke. Officials said they were testing over 400 nearby homes for contamination and tracking a plume of spilled chemicals that had killed 3,500 fish in streams and reached the Ohio River.
However, the slow release of information after the derailment has left many questions unanswered about the risks and longer-term impact. We discussed the chemical release with Andrew Whelton, an environmental engineer who investigates chemical risks during disasters.
This article was republished with permission from The Conversation, a news site dedicated to sharing ideas from academic experts. It represents the research-based findings and thoughts of, Andrew J. Whelton, Professor of Civil, Environmental & Ecological Engineering, Director of the Healthy Plumbing Consortium and Center for Plumbing Safety, Purdue University.
Let’s start with what was in the train cars. What are the most concerning chemicals for human health and the environment long term, and what’s known so far about the impact?
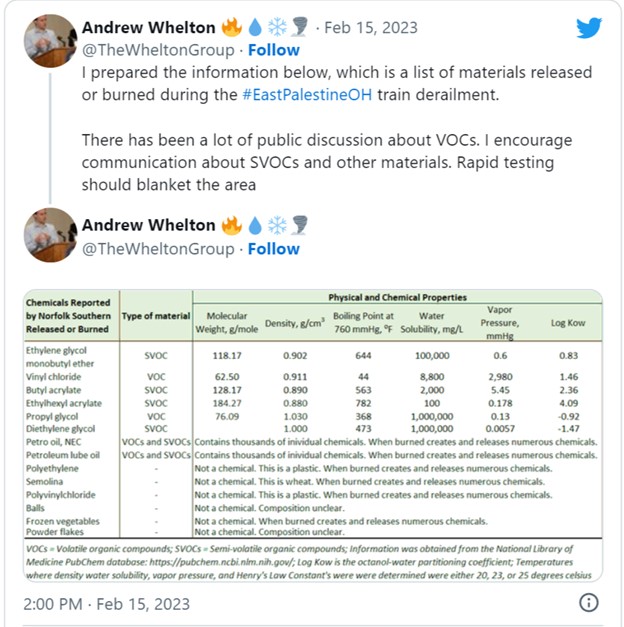
The main concerns now are the contamination of homes, soil and water, primarily from volatile organic compounds and semivolatile organic compounds, known as VOCs and SVOCs.
The train had nearly a dozen cars with vinyl chloride and other materials, such as ethylhexyl acrylate and butyl acrylate. These chemicals have varying levels of toxicity and different fates in soil and groundwater. Officials have detected some of those chemicals in the nearby waterway and particulate matter in the air from the fire. But so far, the fate of many of the chemicals is not known. A variety of other materials were also released, but discussion about those chemicals has been limited.
State officials disclosed that a plume of contamination released into the nearby creek had made its way into the Ohio River. Other cities get their drinking water from the river, and were warned about the risk. The farther this plume moves downstream, the less concentrated the chemical will be in water, posing less of a risk.
Long term, the greatest risk is closest to the derailment location. And again, there’s limited information about what chemicals are present – or were created through chemical reactions during the fire.
It isn’t clear yet how much went into storm drains, was flushed down the streams or may have settled to the bottom of waterways.
There was also a lot of combusted particulate matter. The black smoke is a clear indication. It’s unclear how much was diluted in the air or fell to the ground.
How long can these chemicals linger in soil and water, and what’s their potential long-term risk to humans and wildlife?
The heavier the chemical, often the slower it degrades and the more likely it is to stick to soil. These compounds can remain for years if left unaddressed.
After the Kalamazoo River oil pipeline break in Michigan in 2010, the U.S. Environmental Protection Agency excavated a tributary where the oil settled. We’ve also seen from oil spills on the coasts of Alaska and Alabama that oil chemicals can find their way into soil if it isn’t remediated.
The long-term impact in Ohio will depend in part on how fast – and thoroughly – cleanup occurs.
If the heavily contaminated soils and liquids are excavated and removed, the long-term impacts can be reduced. But the longer removal takes, the farther the contamination can spread. It’s in everyone’s best interest to clean this up as soon as possible and before the region gets rain.
Air-stripping devices, like this one used after the derailment, can help separate chemicals from water. U.S. EPA
Booms in a nearby stream have been deployed to capture chemicals. Air-stripping devices have been deployed to remove chemicals from the waterways. Air stripping causes the light chemicals to leave the water and enter air. This is a common treatment technique and was used after an 2015 oil spill in the Yellowstone River near Glendive, Montana.
At the derailment site in Ohio, workers are already removing contaminated soil as deep as 7 feet (about 2 meters) near where the rail cars burned.
Some of the train cars were intentionally drained and the chemicals set on fire to eliminate them. That fire had thick black smoke. What does that tell you about the chemicals and longer-term risks?
Incineration is one way we dispose of hazardous chemicals, but incomplete chemical destruction creates a host of byproducts. Chemicals can be destroyed when heated to extremely high temperatures so they burn thoroughly.
The black smoke plume you saw on TV was incomplete combustion. A number of other chemicals were created. Officials don’t necessarily know what these were or where they went until they test for them.
We know ash can post health risks, which is why we test inside homes after wildfires where structures burn. This is one reason the state’s health director told residents with private wells near and downwind of the derailment to use bottled water until they can have their wells tested.
The EPA has been screening homes near the derailment for indoor air-quality concerns. How do these chemicals get into homes and what happens to them in enclosed spaces?
Homes are not airtight, and sometimes dust and other materials get in. It might be through an open door or a window sill. Sometimes people track it in.
So far, the U.S. EPA has reported no evidence of high levels of vinyl chloride or hydrogen chloride in the 400 or so homes tested. But full transparency has been lacking. Just because an agency is doing testing doesn’t mean it is testing for what it needs to test for. Media reports talk about four or five chemicals, but the manifest from Norfolk Southern also listed a bunch of other materials in tanks that burned. All those materials create potentially hundreds to thousands of VOCs and SVOCs.
Are Government Officials Testing for Everything they Should?
People in the community have reported headaches, which can be caused by VOCs and other chemicals. They’re understandably concerned.
Ohio and federal officials need to better communicate what they’re doing, why, and what they plan to do. It’s unclear what questions they are trying to answer. For a disaster this serious, little testing information has been shared.
In the absence of this transparency, misinformation is filling that void. From a homeowner’s perspective, it’s hard to understand the true risk if the data is not shared.
EuroDry Ltd. was formed on January 8, 2018 under the laws of the Republic of the Marshall Islands to consolidate the drybulk fleet of Euroseas Ltd. into a separate listed public company. EuroDry was spun-off from Euroseas Ltd. on May 30, 2018; it trades on the NASDAQ Capital Market under the ticker EDRY. EuroDry operates in the dry cargo, drybulk shipping market. EuroDry’s operations are managed by Eurobulk Ltd., an ISO 9001:2008 and ISO 14001:2004 certified affiliated ship management company and Eurobulk (Far East) Ltd. Inc., which are responsible for the day- to-day commercial and technical management and operations of the vessels. EuroDry employs its vessels on spot and period charters and under pool agreements.
Michael Heim, CFA, Senior Research Analyst, Noble Capital Markets, Inc.
Refer to the full report for the price target, fundamental analysis, and rating.
Lower shipping rates hurting results. Eurodry reported 2022-4Q revenues, net, of $15.1 million versus $22.3 million and below our projection of $19.9 million. Average TCE rates for the quarter were $16,689 versus $29,157 and our $18,982 estimate. Lower shipping rates led to a a 54% decline in adj. ebitda and a 78% decrease in adjusted net income. The sharp declines demonstrate Eurodry’s extreme sensitivity to shipping rates.
Shipping rate sensitivity will only increase in upcoming months. Fleet rate coverage drops off dramatically after the 2023-1Q. In fact, all 11 ships will be exposed to spot or indexed prices. This, combined with a further drop in shipping rates in February, could result in a difficult upcoming quarter for the company. Management estimates it would need rates above $12,700 to be cash flow breakeven while noting current prices in the $6,000-$7,000 range.
Equity Research is available at no cost to Registered users of Channelchek. Not a Member? Click ‘Join’ to join the Channelchek Community. There is no cost to register, and we never collect credit card information.
This Research is provided by Noble Capital Markets, Inc., a FINRA and S.E.C. registered broker-dealer (B/D).
*Analyst certification and important disclosures included in the full report. NOTE: investment decisions should not be based upon the content of this research summary. Proper due diligence is required before making any investment decision.
DLH delivers improved health and readiness solutions for federal programs through research, development, and innovative care processes. The Company’s experts in public health, performance evaluation, and health operations solve the complex problems faced by civilian and military customers alike, leveraging digital transformation, artificial intelligence, advanced analytics, cloud-based applications, telehealth systems, and more. With over 2,300 employees dedicated to the idea that “Your Mission is Our Passion,” DLH brings a unique combination of government sector experience, proven methodology, and unwavering commitment to public health to improve the lives of millions. For more information, visit www.DLHcorp.com.
Joe Gomes, Managing Director – Generalist Analyst, Noble Capital Markets, Inc.
Joshua Zoepfel, Research Associate, Noble Capital Markets, Inc.
Refer to the full report for the price target, fundamental analysis, and rating.
A Stronger DLH. The addition of GRSi is a transformative event, in our opinion, creating a more differentiated and powerful Company, with a combined nearly $1 billion of backlog and a new business pipeline that provides significant future growth opportunities. With favorable end markets, DLH is in the right place, at the right time, with the right solutions, in our view.
Strong Growth in Key Programs. DLH saw excellent growth in its key VA and HHS programs. VA pharmacy revenue rose 23% y-o-y to $19.2 million, VA logistics services revenue jumped 15% to $14.5 million, and HHS Head Start revenue increased 34% to $9.1 million, as services offered under this program returned to a more normal pre-COVID level.
Equity Research is available at no cost to Registered users of Channelchek. Not a Member? Click ‘Join’ to join the Channelchek Community. There is no cost to register, and we never collect credit card information.
This Company Sponsored Research is provided by Noble Capital Markets, Inc., a FINRA and S.E.C. registered broker-dealer (B/D).
*Analyst certification and important disclosures included in the full report. NOTE: investment decisions should not be based upon the content of this research summary. Proper due diligence is required before making any investment decision.
DLH delivers improved health and readiness solutions for federal programs through research, development, and innovative care processes. The Company’s experts in public health, performance evaluation, and health operations solve the complex problems faced by civilian and military customers alike, leveraging digital transformation, artificial intelligence, advanced analytics, cloud-based applications, telehealth systems, and more. With over 2,300 employees dedicated to the idea that “Your Mission is Our Passion,” DLH brings a unique combination of government sector experience, proven methodology, and unwavering commitment to public health to improve the lives of millions. For more information, visit www.DLHcorp.com.
Joe Gomes, Managing Director – Generalist Analyst, Noble Capital Markets, Inc.
Joshua Zoepfel, Research Associate, Noble Capital Markets, Inc.
Refer to the full report for the price target, fundamental analysis, and rating.
1QFY23 Results. Revenue totaled $72.7 million, down from $152.8 million in 1Q22, due to the absence of the short-term FEMA contract. DLH reported GAAP earnings of $1.5 million, or $0.11 per diluted share, compared to $7.8 million, or $0.55 per diluted share last year. EBITDA was $6.3 million, or 8.7% of revenue, compared to $13.2 million and 8.6% last year.
Adjusted Results. Adjusting for both the FEMA contribution last year and the partial quarter GRSi contribution in 1Q23, DLH would have reported revenue of $65.9 million, up from $61.7 million a year ago. Adjusted operating income was $5.3 million, compared to $4.9 million. Adjusted net income totaled $3.6 million, or EPS of $0.25, compared to $3.1 million and $0.22 last year. Adjusted EBITDA was $7.2 million, or 10.9% of adjusted revenue, compared to $6.9 million, or 11.1%, last year.
Equity Research is available at no cost to Registered users of Channelchek. Not a Member? Click ‘Join’ to join the Channelchek Community. There is no cost to register, and we never collect credit card information.
This Company Sponsored Research is provided by Noble Capital Markets, Inc., a FINRA and S.E.C. registered broker-dealer (B/D).
*Analyst certification and important disclosures included in the full report. NOTE: investment decisions should not be based upon the content of this research summary. Proper due diligence is required before making any investment decision.
Kratos Defense & Security Solutions, Inc. (NASDAQ:KTOS) develops and fields transformative, affordable technology, platforms, and systems for United States National Security related customers, allies, and commercial enterprises. Kratos is changing the way breakthrough technologies for these industries are rapidly brought to market through proven commercial and venture capital backed approaches, including proactive research, and streamlined development processes. At Kratos, affordability is a technology, and we specialize in unmanned systems, satellite communications, cyber security/warfare, microwave electronics, missile defense, hypersonic systems, training and combat systems and next generation turbo jet and turbo fan engine development. For more information go to www.kratosdefense.com.
Joe Gomes, Managing Director – Generalist Analyst, Noble Capital Markets, Inc.
Joshua Zoepfel, Research Associate, Noble Capital Markets, Inc.
Refer to the full report for the price target, fundamental analysis, and rating.
BQM-177A Targets. Last night, the Department of Defense announced it has awarded Kratos a $49.6 million firm-fixed-price contract for the production and delivery of 55 full rate production Lot 4 BQM-177A Surface Launched Aerial Targets. Included in the award are 55 rocket assisted takeoff attachment kits, 277 mission kits, and associated technical and administrative data. The work is being conducted for the U.S. Navy, as well as the governments of Canada and Australia. The contract is expected to be completed in April 2024.
Valkyrie Flying at Eglin. Eglin Air Force Base recently conducted an operational experimentation test flight of the Valkyrie. Recall, this past fall, two government-owned Kratos XQ-58A Valkyries were transferred to Eglin. Notably, Eglin is an Air Force base as opposed to the Yuma Proving Ground, were the majority of the Valkyrie testing has been done, which is operated by the Army. The resources available at Eglin are a major reason XQ-58A testing found a new home at the base. The Eglin Range communications support infrastructure will allow engineers at the ground station in the Central Control Facility to monitor the vehicle’s performance during flight.
Equity Research is available at no cost to Registered users of Channelchek. Not a Member? Click ‘Join’ to join the Channelchek Community. There is no cost to register, and we never collect credit card information.
This Research is provided by Noble Capital Markets, Inc., a FINRA and S.E.C. registered broker-dealer (B/D).
*Analyst certification and important disclosures included in the full report. NOTE: investment decisions should not be based upon the content of this research summary. Proper due diligence is required before making any investment decision.


