Dramatic Collapse of the Cryptocurrency Exchange FTX Contains Lessons for Investors but Won’t Affect Most People
In the fast-paced world of cryptocurrency, vast sums of money can be made or lost in the blink of an eye. In early November 2022, the second-largest cryptocurrency exchange, FTX, was valued at more than US$30 billion. By Nov. 14, FTX was in bankruptcy proceedings along with more than 100 companies connected to it. D. Brian Blank and Brandy Hadley are professors who study finance, investing and fintech. They explain how and why this incredible collapse happened, what effect it might have on the traditional financial sector and whether you need to care if you don’t own any cryptocurrency.
What Happened?
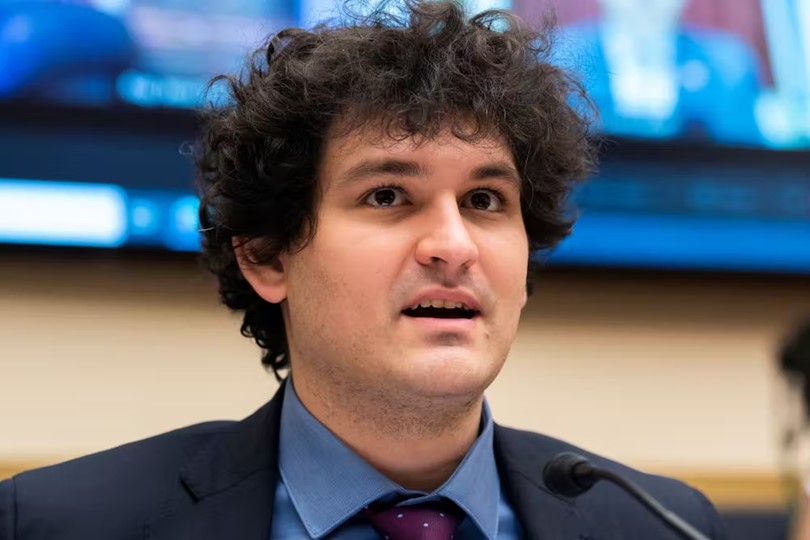
In 2019, Sam Bankman-Fried founded FTX, a company that ran one of the largest cryptocurrency exchanges.
FTX is where many crypto investors trade and hold their cryptocurrency, similar to the New York Stock Exchange for stocks. Bankman-Fried is also the founder of Alameda Research, a hedge fund that trades and invests in cryptocurrencies and crypto companies.
Within the traditional financial sector, these two companies would be separate firms entirely or at least have divisions and firewalls in place between them. But in early November 2022, news outlets reported that a significant proportion of Alameda’s assets were a type of cryptocurrency released by FTX itself.
A few days later, news broke that FTX had allegedly been loaning customer assets to Alameda for risky trades without the consent of the customers and also issuing its own FTX cryptocurrency for Alameda to use as collateral. As a result, criminal and regulatory investigators began scrutinizing FTX for potentially violating securities law.
These two pieces of news basically led to a bank run on FTX.
Large crypto investors, like FTX’s competitor Binance, as well as individuals, began to sell off cryptocurrency held on FTX’s exchange. FTX quickly lost its ability to meet customer withdrawals and halted trading. On Nov. 14, FTX was also hit by an apparent insider hack and lost $600 million worth of cryptocurrency.
That same day, FTX, Alameda Research and 130 other affiliated companies founded by Bankman-Fried filed for bankruptcy. This action may leave more than a million suppliers, employees and investors who bought cryptocurrencies through the exchange or invested in these companies with no way to get their money back.
Among the groups and individuals who held currency on the FTX platform were many of the normal players in the crypto world, but a number of more traditional investment firms also held assets within FTX. Sequoia Capital, a venture capital firm, as well as the Ontario Teacher’s Pension, are estimated to have held millions of dollars of their investment portfolios in ownership stake of FTX. They have both already written off these investments with FTX as lost.

Did a Lack of Oversight Play a Role?
In traditional markets, corporations generally limit the risk they expose themselves to by maintaining liquidity and solvency. Liquidity is the ability of a firm to sell assets quickly without those assets losing much value. Solvency is the idea that a company’s assets are worth more than what that company owes to debtors and customers.
But the crypto world has generally operated with much less caution than the traditional financial sector, and FTX is no exception. About two-thirds of the money that FTX owed to the people who held cryptocurrency on its exchange – roughly $11.3 billion of $16 billion owed – was backed by illiquid coins created by FTX. FTX was taking its customers’ money, giving it to Alameda to make risky investments and then creating its own currency, known as FTT, as a replacement – cryptocurrency that it was unable to sell at a high enough price when it needed to.
In addition, nearly 40% of Alameda’s assets were in FTX’s own cryptocurrency – and remember, both companies were founded by the same person.
This all came to a head when investors decided to sell their coins on the exchange. FTX did not have enough liquid assets to meet those demands. This, in turn, drove the value of FTT from over $26 a coin at the beginning of November to under $2 by Nov. 13. By this point, FTX owed more money to its customers than it was worth.
In regulated exchanges, investing with customer funds is illegal. Additionally, auditors validate financial statements, and firms must publish the amount of money they hold in reserve that is available to fund customer withdrawals. And even if things go wrong, the Securities Investor Protection Corporation – or SIPC – protects depositors against the loss of investments from an exchange failure or financially troubled brokerage firm. None of these guardrails are in place within the crypto world.
Why is this a Big Deal in Crypto?
As a result of this meltdown, the company Binance is now considering creating an industry recovery fund – akin to a private version of SIPC insurance – to avoid future failures of crypto exchanges.
But while the collapse of FTX and Alameda – valued at more than $30 billion and now essentially worth nothing – is dramatic, the bigger implication is simply the potential lost trust in crypto. Bank runs are rare in traditional financial institutions, but they are increasingly common in the crypto space. Given that Bankman-Fried and FTX were seen as some of the biggest, most trusted figures in crypto, these events may lead more investors to think twice about putting money in crypto.
If I Don’t Own Crypto, Should I Care?
Though investment in cryptocurrencies has grown rapidly, the entire crypto market – valued at over $3 trillion at its peak – is much smaller than the $120 trillion traditional stock market.
While investors and regulators are still evaluating the consequences of this fall, the impact on any person who doesn’t personally own crypto will be minuscule. It is true that many larger investment funds, like BlackRock and the Ontario Teachers Pension, held investments in FTX, but the estimated $95 million the Ontario Teachers Pension lost through the collapse of FTX is just 0.05% of the entire fund’s investments.
The takeaway for most individuals is not to invest in unregulated markets without understanding the risks. In high-risk environments like crypto, it’s possible to lose everything – a lesson investors in FTX are learning the hard way.
This article was republished with permission from The Conversation, a news site dedicated to sharing ideas from academic experts. It represents the research-based findings and thoughts of D. Brian Blank, Assistant Professor of Finance, Mississippi State University and Brandy Hadley, Associate Professor of Finance and the David A. Thompson Professor in Applied Investments, Appalachian State University