International Consolidated Uranium Enters the U.S. Uranium Sector with Transformational Acquisition and Strategic Alliance with Energy Fuels


International Consolidated Uranium Enters the U.S. Uranium Sector with Transformational Acquisition and Strategic Alliance with Energy Fuels


– Acquires Portfolio of Projects in the U.S., including Three Past Producing Mines; Enters into Toll-Milling and Operating Agreements –

VANCOUVER, BC and LAKEWOOD, Colo.July 15, 2021 /CNW/ – International Consolidated Uranium Inc. (“CUR“) (TSXV: CUR) (OTCQB: CURUF) and Energy Fuels Inc. (NYSE American: UUUU) (TSX: EFR) (“Energy Fuels“) are pleased to announce that CUR has entered into a definitive asset purchase agreement (the “Purchase Agreement“) with certain wholly-owned subsidiaries of Energy Fuels (collectively, the “EF Parties“) whereby CUR will acquire a portfolio of conventional uranium projects located in Utah and Colorado (the “Projects“) from the EF Parties (collectively, the “Transaction“). In connection with the closing of the Transaction, the companies have also agreed to enter into toll-milling and operating agreements with respect to the Projects which positions CUR as a potential near-term US Uranium producer subject to an improvement in uranium market conditions and/or CUR entering into acceptable uranium supply agreements.

Transaction Highlights:

  • New Entrant into the U.S. Uranium Sector – The acquisition and alliance is expected to establish CUR as a new player in the U.S. uranium sector. The U.S. is currently the largest generator of nuclear power in the world and, by extension, the largest consumer of uranium. At the same time, domestic production of uranium is almost non-existent due to low prices and anti-competitive practices by foreign suppliers. In late 2020, the U.S. government approved the proposed establishment of a U.S. national strategic uranium reserve. Uranium mined by CUR, at one of the acquired Projects, and processed into natural uranium concentrates at Energy Fuels’ White Mesa Mill located near Blanding, Utah, is expected to qualify for the proposed reserve.
  • Unlocks the Value of Past Producing Mines, Permitted and Well-Positioned for Rapid Restart – The portfolio of Projects being acquired pursuant to the Transaction includes, among other assets, the following three permitted, past-producing mines in Utah, which are expected to be the immediate focus of CUR:
    • Tony M Mine – Located in the Henry Mountains area of southeastern Utah, the Project is a large-scale, fully-developed and permitted underground mine that operated most recently in 2008.
    • Daneros Mine – Located in the White Canyon District, the Project is a fully-developed and permitted underground mine that was most recently in production in 2013.
    • Rim Mine – Located in the East Canyon portion of the Uravan Mineral Belt, the Project is a fully-developed and permitted underground mine that was most recently in production in 2009.
  • Strategic Alliance with Energy Fuels, the Leading U.S. Uranium Producer – With the toll-milling agreement for production from the Projects to be executed on closing of the Transaction, CUR will become the only current U.S. uranium developer (other than Energy Fuels) with guaranteed access to Energy Fuels’ White Mesa Mill, which is the only permitted and operating conventional uranium mill in the U.S. Further, the operating agreements will allow the Projects to continue to be managed by the experienced team at Energy Fuels, ensuring a smooth transition.
  • Compelling Acquisition Terms and Structure – The consideration payable to Energy Fuels for the acquisition of the Projects and for securing the toll-milling and operating agreements includes US$2 million payable at closing, Cdn$6 million of deferred cash payable over time, Cdn$5 million of deferred cash payable on commencement of commercial production, and such number of CUR shares that results in Energy Fuels holding 19.9% of the outstanding CUR common shares immediately after closing. CUR will also pay Energy Fuels a management fee, along with a toll milling fee for ore produced at the Projects in the future.
  • Board of Directors Strengthened with Addition of Mark Chalmers. On closing, it is expected that Mark Chalmers, President and CEO of Energy Fuels, will join the CUR Board of Directors. Mr. Chalmers, a mining engineer by training, is a recognized leader in the uranium sector, both in the US and globally, and will bring decades of experience in uranium project development and mining to CUR.

Philip Williams, President and CEO of CUR commented, “We could not be more excited about today’s announcement. Our strategy has been to acquire uranium projects around the world, create critical mass, and target the acquisition of larger, more advanced projects. While the recently announced acquisition of the high-grade Matoush Project in Quebec was a big step forward for CUR, today’s acquisition and alliance with Energy Fuels represents a giant leap. In one transaction, we are entering the important U.S. uranium sector by acquiring past producing mines which are permitted and well positioned for a rapid restart when market conditions are right. And, with the toll-milling agreement for the Projects, we are now the only company other than Energy Fuels to have secured guaranteed access to the White Mesa Mill. This is a truly unique position for CUR. Add to that the operating agreements, which allow us to benefit from the decades of experience that the Energy Fuels team has with these projects, and the addition of Mark Chalmers to the board, and the benefits to CUR and its shareholders are substantial.”

Mark Chalmers commented, “This transaction has all the hallmarks of a true win-win for both parties. Energy Fuels currently holds the largest and highest quality portfolio of uranium production, development, and exploration projects in the U.S. The assets we are selling to CUR are proven U.S. uranium mines, and in fact production from these mines since 2006 has accounted for over 1,050,000 lbs of US uranium production, which would rank those mines as fifth among all current uranium producers in the US over those years. However, because Energy Fuels is focusing its attention on its core projects – the Nichols Ranch and Alta Mesa ISR properties and the Pinyon Plain, La Sal and other conventional properties, we do not believe markets have properly valued the Projects within our expansive portfolio of exceptional assets. We believe that, in order to realize the full value of our expansive portfolio, certain assets, such as the Projects, can be repositioned to the benefit of Energy Fuels and its shareholders, provided we find the right vehicle to unlock the value of these assets. In this transaction, we believe we have found that vehicle in CUR. Having known and worked with the team behind CUR for almost 15 years, I have watched keenly as they have gained market support for their consolidation strategy. This is why we have structured the transaction to provide Energy Fuels with significant exposure to the future share price performance of CUR through a 19.9% equity interest and speaks to our belief in and our commitment to these assets. My joining the CUR board, as well as Energy Fuels’ entering into the toll-milling and operating agreements for the Projects, should also be strong signals as to how important we view our alliance with CUR for these assets.”

Terms of the Asset Purchase Agreement

Pursuant to the Purchase Agreement, CUR will acquire from the EF Parties 100% of the Tony M, Daneros and Rim mines in Utah, as well as the Sage Plain property and eight DOE Leases in Colorado, for the following consideration:

  • the payment of US$2.0 million in cash, payable on closing of the Transaction;
  • the issuance of that number of CUR shares that results in Energy Fuels holding 19.9% of the outstanding CUR common shares immediately after closing of the Transaction;
  • the payment of Cdn$3.0 million in cash on or before the 18-month anniversary of closing of the Transaction;
  • the payment of an additional Cdn$3.0 million in cash on or before the 36-month anniversary of closing of the Transaction; and
  • the payment of up to Cdn$5.0 million in contingent cash payments tied to achieving commercial production at the Tony M Mine, the Daneros Mine and the Rim Mine.

The Purchase Agreement includes provision for the return of the Projects to Energy Fuels in the event that CUR does not make the deferred cash payments as described above.

Closing of the Transaction is subject to satisfaction of certain closing conditions including, among other things, CUR receiving approval of the TSX Venture Exchange. All securities issued in connection with the Agreement are subject to a hold period expiring four months and one day from the date of issuance.

The Strategic Alliance

The strategic alliance between CUR and Energy Fuels for the Projects involves three key components:

  1. The Toll-Milling Agreement – Under this agreement, the EF Parties will toll-mill ore mined from the Projects at the White Mesa Mill, subject to payment by CUR of a toll-milling fee and certain other terms and conditions.
  2. The Operating Agreements – Under these agreements, the EF Parties will provide ongoing services for a fee to maintain the Projects in good standing, as well as additional services as agreed to by the parties.
  3. The Investor Rights Agreement – Under this agreement, for so long as Energy Fuels’ equity ownership in CUR remains at or above 10%, it will be entitled to equity participation rights to maintain its pro rata equity ownership in CUR and to appoint one nominee to the CUR Board of Directors. Energy Fuels has also agreed to certain resale restrictions on the shares of CUR it will hold and to provide voting support in certain circumstances.

Strengthening the Board of Directors

In accordance with the terms of the investor rights agreement to be entered into on closing of the Transaction, for so long as Energy Fuels maintains its equity ownership in the common shares of CUR at or above 10%, Energy Fuels is entitled to nominate one member to the CUR Board of Directors. On closing of the Transaction, it is expected that Energy Fuels will nominate Mark Chalmers, its current President and CEO, to the CUR Board of Directors. Mr. Chalmers has spent nearly his entire career in the uranium industry, taking the role of President and Chief Executive Officer of Energy Fuels on February 1, 2018. He returned to Energy on July 1, 2016 after 15 years working in the uranium sector in the Southern Hemisphere. From 2011 to 2015, Mr. Chalmers served as Executive General Manager of Production for Paladin Energy Ltd., a uranium producer with assets in Australia and Africa, including the Langer Heinrich and Kayelekera mines where, as head of operations, he oversaw sustained, significant increases in production while reducing operating costs. He also possesses extensive experience in ISR uranium production, including management of the Beverley Uranium Mine owned by General Atomics (Australia), and the Highland Mine owned by Cameco Corporation (USA). Mr. Chalmers has also consulted to several of the largest players in the uranium supply sector, including BHP Billiton, Rio Tinto, and Marubeni and, until recently, served as the Chair of the Australian Uranium Council, a position he held for 10 years. Mr. Chalmers is a registered professional engineer and holds a Bachelor of Science in Mining Engineering from the University of Arizona.

The Tony M Mine

The Tony M Mine is located in eastern Garfield County, Utah approximately five miles north of Ticaboo, Utah and approximately 127 road miles west of the White Mesa Mill. The deposit currently forms part of the Henry Mountains Complex.

Uranium mineralization on the property is hosted by favorable sandstone of the Salt Wash Member of the Morrison Formation, a principal uranium host in the US. Mineralization primarily consists of coffinite with minor uraninite, which usually occurs in close association with vanadium mineralization.

The Tony M Mine was originally developed by Plateau Resources Ltd. (“Plateau“) in the late 1970s to provide a nuclear fuel supply to its parent company Consumers Power Company (Consumers) of Michigan. In 1984, operations were suspended.

In February 2007, Denison Mines Corp. (“Denison“) acquired the Tony M property and, following rehabilitation work and re-establishment of surface facilities in 2006, received the necessary operational permits for the reopening of the Tony M underground workings, after which it commenced mining activities in September 2007. Denison operated the mine from September 2007 to November 2008. The following table sets forth the historic production from the Tony M Mine by Plateau and Denison:

Tony M Historic Production

Company

Tons (000s)

%U3O8

Lbs U3O8 (000s)

Plateau (1979-1984)

237

0.12

569

Denison (2007-2008)

162

0.13

422

Totals

399

0.12

991

In 2008, the Tony M Mine was placed on care and maintenance, and in June 2012, Energy Fuels acquired all of Denison’s uranium properties in the United States, including the Henry Mountains Complex. Since acquiring the Henry Mountain Complex, Energy Fuels has not carried out any further exploration work nor conducted any further mine development at the Tony M Mine. The Tony M Mine is currently being maintained in a ready state with all required permits in place to resume operations as market conditions warrant.

In June 2012, Roscoe Postle Associates Inc. prepared a technical report entitled “Technical Report on the Henry Mountains Complex Uranium Property, Utah U.S.A.” for Energy Fuels, which detailed the mineral resource estimate set out in the table below for the Tony M Mine. This mineral resource estimate is considered to be a “historical estimate” for CUR as defined under NI 43-101 – Standards of Disclosure for Mineral Projects (“NI 43-101“). A Qualified Person has not done sufficient work to classify the historical estimate as a current Mineral Resource, and CUR is not treating the historical estimate as a current Mineral Resource. See below under “Technical Disclosure and Qualified Person”.

Tony M Mine Historical Mineral Resource Estimate

Category

Tons (000s)

%U3O8

Lbs U3O8 (000s)

Indicated

1,690

0.24

8,130

Inferred

860

0.16

2,750

Notes:


1.

Mineral Resources were classified in accordance with CIM Definition Standards.

2.

Cut-off grade is 0.10% eU3O8 over a minimum thickness of 2 ft. for the Tony M-Southwest deposit.

3.

Mineral Resources have not been demonstrated to be economically viable.

4.

All mine production by Plateau and Denison has been deducted.

Following closing of the Transaction, CUR intends to undertake a program to verify the historical estimate as a current mineral resource estimate and complete a preliminary economic assessment to quantify the cost, development activity and time required to bring the mine back into production.

The Daneros Mine

The Daneros Mine is located on the Colorado Plateau in San Juan County, Utah approximately 70 miles west of the White Mesa Mill. The property is in the Red Canyon portion of the White Canyon Mining District.

Major uranium deposits in the White Canyon District occur at or near the base of the Upper Triassic Chinle Formation, in fluvial channel deposits of the Shinarump Member, the basal member of the Chinle Formation. Uranium mineralization appears to be related to low-energy depositional environments in that uranium is localized in fluvial sandstones that lie beneath organic-rich lacustrine-marsh mudstone and carbonaceous delta-front sediments.

The Daneros Mine operated from 2009 until October 2012 when the mine was placed on standby. Initially, White Canyon Uranium Limited (“White Canyon“) brought the mine into production by sending millfeed to the White Mesa Mill under a toll-milling agreement with Denison. Daneros was White Canyon’s principal asset. Denison acquired White Canyon in June 2011 for AU$57 Million in cash and continued to operate the mine until its U.S. operations were acquired by Energy Fuels in June 2012. The following table sets forth the historic production from the Daneros Mine:

Daneros Historic Production

Project

Tons (000s)

%U3O8

Lbs U3O8 (000s)

Daneros (2010-2013)

120

0.26

628

Other Mines1

73

0.22

314

Notes:


1)

Other Mines include the Cove (Lark), Bullseye and Spook former mines.  These former mines are located on claims obtained as part of the Transaction.

In March 2018, Peters Geosciences produced a technical report entitled “Updated Report On The Daneros Mine Project, San Juan County, Utah, U.S.A.” for Energy Fuels, which detailed the mineral resource estimate set out in the table below for the Daneros Mine. This mineral resource estimate is considered to be a “historical estimate” for CUR as defined under NI 43-101. A Qualified Person has not done sufficient work to classify the historical estimate as a current Mineral Resource, and CUR is not treating the historical estimate as a current Mineral Resource. See below under “Technical Disclosure and Qualified Person”.

Daneros Mine Historical Mineral Resource Estimate

Project

Tons (000s)

%U3O8

Lbs U3O8 (000s)

Indicated

20

0.36

142

Inferred

7

0.37

52

Notes:


1)

Mineral Resources were classified in accordance with CIM Definition Standards.

2)

Mineral Resources are estimated at a cut-off grade of 0.23% eU3O8.

3)

Mineral Resources are estimated using a long-term uranium price of $55 per pound U3O8.

4)

A minimum thickness of 1 foot was used.

5)

Bulk density is 0.07143 ton/ft3 (14 ft3/ton).

6)

Mineral Resources are exclusive of Mineral Reserves and do not have demonstrated economic viability.

7)

Numbers may not add due to rounding.

The Daneros Mine remains fully permitted and well-positioned for restarting operations on an expeditious basis as market conditions warrant. Following closing of the Acquisition, CUR intends to perform surface drilling to verify the historical estimate as a current mineral resource estimate and connectivity of resources. Following mine restart, CUR expects to perform underground long hole drilling to determine the likely location of any mineral resources and where to drive mine headings to best access these resources.

Rim Mine

The Rim Mine is a permitted, formerly producing mine located 15 miles northeast of Monticello, Utah in San Juan County, approximately 62 road miles from the White Mesa Mill. The property consists of 26 unpatented lode mining claims, a private lease, and a Utah State Mineral Lease totaling about 1,100 acres. The mine has operated historically on a periodic basis starting in the mid-1960s. Mining last occurred in early 2008 by Denison and ceased in late 2010. Energy Fuels acquired the property in 2012 and has maintained it on care and maintenance since that time, such that it can be restarted with relatively little permitting or development costs as market conditions warrant.

A previous internal resource estimate by Energy Fuels (this estimate was not completed in accordance with the disclosure standards of NI 43-101), indicated that the project has high vanadium grades at 1.83% V2O5 and a ~9.15:1 uranium-to-vanadium ratio, and the table below sets out the previous resource estimate (using categories other than those set out in section 1.2 and 1.3 of NI 43-101). This estimate is considered to be a “historical estimate” for CUR as defined under NI 43-101. A Qualified Person has not done sufficient work to classify the historical estimate as a current Mineral Resource, and CUR is not treating the historical estimate as a current Mineral Resource. See below under “Technical Disclosure and Qualified Person”.

Rim Mine Historical Mineral Resource Estimate


Tons 
(000s)

%U3O8

Lbs U3O8 (000s)

%V2O5

Lbs V2O5 (000s)

Inferred

82

0.20

327

1.83

3,028

Notes:


1)

The historical estimates for RIM do not comply with CIM Definition Standards on Mineral Resources and Mineral Reserves as required by NI 43-101 and have no comparable resource classification.

2)

Mineral Resources are estimated at a cut-off grade of 0.10% U3O8.

3)

A minimum thickness of 3 feet was used.

Sage Plain  

The Sage Plain Property is located about 16 miles northeast of Monticello, Utah and approximately 54 road miles from the White Mesa Mill. The Sage Plain District (also referred to as the Egnar District or Summit Point District) is a portion of the greater Slick Rock District. It is the southwest continuation into Utah of the prolific Uravan Mineral Belt.

Uranium-vanadium deposits were first discovered in the Morrison Formation 32 miles north of the Sage Plain Project in the 1880s. Uranium and vanadium mineralization at the Sage Plain project is hosted in sandstones of the Salt Wash Member of the Morrison Formation, which is also the host unit for the uranium deposits at the Rim Mine, Tony M project and the DOE leases in western Colorado. The Morrison sediments accumulated as oxidized detritus in the fluvial environment. However, there were isolated environments where reduced conditions existed, such as oxbow lakes and carbon-rich point bars where the uranium precipitated. While Sage Plain is part of the Uravan Mineral Belt, it has a significantly higher ratio of V2O5:U3O8 in the rock than the deposits farther north. Vanadium may have been leached from the detrital iron-titanium mineral grains and subsequently deposited along with or prior to the uranium.

The project area is at the location of the historic Calliham Mine. The current Sage Plain landholdings consist of two fee mineral leases covering about 960 acres (Calliham and Crain) and a Utah State lease of 640 acres.

The Calliham Mine was in production from the 1970s to the early 1980s by Atlas Minerals. The Calliham Mine property was explored in the early 1970s by Hecla Mining Company. The Calliham lease was acquired by Atlas Minerals and went into production in March 1976. Atlas Minerals departed the uranium business in the region in the mid-1980s. The Calliham Mine and associated leases were acquired by Umetco Minerals (“Umetco“) in 1988 and operated briefly in 1990-1991 during a spike in vanadium prices. During Umetco’s tenure, the Calliham Mine produced 13,300 tons of ore averaging 0.21% U3O8 (~56,000 lbs. U3O8) and 1.29% V2O5 (~343,000 lbs. V2O5). This ore was milled at the White Mesa Mill near Blanding, Utah. All infrastructure from the historic mine has been removed and all permits have lapsed. The following table sets forth the historic production from the Calliham Mine:

Calliham Mine Historic Production

Operator

Tons (000s)

%U3O8

Lbs U3O8 (000s)

%V2O5

Lbs V2O5 (000s)

Atlas

209

0.15

605

0.90

3,773

Umetco

13

0.21

56

1.29

343

Total

221

0.15

661

0.93

4,116

In a technical report entitled “UPDATED TECHNICAL REPORT ON SAGE PLAIN PROJECT (Including the Calliham Mine)” dated March 18, 2015, the mineral resource estimate set out in the table below was published. This mineral resource estimate is considered to be a “historical estimate” for CUR as defined under NI 43-101. A Qualified Person has not done sufficient work to classify the historical estimate as a current Mineral Resource, and CUR is not treating the historical estimate as a current Mineral Resource. See below under “Technical Disclosure and Qualified Person”.

Calliham/Crain Historical Mineral Resource Estimate


Tons (000s)

%U3O8

Lbs U3O8 (000s)

%V2O5

Lbs V2O5 (000s)

Measured

240

0.16

772

1.32

6,349

Indicated

13

0.10

26

0.77

199

Inferred

10

0.13

25

0.94

188

Notes:


1)

Grades and tonnages shown as diluted amounts.

2)

Vanadium grades are based on assays where known, otherwise estimated at the average V2O5:U3O8 ratios for the individual properties used by previous operators based on core assay data and past production.

3)

Mineral Resources were classified in accordance with CIM Definition Standards.

The DOE Leases

The DOE leases are located in the historically productive Uravan Mineral Belt portion of MesaMontrose, and San Miguel Counties, Colorado. The tracts are designated C-SR-12, C-SR-16A, C-AM-19, C-AM-19A, C-AM-20, C-CM-24, C-G-26, and C-G-27. The leases are located 80-175 road miles from the White Mesa Mill. New 10-year leases for these lease tracts were executed by Energy Fuels on January 6, 2020.

Technical Disclosure and Qualified Person

The scientific and technical information contained in this news release was reviewed and approved by Dean T. Wilton, CPG-7659, who is a “Qualified Person” (as defined in NI 43-101). 

Each of the above estimates are considered to be “historical estimates” as defined under NI 43-101 for CUR, and have been sourced as follows:

  1. Tony M Mine: reported by Energy Fuels in a Technical Report entitled “Technical Report on the Henry Mountains Complex Uranium Property, Utah U.S.A.” prepared by William E. RoscoeDouglas H. Underhill, and Thomas C. Pool of Roscoe Postle Associates, Inc., dated June 27, 2012;
  2. Daneros Mine: reported by Energy Fuels in a Technical Report entitled “Updated Report on the Daneros Mine Project, San Juan County, Utah, U.S.A.”, prepared by Douglas C. Peters, C. P. G., of Peters Geosciences, dated March 2, 2018;
  3. Rim Mine: reported by Energy Fuels in an internal company report entitled “Rim Resource Evaluation” prepared by Energy Fuels dated June 14, 2018; and
  4. Sage Plain Project: reported by Energy Fuels in a Technical Report entitled “Updated Technical Report on Sage Plain Project (Including the Calliham Mine)”, prepared by Douglas C. Peters, CPG of Peters Geosciences, dated March 18, 2015.

In each instance, other than with respect to Rim, the historical estimate is reported using the categories of Mineral Resources and Mineral Reserves as defined by the Canadian Institute CIM Definition Standards for mineral reserves, and mineral reserves that are incorporated by reference into National Instrument 43-101, and these “historical estimates” are not considered by CUR to be current. The historical estimates for Rim do not comply with CIM Definition Standards on Mineral Resources and Mineral Reserves as required by NI 43-101 and have no comparable resource classification. In each instance, the reliability of the historical estimate is considered reasonable, but a Qualified Person has not done sufficient work to classify the historical estimate as a current Mineral Resource and CUR is not treating the historical estimate as a current Mineral Resource. The historical information provides an indication of the exploration potential of the properties but may not be representative of expected results.

For the Tony M Mine, as disclosed in the above noted technical report, the historical mineral resources were estimated by Denison using the contour method and were audited by Scott Wilson RPA in the 2009 Technical Report (Underhill and Roscoe, 2009). CUR would need to review and verify the scientific information and conduct an analysis and reconciliation of production data in order to verify the Tony M historical estimate as a current Mineral Resource.

For the Daneros Mine, as disclosed in the above noted technical report, the historical estimate was prepared by Energy Fuels using a wireframe model of the mineralized zone based on an outside bound of a 0.05% eU3O8 grade cutoff at a minimum thickness of 1 foot. CUR would need to conduct surface drilling to confirm resources and connectivity of resources in order to verify the Daneros historical estimate as a current Mineral Resource.

For the Rim Mine, as disclosed in the above noted internal report, the historical estimate was prepared internally by Energy Fuels using the inverse distance squared interpolation method and checked by the nearest neighbor (polygonal) method. CUR would need to conduct an exploration program, including twinning of historical drill holes in order to verify the RIM historical estimate as a current Mineral Resource.

For the Sage Plain Project, as disclosed in the above noted technical report, the historical estimate was prepared by Peters Geosciences using modified polygonal method. CUR would need to conduct an exploration program, including twinning of historical drill holes in order to verify the Sage Plain historical estimate as a current Mineral Resource.

About Energy Fuels Inc.

Energy Fuels is a leading U.S.-based uranium mining company, supplying U3O8 to major nuclear utilities. Energy Fuels also produces vanadium from certain of its projects, as market conditions warrant, and is ramping up to commercial production of rare earth carbonate in 2021. Its corporate offices are in Lakewood, Colorado, near Denver, and all of its assets and employees are in the United States. Energy Fuels holds three of America’s key uranium production centers: the White Mesa Mill in Utah, the Nichols Ranch ISR Project in Wyoming, and the Alta Mesa ISR Project in Texas. The White Mesa Mill is the only conventional uranium mill operating in the U.S. today, has a licensed capacity of over 8 million pounds of U3O8 per year, has the ability to produce vanadium when market conditions warrant, as well as REE carbonate from various uranium-bearing ores. The Nichols Ranch ISR Project is on standby and has a licensed capacity of 2 million pounds of U3O8 per year. The Alta Mesa ISR Project is also on standby and has a licensed capacity of 1.5 million pounds of U3O8 per year. In addition to the above production facilities, Energy Fuels also has one of the largest NI 43-101 compliant uranium resource portfolios in the U.S. and several uranium and uranium/vanadium mining projects on standby and in various stages of permitting and development. The primary trading market for Energy Fuels’ common shares is the NYSE American under the trading symbol “UUUU,” and Energy Fuels’ common shares are also listed on the Toronto Stock Exchange under the trading symbol “EFR.” Energy Fuels’ website is www.energyfuels.com.

About International Consolidated Uranium

International Consolidated Uranium Inc. (TSXV: CUR) is well financed to execute its strategy of consolidating and advancing uranium projects around the globe. The Company has acquired a 100% interest or has entered into option agreements to acquire a 100% interest in seven uranium projects, in AustraliaCanada, and Argentina, each with significant past expenditures and attractive characteristics for development. CUR has entered into option agreements with Mega Uranium Ltd. (TSX: MGA) to acquire a 100% interest in the Ben Lomond and Georgetown uranium projects in Australia; with IsoEnergy Ltd. (TSXV: ISO) to acquire a 100% interest in the Mountain Lake uranium project in Nunavut, Canada; with a private individual to acquire a 100% interest in the Moran Lake uranium and vanadium project in Labrador, Canada; and with U3O8 Corp. (TSXV: UWE.H) to acquire a 100% interest in the Laguna Salada uranium and vanadium project in Argentina. CUR has also acquired a 100% interest in the Dieter Lake uranium project and entered into an agreement to acquire a 100% interest in the Matoush uranium project, both in Quebec, Canada. The option agreement with IsoEnergy for Mountain Lake and the option agreement with U3O8 Corp. for Laguna Salada both remain subject to regulatory approval.

Neither TSX Venture Exchange nor its Regulations Services Provider (as that term is defined in policies of the TSX Venture Exchange) accepts responsibility for the adequacy or accuracy of this release.

Cautionary Statement Regarding Forward-Looking Information.

This news release contains “forward-looking information” within the meaning of applicable Canadian and U.S. securities legislation. “Forward-looking information” includes, but is not limited to, statements with respect to activities, events or developments that CUR and Energy Fuels expect or anticipate will or may occur in the future including: any expectation that the Transaction will be completed; any expectation as to the accuracy of mineral resource estimates; any expectation with respect to any permitting, development or other work that may be required to bring any of the Projects into production; any expectation that any of the Projects can be brought back into production rapidly or expeditiously; any expectations as to future exploration potential for any of the Projects; any expectation as to the outcome or success of any proposed programs for any of the Projects; any expectation that the proposed strategic alliance will be successful or that the transition of ownership of the Projects will be smooth; any expectation that the Transaction will be a win-win transaction for both CUR and Energy Fuels; any expectation that the Transaction will result in the market properly valuing the Projects; any expectation as to the future performance of CUR’s shares and the value of Energy Fuel’s share position in CUR; any expectation that Energy Fuels will maintain its share position in CUR in the longer term; any expectation that market conditions will warrant future production from any of the Projects; any expectation that any future production payments will become due and payable and be paid; any expectation that the TSXV will approve the Transaction; any expectation that the proposed uranium reserve will be established and the terms and conditions of the proposed uranium reserve; and any expectation that any uranium produced from the Projects will be eligible for the proposed uranium reserve. Generally, but not always, forward-looking information and statements can be identified by the use of words such as “plans”, “expects”, “is expected”, “budget”, “scheduled”, “estimates”, “forecasts”, “intends”, “anticipates”, or “believes” or the negative connotation thereof or variations of such words and phrases or state that certain actions, events or results “may”, “could”, “would”, “might” or “will be taken”, “occur” or “be achieved” or the negative connotation thereof. This information involves known and unknown risks, uncertainties and other factors that may cause actual results or events to differ materially from those anticipated in such forward-looking information. Factors that could cause actual results to differ materially from those anticipated in these forward-looking statements include risks associated with: the failure to close the Transaction; potential conflicts of interest between CUR and Energy Fuels; the costs associated with bringing any of the Projects back into production; permitting and regulatory delays; litigation risks; competition from others; market factors, including future demand for and prices realized from the sale of uranium and vanadium; the proposed uranium reserve never being established or the uranium reserve if established not benefitting the Projects; government actions that could restrict or eliminate the ability to mine on public lands, such as through the creation or expansion of national monuments or through mineral withdrawals; and the policies and actions of foreign governments, which could impact the competitive supply of and global markets for uranium and vanadium. Forward-looking statements contained herein are made as of the date of this news release, and CUR and Energy Fuels disclaim, other than as required by law, any obligation to update any forward-looking statements whether as a result of new information, results, future events, circumstances, or if management’s estimates or opinions should change, or otherwise. There can be no assurance that forward-looking statements will prove to be accurate, as actual results and future events could differ materially from those anticipated in such statements. Accordingly, the reader is cautioned not to place undue reliance on forward-looking statements. CUR and Energy Fuels assume no obligation to update the information in this communication, except as otherwise required by law.

SOURCE Energy Fuels Inc.

For further information: International Consolidated Uranium Inc.: Philip Williams, President and CEO, +1 778 383 3057, pwilliams@consolidateduranium.com; Energy Fuels: Curtis Moore, VP of Marketing & Corporate Development, (303) 974-2154, cmoore@energyfuels.com

Virtual Roadshow with InPlay Oil (IPOOF)(IPO:CA) President & CEO Douglas Bartole


InPlay Oil President & CEO Douglas Bartole makes a formal corporate presentation. Afterwards, he is joined by Noble Capital Markets Senior Research Analyst Michael Heim for a Q & A session featuring questions asked by the live audience throughout the event.

Research, News, and Advanced Market Data on IPOOF


Information on upcoming live virtual roadshows

About InPlay Oil

InPlay, based in Calgary, Alberta, has been engaged in the business of exploring for, developing and producing oil and natural gas, and acquiring oil and natural gas properties in western Canada since it commenced operations as a private company in June 2013. InPlay has concentrated on exploration and development drilling of light oil prospects in the Province of Alberta in a focused area of Central and West Central Alberta. The InPlay management team has worked closely together for several years in both private and public company environments and has an established track record of delivering cost-effective per share growth in reserves, production, AFF and funds flow. InPlay will continue to implement its proven strategy of exploring, acquiring, and exploiting assets with a long-term focus on large, light oil resources. The InPlay management team brings a full spectrum of geotechnical, engineering, negotiating and financial experience to its investment decisions. An updated corporate presentation will be posted to InPlay’s website in due course. Additional information about the Company can be found on SEDAR and on InPlay’s website at: www.inplayoil.com.

Release – Gevo to Report Second Quarter 2021 Financial Results on August 12 2021


Gevo to Report Second Quarter 2021 Financial Results on August 12, 2021


ENGLEWOOD, Colo., July 14, 2021 (GLOBE NEWSWIRE) — Gevo, Inc. (NASDAQ: GEVOannounced today that it will host a conference call on Thursday, August 12, 2021 at 4:30 p.m. EDT (2:30 p.m. MDT) to report its financial results for the second quarter ended June 30, 2021 and provide an update on recent corporate highlights.
 

To participate in the conference call, please dial 1 (833) 729-4776 (inside the U.S.) or 1 (830) 213-7701 (outside the U.S.) and reference the access code 2267135# or through the event weblink: https://edge.media-server.com/mmc/p/8w4ypxhw

A replay of the call and webcast will be available two hours after the conference call ends on August 12, 2021. To access the replay, please dial 1 (855) 859-2056 (inside the U.S.) or 1 (404) 537-3406 (outside the U.S.) and reference the access code 2267135#. The archived webcast will be available in the Investor Relations section of Gevo’s website at www.gevo.com .

About Gevo

Gevo’s mission is to transform renewable energy and carbon into energy-dense liquid hydrocarbons. These liquid hydrocarbons can be used for drop-in transportation fuels such as gasoline, jet fuel and diesel fuel, that when burned have potential to yield net-zero greenhouse gas emissions when measured across the full life cycle of the products. Gevo uses low-carbon renewable resource-based carbohydrates as raw materials, and is in an advanced state of developing renewable electricity and renewable natural gas for use in production processes, resulting in low-carbon fuels with substantially reduced carbon intensity (the level of greenhouse gas emissions compared to standard petroleum fossil-based fuels across their life cycle). Gevo’s products perform as well or better than traditional fossil-based fuels in infrastructure and engines, but with substantially reduced greenhouse gas emissions. In addition to addressing the problems of fuels, Gevo’s technology also enables certain plastics, such as polyester, to be made with more sustainable ingredients. Gevo’s ability to penetrate the growing low-carbon fuels market depends on the price of oil and the value of abating carbon emissions that would otherwise increase greenhouse gas emissions. Gevo believes that its proven, patented technology enabling the use of a variety of low-carbon sustainable feedstocks to produce price-competitive low-carbon products such as gasoline components, jet fuel and diesel fuel yields the potential to generate project and corporate returns that justify the build-out of a multi-billion-dollar business.

Gevo believes that the Argonne National Laboratory GREET model is the best available standard of scientific-based measurement for life cycle inventory or LCI.

Learn more at Gevo’s website: www.gevo.com

Investor and Media Contact

+1 720-647-9605

IR@gevo.com

Gevo to Report Second Quarter 2021 Financial Results on August 12, 2021


Gevo to Report Second Quarter 2021 Financial Results on August 12, 2021


ENGLEWOOD, Colo., July 14, 2021 (GLOBE NEWSWIRE) — Gevo, Inc. (NASDAQ: GEVOannounced today that it will host a conference call on Thursday, August 12, 2021 at 4:30 p.m. EDT (2:30 p.m. MDT) to report its financial results for the second quarter ended June 30, 2021 and provide an update on recent corporate highlights.
 

To participate in the conference call, please dial 1 (833) 729-4776 (inside the U.S.) or 1 (830) 213-7701 (outside the U.S.) and reference the access code 2267135# or through the event weblink: https://edge.media-server.com/mmc/p/8w4ypxhw

A replay of the call and webcast will be available two hours after the conference call ends on August 12, 2021. To access the replay, please dial 1 (855) 859-2056 (inside the U.S.) or 1 (404) 537-3406 (outside the U.S.) and reference the access code 2267135#. The archived webcast will be available in the Investor Relations section of Gevo’s website at www.gevo.com .

About Gevo

Gevo’s mission is to transform renewable energy and carbon into energy-dense liquid hydrocarbons. These liquid hydrocarbons can be used for drop-in transportation fuels such as gasoline, jet fuel and diesel fuel, that when burned have potential to yield net-zero greenhouse gas emissions when measured across the full life cycle of the products. Gevo uses low-carbon renewable resource-based carbohydrates as raw materials, and is in an advanced state of developing renewable electricity and renewable natural gas for use in production processes, resulting in low-carbon fuels with substantially reduced carbon intensity (the level of greenhouse gas emissions compared to standard petroleum fossil-based fuels across their life cycle). Gevo’s products perform as well or better than traditional fossil-based fuels in infrastructure and engines, but with substantially reduced greenhouse gas emissions. In addition to addressing the problems of fuels, Gevo’s technology also enables certain plastics, such as polyester, to be made with more sustainable ingredients. Gevo’s ability to penetrate the growing low-carbon fuels market depends on the price of oil and the value of abating carbon emissions that would otherwise increase greenhouse gas emissions. Gevo believes that its proven, patented technology enabling the use of a variety of low-carbon sustainable feedstocks to produce price-competitive low-carbon products such as gasoline components, jet fuel and diesel fuel yields the potential to generate project and corporate returns that justify the build-out of a multi-billion-dollar business.

Gevo believes that the Argonne National Laboratory GREET model is the best available standard of scientific-based measurement for life cycle inventory or LCI.

Learn more at Gevo’s website: www.gevo.com

Investor and Media Contact

+1 720-647-9605

IR@gevo.com

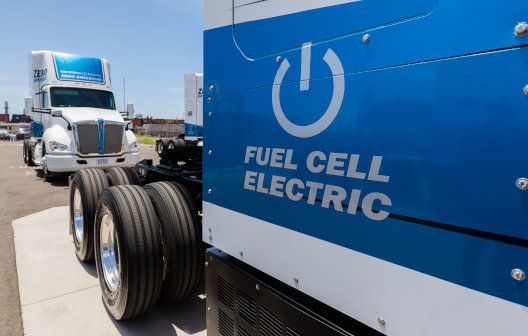
Lithium-Ion Power vs Hydrogen Fuel Cell


Image Credit: TruckPR (Flickr)


Lithium Battery vs. Hydrogen Fuel Cell Vehicles


When it comes to comparing battery-powered Electric Vehicles (EVs) and hydrogen fuel cell batteries to determine which technology will win the future, there is no reason to select one and expect the complete demise of the other. Just as diesel vehicles operate alongside gasoline powered cars and trucks, lithium-ion batteries and hydrogen fuel cell powered vehicles can co-exist. And like gasoline and diesel, they each have advantages and disadvantages that would make one better in some applications than the other. It is important for investors evaluating expected changes in transportation to understand the differences and pros and cons of one over the other.


The Future

Electric power would certainly seem to be the future of personal transportation. There are two competing means to source or store electricity.  Battery-powered electric vehicles (BEVs) and hydrogen fuel cell electric vehicles (FCEVs) are in tighter competition than they may appear. While BEVs have attained a great deal of traction, FCEVs may be the come-from-behind favorite when sustainability and utility are measured.  We’ll discuss how each works and the known differences.  


Current Technology

FCEVs are not hydrogen combustion engine propelled. Their motor is electric and shouldn’t be confused with those that burn hydrogen in much the same way as a car is propelled by gasoline. With both, an FCEV and a BEV, electric power stored or created onboard is delivered to one or more electric motors.

The FCEV produces electricity via a chemical reaction in a fuel cell between expendable hydrogen and oxygen. The hydrogen is then replenished via a filling station, not unlike gas or diesel.

In a BEV, electricity is stored in a lithium-ion battery, à la current day smartphones. That charge retained by the li-ion battery is distributed to the motor(s) on board.


Pros, Cons and Electrons

Hydrogen-powered EVs have a weight-to-power ratio many times greater than lithium stored energy. The lighter, more powerful fuel cell gives the FCEV vehicle a much greater driving distance at a reduced weight. BEVs using 2021 technology would have to be made considerably heavier (additional battery storage) to even compare to the average gasoline powered car on the road.  When electric output of any method is discussed, the terminology most often used is power density. Li-ion batteries are not as power dense as a similar weight tank full of hydrogen. Significant range can be added to a hydrogen vehicle without adding a great deal more heft.  As far as vehicles using li-ion storage, adding additional output often works against the ability to go farther as it has to now propel much greater weight.

The next generation of batteries for BEVs are expected to be solid-state. The difference is lithium-ion batteries are composed of a cathode, anode, separator, and electrolyte. At present they use a liquid electrolyte solution. Solid-state batteries use solid electrolytes, not liquid. This change in the battery construction is expected to add, on average, 600 miles to the range. This would tend to place the two vehicle types in the same range category – with no similar breakthroughs expected for FCEVs. An important added bonus will be that they will take about half the time to charge versus current liquid electrolyte lithium batteries.

The added range does make the technology competitive, considering most don’t drive more than 10 hours a day. With this in mind, the general consensus is that FCEVs are the preferred choice for long-distance travel. BEVs are more practical for shorter trips. In their present configurations, on average, an FCEV can outdistance a BEV by about 100 miles.


Usability

 Refueling time gives FCEVs a large edge. Filling up a tank with hydrogen takes as much time as filling it up with gas or diesel. A drive from New York to Florida would require three five-minute stops with the average FCEV, a BEV may require four stops of approximately five hours on the same trip.  The travel time could then be twice as long. While lithium-ion batteries have a limited number of charging cycles, hydrogen fuel cells’ overall life expectancy is much greater.

Its power density and fast refueling times are two reasons hydrogen is revolutionizing the commercial vehicle industry. Long-haul transport trucks would have to reduce their cargo weight if they had heavy batteries; a smaller battery would cut down on the range, which adds to the time and cost to deliver its haul.


Longevity

BEVs are at a disadvantage in lifespan. While most BEV manufacturers offer up to 8 years or 100,000 miles warranty on their lithium-ion batteries, the batteries themselves can only take a limited amount of charging cycles before they start to lose their ability to retain a charge. The batteries have thermal buffers which prevent overcharging or over depletion to extend their lifespan, but owners will not experience the longevity of a fuel cell.  In fact, the range, not unlike charging time in a cell phone, becomes increasingly less as it ages. Replacing a battery is a big expense. Fuel cell replacements are not as expensive. The downside of a fuel cell is short-distance driving puts severe stress on its membrane and reduces the lifespan. Continuous use where the cell remains wetted would allow it to extend its life by almost 800%. This is another reason for it to be preferred in long-distance applications rather than constant short trips.


Safety

Hydrogen cars like the Toyota Mirai, the Honda FCX Clarity and the Hyundai Nexo have all been cleared as safe to drive and have no record of major incidents. The same cannot be said for BEVs which have had issues that have been addressed over the years. However, the storage and transportation of hydrogen, along with the refueling process does pose risks. Separating hydrogen atoms at refueling stations, rather than transporting in tank trucks can combat much of this risk.  

The perceived and even expected dangers of hydrogen-powered cars has not been demonstrated with statistics. Hydrogen has been transported for industrial use for years, without incident, and there have been no notable incidents with the manufactured FCEVs in actual use.


Sustainability

Hydrogen powered cars actually filter air as they drive, leaving a trail of clearer air. With large-scale production of green hydrogen (clean electrons, produced using renewable energy sources) FCEVs are by far the more sustainable EVs. Especially since they don’t even leave battery waste.


Availability

There is very little in the US or elsewhere which allows hydrogen vehicle refilling. Unless a network is built, all the benefits of hydrogen over alternatives are moot points.

According to a research journal “Compendium of Hydrogen Energy”, published by J. Wind, “About 200 hydrogen refueling stations have been installed worldwide; around 85 of these are located in Europe and approximately 80 in the US (mainly California).”


Suggested Reading:


Investment Opportunities in Hydrogen


The Future of Electric Vehicles


Ford’s Announcement is Another Reason for Copper Investors to Smile


Lithium-ion Battery Recycling Heats Up


Sources:

https://openroadautogroup.com/blog/bev-phev-hev-fcev-key-differences-between-electric-car-options

https://www.scribd.com/book/282668156/Compendium-of-Hydrogen-Energy-Hydrogen-Storage-Distribution-and-Infrastructure

https://www.fueleconomy.gov/feg/fcv_sbs.shtml


Stay up to date. Follow us:


Release – Capstone Green Energy Expands its Energy as a Service Business by Securing a 2 MW Long-Term Rental Contract


CAPSTONE GREEN ENERGY EXPANDS ITS ENERGY AS A SERVICE (EAAS) BUSINESS BY SECURING A 2 MW LONG-TERM RENTAL CONTRACT

VAN
NUYS, CA / ACCESSWIRE / July 9, 2021 /
 Capstone Green Energy Corporation (www.CapstoneGreenEnergy.com) (
NASDAQ:CGRN), formerly Capstone Turbine Corporation (www.capstoneturbine.com) (NASDAQ:CPST) (“Capstone” or the “Company”), announced today that it signed a contract for a two megawatt (MW) long-term rental contract as it continues to expand its microturbine rental business as part of its growing Energy as a Service (EaaS) business model.

The new, multi-year rental contract provides two C1000 Signature Series microturbines scheduled to be installed by the end of the current fiscal year. They will be used in an industrial combined heat and power (CHP), energy efficiency application configured with ten of Capstone’s Integrated Heat Recovery Modules (iHRM) to produce thermal energy. The customer will use the hot water generated from the units in its manufacturing process, thereby improving their overall energy efficiency, saving money, and reducing the site’s carbon footprint.

This contract was secured by Capstone’s local distribution partner, Cal Microturbine, Capstone’s exclusive distributor for California, Hawaii, and Nevada and nonexclusive for Oregon and Washington (www.calmicroturbine.com).

“Expanding Capstone’s Energy as a Service business, which includes the long-term rental program, is an important element for the company achieving its profitability goals. Capstone is a proud green energy company, having focused for a long time on transforming the way businesses think about on-site energy production,” said Darren Jamison, President and Chief Executive Officer of Capstone Green Energy. “Today, we are excited to be able to offer our customers Energy as a Service and strengthen our commitment to creating smarter energy for a cleaner future, as carbon reduction has increasing value to our customers,” added Mr. Jamison.

About Capstone Green Energy
Capstone Green Energy (www.CapstoneGreenEnergy.com) (NASDAQ:CGRN) is a leading provider of customized microgrid solutions and on-site energy technology systems focused on helping customers around the globe meet their environmental, energy savings, and resiliency goals. Capstone Green Energy focuses on four key business lines. Through its Energy as a Service (EaaS) business, it offers rental solutions utilizing its microturbine energy systems and battery storage systems, comprehensive Factory Protection Plan (FPP) service contracts that guarantee life-cycle costs, as well as aftermarket parts. Energy Conversion Products are driven by the Company’s industry-leading, highly efficient, low-emission, resilient microturbine energy systems offering scalable solutions in addition to a broad range of customer-tailored solutions, including hybrid energy systems and larger frame industrial turbines. The Energy Storage Products business line designs and installs microgrid storage systems creating customized solutions using a combination of battery technologies and monitoring software. Through Hydrogen Energy Solutions, Capstone Green Energy offers customers a variety of hydrogen products, including the Company’s microturbine energy systems.

For customers with limited capital or short-term needs, Capstone offers rental systems; for more information, contact: rentals@CGRNenergy.com. To date, Capstone has shipped over 10,000 units to 83 countries and estimates that, in FY21, it saved customers over $217 million in annual energy costs and approximately 397,000 tons of carbon. Total savings over the last three years are estimated at 1,115,100 tons of carbon and $698 million in annual energy savings.

For more information about the Company, please visit: www.CapstoneGreenEnergy.com. Follow Capstone Green Energy on TwitterLinkedInInstagramFacebook, and YouTube.

Cautionary Note Regarding
Forward-Looking Statements

This release contains forward-looking statements as defined in the Private Securities Litigation Reform Act of 1995, including statements regarding expectations for green initiatives and execution on the Company’s growth strategy and other statements regarding the Company’s expectations, beliefs, plans, intentions, and strategies. The Company has tried to identify these forward-looking statements by using words such as “expect,” “anticipate,” “believe,” “could,” “should,” “estimate,” “intend,” “may,” “will,” “plan,” “goal” and similar terms and phrases, but such words, terms and phrases are not the exclusive means of identifying such statements. Actual results, performance and achievements could differ materially from those expressed in, or implied by, these forward-looking statements due to a variety of risks, uncertainties and other factors, including, but not limited to, the following: the ongoing effects of the COVID-19 pandemic; the availability of credit and compliance with the agreements governing the Company’s indebtedness; the Company’s ability to develop new products and enhance existing products; product quality issues, including the adequacy of reserves therefor and warranty cost exposure; intense competition; financial performance of the oil and natural gas industry and other general business, industry and economic conditions; the Company’s ability to adequately protect its intellectual property rights; and the impact of pending or threatened litigation. For a detailed discussion of factors that could affect the Company’s future operating results, please see the Company’s filings with the Securities and Exchange Commission, including the disclosures under “Risk Factors” in those filings. Except as expressly required by the federal securities laws, the Company undertakes no obligation to update or revise any forward-looking statements, whether as a result of new information, changed circumstances or future events or for any other reason.

CONTACT:
Capstone Green Energy
Investor and investment media inquiries:
818-407-3628

ir@CGRNenergy.com

Release – Capstone Green Energy Signs 10-Year Service Contract On Energy Efficiency System At A Large Spirit Distillery In Jamaica


Capstone Green Energy Signs 10-Year Service Contract On Energy Efficiency System At A Large Spirit Distillery In Jamaica


VAN NUYS, CA / ACCESSWIRE / July 8, 2021 / Capstone Green Energy Corporation (www.CapstoneGreenEnergy.com) (NASDAQ:CGRN), formerly Capstone Turbine Corporation (www.capstoneturbine.com) (NASDAQ:CPST) (“Capstone” or the “Company”), announced today that Innovative Energy Company Limited, Capstone’s exclusive distributor for Jamaica and distributor for the oil and gas markets in Guyana, signed a new 10-year Capstone Factory Protection Plan (FPP) service contract for a Capstone Signature Series C200S system installed in Jamaica.

The Capstone Signature Series C200S system is owned and operated by one of the island’s largest and oldest spirit distilleries. The C200S, commissioned in late 2020, is used for 24×7 electrical and thermal energy generation and is configured for dual-mode operation allowing the distillery to provide backup power to critical loads in the event of a grid outage.

The project design efficiency is 85% and produces 100% of the distillery’s annual electrical energy, reducing the distillery’s total energy costs by 26%. Capstone’s Integrated Heat Recovery Module (iHRM) is mounted on the roof of the C200S and produces 1,000 MBtu/hr of hot water or 100% of the boiler feed water requirements, utilizing the microturbine’s exhaust heat. The system is configured as a low-pressure natural gas unit with onboard fuel compressors to provide the required fuel pressure to the engine. The project is also estimated to reduce the site’s greenhouse gas emissions by 14%.

The Capstone FPP will provide the end-use customer with fixed scheduled and unscheduled parts costs for the next 10 years, providing protection from future cost increases associated with the replacement of spare parts, commodity pricing, and import tariffs. “With the Capstone gold standard, all-inclusive Factory Protection Plan, our client is able to enjoy a 10-year, worry-free operational period, knowing that all maintenance costs for the project are covered,” said Nigel Davy, Managing Director of Innovative Energy Company Limited.

“We are pleased that Capstone Green Energy is playing a larger role in Jamaica’s commitment to integrate clean energy sources and increase energy resiliency as part of the Energy Cooperation Framework signed by the U.S. and Jamaica in 2018,” said Tracy Chidbachian, Capstone’s Director of Customer Service. “Capstone Green Energy, along with Innovative Energy Company, is leading the way in advancing Jamaica’s environmental goals by integrating clean energy sources, including natural gas and renewable energy,” concluded Ms. Chidbachian.

“With the change in climate and increase of tropical storms in the Caribbean, power outages are more than an inconvenience; they are a significant hazard. Power outages are detrimental to people’s well-being and safety and have a devastating impact on the region,” said Darren Jamison, President and Chief Executive Officer of Capstone Green Energy. “This new contract demonstrates that Innovative Energy Company is taking steps to keep up with the energy revolution and protect its end-use customers from prolonged unplanned power outages caused by severe weather,” concluded Mr. Jamison.

About Capstone Green Energy
Capstone Green Energy (www.CapstoneGreenEnergy.com) (NASDAQ:CGRN) is a leading provider of customized microgrid solutions and on-site energy technology systems focused on helping customers around the globe meet their environmental, energy savings, and resiliency goals. Capstone Green Energy focuses on four key business lines. Through its Energy as a Service (EaaS) business, it offers rental solutions utilizing its microturbine energy systems and battery storage systems, comprehensive Factory Protection Plan (FPP) service contracts that guarantee life-cycle costs, as well as aftermarket parts. Energy Conversion Products are driven by the Company’s industry-leading, highly efficient, low-emission, resilient microturbine energy systems offering scalable solutions in addition to a broad range of customer-tailored solutions, including hybrid energy systems and larger frame industrial turbines. The Energy Storage Products business line designs and installs microgrid storage systems creating customized solutions using a combination of battery technologies and monitoring software. Through Hydrogen Energy Solutions, Capstone Green Energy offers customers a variety of hydrogen products, including the Company’s microturbine energy systems.

For customers with limited capital or short-term needs, Capstone offers rental systems; for more information, contact: rentals@CGRNenergy.com. To date, Capstone has shipped over 10,000 units to 83 countries and estimates that, in FY21, it saved customers over $217 million in annual energy costs and approximately 397,000 tons of carbon. Total savings over the last three years are estimated at 1,115,100 tons of carbon and $698 million in annual energy savings.

For more information about the Company, please visit: www.CapstoneGreenEnergy.com. Follow Capstone Green Energy on TwitterLinkedInInstagramFacebook, and YouTube.

Cautionary Note Regarding Forward-Looking Statements
This release contains forward-looking statements as defined in the Private Securities Litigation Reform Act of 1995, including statements regarding expectations for green initiatives and execution on the Company’s growth strategy and other statements regarding the Company’s expectations, beliefs, plans, intentions, and strategies. The Company has tried to identify these forward-looking statements by using words such as “expect,” “anticipate,” “believe,” “could,” “should,” “estimate,” “intend,” “may,” “will,” “plan,” “goal” and similar terms and phrases, but such words, terms and phrases are not the exclusive means of identifying such statements. Actual results, performance and achievements could differ materially from those expressed in, or implied by, these forward-looking statements due to a variety of risks, uncertainties and other factors, including, but not limited to, the following: the ongoing effects of the COVID-19 pandemic; the availability of credit and compliance with the agreements governing the Company’s indebtedness; the Company’s ability to develop new products and enhance existing products; product quality issues, including the adequacy of reserves therefor and warranty cost exposure; intense competition; financial performance of the oil and natural gas industry and other general business, industry and economic conditions; the Company’s ability to adequately protect its intellectual property rights; and the impact of pending or threatened litigation. For a detailed discussion of factors that could affect the Company’s future operating results, please see the Company’s filings with the Securities and Exchange Commission, including the disclosures under “Risk Factors” in those filings. Except as expressly required by the federal securities laws, the Company undertakes no obligation to update or revise any forward-looking statements, whether as a result of new information, changed circumstances or future events or for any other reason.

CONTACT:
Capstone Green Energy
Investor and investment media inquiries:
818-407-3628
ir@CGRNenergy.com

SOURCE: Capstone Green Energy Corporation

OPEC Inspired Price Compressions Impact on Business


Image Credit: Alexander Schimmeck (Unsplash)


OPEC’s Rift Impacts U.S. Energy Markets, Including Alternative


Oil prices are almost 40% higher than they began the year. Should the 5% dip over the past week be cause for concern among energy investors? Perhaps the reasons for the dip, impact on competition, and the U.S. production level ought to attract the most focus.

The volatility comes after an aborted meeting of OPEC+, the outcome of which was expected to result in an agreement to increase output, undoing 2020 cuts implemented as the economic lockdowns caused a worldwide glut of crude oil. Instead, OPEC+, which includes the original OPEC cartel members and their oil-producing allies, failed to reach an agreement.


Background:

In 2020 OPEC+ made the decision to severely slow production by nearly 10 million barrels a day as demand vanished from the impact of lockdown orders in economies both large and small. In 2021, the price of oil had risen as much as 50% to its high point as the world began relaxing COVID-era restrictions. Oil-exporting nations are now looking to orchestrate the way forward out of the pandemic crisis and into a world where world energy needs are expected to turn sharply away from petroleum.


The Agreement that Didn’t Happen

The expected
agreement
that would have increased world oil production fell apart because of a conflict between Saudi Arabia and the U.A.E. The U.A.E. asked to have its production target increased, this would have expanded its percentage of combined OPEC output. Increasing one country’s overall share has a tendency to create conflict. The cartel has stayed united with minimum open conflict, and they only act with a unanimous vote.  The current outcome of “status quo” where the countries are expected to operate under the existing Covid era limited output will have the effect of keeping oil prices high but perhaps cut into potential revenue for the members involved.


U.S. Oil Prices vs. International

U.S. oil prices jumped and then declined yesterday (July 7) as traders deciphered and adjusted to the new OPEC outlook. Oil price volatility isn’t all that the markets experienced by the uncertain future. Oil spreads, the gap between international crude and U.S. production have narrowed.  Producers globally benefit from higher prices. Downstream related business such as refiners prefer fat spreads between U.S. and non-domestic per barrel prices. The narrowing can be seen as a drag on some U.S. energy stocks.

Benchmark U.S. crude oil prices were up about 1% Wednesday morning (July 7), then turned sharply down about 2.6% by 10:40 a.m. E.S.T. Benchmark global crude prices began up about 0.8% before turning lower, dropping about 2.1%. West Texas Intermediate oil futures, the U.S. benchmark, are at $71.48 a barrel. Brent crude oil futures, the international benchmark, are at $72.95 a barrel.

Supply-demand factors in the U.S. are a driver of the spread compression. U.S. inventory post-Covid is at a massive deficit compared to normal levels. As the U.S. economy is sprinting out of last year’s poor economy, the rest of the world is crawling forward from the problems. Narrower spreads tend to reduce U.S. exports and invite imports. This dampens the potential for U.S. producers.

OPEC controls about one-third of global oil production. A rift between two rival countries could impact what occurs with energy sources that compete with oil and even help speed or slow movement away from petroleum. Competition between Gulf allies is heating up in other areas as well as the countries are working to diversify their revenue to be less reliant on oil as the move to reduce dependence accelerates. Increasing Petrodollars ($ U.S. dollars exchanged for crude) are important.


Take-Away

The rift between Saudi Arabia and the U.A.E. may widen or narrow. The countries are going through a challenging time where revising their economies for diversified income appears critical. The U.A.E. is ahead of the Saudis on this; financing additional economic revitalization projects increases the thirst for maximizing oil sales profit.

What occurs halfway across the world impacts the spread between U.S. crude and all other sources. When the spread narrows, other sources become more attractive than they had been. This can impact not just domestic oil sales but related businesses down the line, and even competing energy sources.


Suggested Reading:


Oil Market Conditions May Change as We Enter the Second Half of 2021


How Does the Gates Buffett Natrium Reactor Work?


Space SPACs in the SPAC Space


Can You Invest in Uranium Directly?


Sources:

https://www.barrons.com/articles/three-stock-picks-to-play-the-wti-brent-spread-1528226297?mod=article_inline

https://www.barrons.com/articles/opec-meeting-oil-output-delay-51625170007?mod=article_inline

https://finance.yahoo.com/quote/CL%3DF/chart

https://www.aljazeera.com/economy/2021/7/7/saudi-uae-rivalry-takes-shape-amid-opec-spat-and-competing-hubs


Stay up to date. Follow us:


OPEC Inspired Price Compression’s Impact on Business


Image Credit: Alexander Schimmeck (Unsplash)


OPEC’s Rift Impacts U.S. Energy Markets, Including Alternative


Oil prices are almost 40% higher than they began the year. Should the 5% dip over the past week be cause for concern among energy investors? Perhaps the reasons for the dip, impact on competition, and the U.S. production level ought to attract the most focus.

The volatility comes after an aborted meeting of OPEC+, the outcome of which was expected to result in an agreement to increase output, undoing 2020 cuts implemented as the economic lockdowns caused a worldwide glut of crude oil. Instead, OPEC+, which includes the original OPEC cartel members and their oil-producing allies, failed to reach an agreement.


Background:

In 2020 OPEC+ made the decision to severely slow production by nearly 10 million barrels a day as demand vanished from the impact of lockdown orders in economies both large and small. In 2021, the price of oil had risen as much as 50% to its high point as the world began relaxing COVID-era restrictions. Oil-exporting nations are now looking to orchestrate the way forward out of the pandemic crisis and into a world where world energy needs are expected to turn sharply away from petroleum.


The Agreement that Didn’t Happen

The expected
agreement
that would have increased world oil production fell apart because of a conflict between Saudi Arabia and the U.A.E. The U.A.E. asked to have its production target increased, this would have expanded its percentage of combined OPEC output. Increasing one country’s overall share has a tendency to create conflict. The cartel has stayed united with minimum open conflict, and they only act with a unanimous vote.  The current outcome of “status quo” where the countries are expected to operate under the existing Covid era limited output will have the effect of keeping oil prices high but perhaps cut into potential revenue for the members involved.


U.S. Oil Prices vs. International

U.S. oil prices jumped and then declined yesterday (July 7) as traders deciphered and adjusted to the new OPEC outlook. Oil price volatility isn’t all that the markets experienced by the uncertain future. Oil spreads, the gap between international crude and U.S. production have narrowed.  Producers globally benefit from higher prices. Downstream related business such as refiners prefer fat spreads between U.S. and non-domestic per barrel prices. The narrowing can be seen as a drag on some U.S. energy stocks.

Benchmark U.S. crude oil prices were up about 1% Wednesday morning (July 7), then turned sharply down about 2.6% by 10:40 a.m. E.S.T. Benchmark global crude prices began up about 0.8% before turning lower, dropping about 2.1%. West Texas Intermediate oil futures, the U.S. benchmark, are at $71.48 a barrel. Brent crude oil futures, the international benchmark, are at $72.95 a barrel.

Supply-demand factors in the U.S. are a driver of the spread compression. U.S. inventory post-Covid is at a massive deficit compared to normal levels. As the U.S. economy is sprinting out of last year’s poor economy, the rest of the world is crawling forward from the problems. Narrower spreads tend to reduce U.S. exports and invite imports. This dampens the potential for U.S. producers.

OPEC controls about one-third of global oil production. A rift between two rival countries could impact what occurs with energy sources that compete with oil and even help speed or slow movement away from petroleum. Competition between Gulf allies is heating up in other areas as well as the countries are working to diversify their revenue to be less reliant on oil as the move to reduce dependence accelerates. Increasing Petrodollars ($ U.S. dollars exchanged for crude) are important.


Take-Away

The rift between Saudi Arabia and the U.A.E. may widen or narrow. The countries are going through a challenging time where revising their economies for diversified income appears critical. The U.A.E. is ahead of the Saudis on this; financing additional economic revitalization projects increases the thirst for maximizing oil sales profit.

What occurs halfway across the world impacts the spread between U.S. crude and all other sources. When the spread narrows, other sources become more attractive than they had been. This can impact not just domestic oil sales but related businesses down the line, and even competing energy sources.


Suggested Reading:


Oil Market Conditions May Change as We Enter the Second Half of 2021


How Does the Gates Buffett Natrium Reactor Work?


Space SPACs in the SPAC Space


Can You Invest in Uranium Directly?


Sources:

https://www.barrons.com/articles/three-stock-picks-to-play-the-wti-brent-spread-1528226297?mod=article_inline

https://www.barrons.com/articles/opec-meeting-oil-output-delay-51625170007?mod=article_inline

https://finance.yahoo.com/quote/CL%3DF/chart

https://www.aljazeera.com/economy/2021/7/7/saudi-uae-rivalry-takes-shape-amid-opec-spat-and-competing-hubs


Stay up to date. Follow us:


Capstone Green Energy Signs 10-Year Service Contract On Energy Efficiency System At A Large Spirit Distillery In Jamaica


Capstone Green Energy Signs 10-Year Service Contract On Energy Efficiency System At A Large Spirit Distillery In Jamaica


VAN NUYS, CA / ACCESSWIRE / July 8, 2021 / Capstone Green Energy Corporation (www.CapstoneGreenEnergy.com) (NASDAQ:CGRN), formerly Capstone Turbine Corporation (www.capstoneturbine.com) (NASDAQ:CPST) (“Capstone” or the “Company”), announced today that Innovative Energy Company Limited, Capstone’s exclusive distributor for Jamaica and distributor for the oil and gas markets in Guyana, signed a new 10-year Capstone Factory Protection Plan (FPP) service contract for a Capstone Signature Series C200S system installed in Jamaica.

The Capstone Signature Series C200S system is owned and operated by one of the island’s largest and oldest spirit distilleries. The C200S, commissioned in late 2020, is used for 24×7 electrical and thermal energy generation and is configured for dual-mode operation allowing the distillery to provide backup power to critical loads in the event of a grid outage.

The project design efficiency is 85% and produces 100% of the distillery’s annual electrical energy, reducing the distillery’s total energy costs by 26%. Capstone’s Integrated Heat Recovery Module (iHRM) is mounted on the roof of the C200S and produces 1,000 MBtu/hr of hot water or 100% of the boiler feed water requirements, utilizing the microturbine’s exhaust heat. The system is configured as a low-pressure natural gas unit with onboard fuel compressors to provide the required fuel pressure to the engine. The project is also estimated to reduce the site’s greenhouse gas emissions by 14%.

The Capstone FPP will provide the end-use customer with fixed scheduled and unscheduled parts costs for the next 10 years, providing protection from future cost increases associated with the replacement of spare parts, commodity pricing, and import tariffs. “With the Capstone gold standard, all-inclusive Factory Protection Plan, our client is able to enjoy a 10-year, worry-free operational period, knowing that all maintenance costs for the project are covered,” said Nigel Davy, Managing Director of Innovative Energy Company Limited.

“We are pleased that Capstone Green Energy is playing a larger role in Jamaica’s commitment to integrate clean energy sources and increase energy resiliency as part of the Energy Cooperation Framework signed by the U.S. and Jamaica in 2018,” said Tracy Chidbachian, Capstone’s Director of Customer Service. “Capstone Green Energy, along with Innovative Energy Company, is leading the way in advancing Jamaica’s environmental goals by integrating clean energy sources, including natural gas and renewable energy,” concluded Ms. Chidbachian.

“With the change in climate and increase of tropical storms in the Caribbean, power outages are more than an inconvenience; they are a significant hazard. Power outages are detrimental to people’s well-being and safety and have a devastating impact on the region,” said Darren Jamison, President and Chief Executive Officer of Capstone Green Energy. “This new contract demonstrates that Innovative Energy Company is taking steps to keep up with the energy revolution and protect its end-use customers from prolonged unplanned power outages caused by severe weather,” concluded Mr. Jamison.

About Capstone Green Energy
Capstone Green Energy (www.CapstoneGreenEnergy.com) (NASDAQ:CGRN) is a leading provider of customized microgrid solutions and on-site energy technology systems focused on helping customers around the globe meet their environmental, energy savings, and resiliency goals. Capstone Green Energy focuses on four key business lines. Through its Energy as a Service (EaaS) business, it offers rental solutions utilizing its microturbine energy systems and battery storage systems, comprehensive Factory Protection Plan (FPP) service contracts that guarantee life-cycle costs, as well as aftermarket parts. Energy Conversion Products are driven by the Company’s industry-leading, highly efficient, low-emission, resilient microturbine energy systems offering scalable solutions in addition to a broad range of customer-tailored solutions, including hybrid energy systems and larger frame industrial turbines. The Energy Storage Products business line designs and installs microgrid storage systems creating customized solutions using a combination of battery technologies and monitoring software. Through Hydrogen Energy Solutions, Capstone Green Energy offers customers a variety of hydrogen products, including the Company’s microturbine energy systems.

For customers with limited capital or short-term needs, Capstone offers rental systems; for more information, contact: rentals@CGRNenergy.com. To date, Capstone has shipped over 10,000 units to 83 countries and estimates that, in FY21, it saved customers over $217 million in annual energy costs and approximately 397,000 tons of carbon. Total savings over the last three years are estimated at 1,115,100 tons of carbon and $698 million in annual energy savings.

For more information about the Company, please visit: www.CapstoneGreenEnergy.com. Follow Capstone Green Energy on TwitterLinkedInInstagramFacebook, and YouTube.

Cautionary Note Regarding Forward-Looking Statements
This release contains forward-looking statements as defined in the Private Securities Litigation Reform Act of 1995, including statements regarding expectations for green initiatives and execution on the Company’s growth strategy and other statements regarding the Company’s expectations, beliefs, plans, intentions, and strategies. The Company has tried to identify these forward-looking statements by using words such as “expect,” “anticipate,” “believe,” “could,” “should,” “estimate,” “intend,” “may,” “will,” “plan,” “goal” and similar terms and phrases, but such words, terms and phrases are not the exclusive means of identifying such statements. Actual results, performance and achievements could differ materially from those expressed in, or implied by, these forward-looking statements due to a variety of risks, uncertainties and other factors, including, but not limited to, the following: the ongoing effects of the COVID-19 pandemic; the availability of credit and compliance with the agreements governing the Company’s indebtedness; the Company’s ability to develop new products and enhance existing products; product quality issues, including the adequacy of reserves therefor and warranty cost exposure; intense competition; financial performance of the oil and natural gas industry and other general business, industry and economic conditions; the Company’s ability to adequately protect its intellectual property rights; and the impact of pending or threatened litigation. For a detailed discussion of factors that could affect the Company’s future operating results, please see the Company’s filings with the Securities and Exchange Commission, including the disclosures under “Risk Factors” in those filings. Except as expressly required by the federal securities laws, the Company undertakes no obligation to update or revise any forward-looking statements, whether as a result of new information, changed circumstances or future events or for any other reason.

CONTACT:
Capstone Green Energy
Investor and investment media inquiries:
818-407-3628
ir@CGRNenergy.com

SOURCE: Capstone Green Energy Corporation

InPlay Oil (IPOOF)(IPO:CA) – Production rates blowing through expectations

Wednesday, July 07, 2021

InPlay Oil (IPOOF)(IPO:CA)
Production rates blowing through expectations

As of April 24, 2020, Noble Capital Markets research on InPlay Oil is published under ticker symbols (IPOOF and IPO:CA). The price target is in USD and based on ticker symbol IPOOF. Research reports dated prior to April 24, 2020 may not follow these guidelines and could account for a variance in the price target. InPlay Oil is a junior oil and gas exploration and production company with operations in Alberta focused on light oil production. The company operates long-lived, low-decline properties with drilling development and enhanced oil recovery potential as well as undeveloped lands with exploration possibilities. The common shares of InPlay trade on the Toronto Stock Exchange under the symbol IPO and the OTCQZ Exchange under the symbol IPOOF.

Michael Heim, Senior Research Analyst, Noble Capital Markets, Inc.

Refer to the full report for the price target, fundamental analysis, and rating.

    Management indicates 2021-2Q production could be 5,325 BOE/d. Such a level represents a 7% increase over 2021-1Q production and a 70% increase over 2020-2Q production. Our models assume production of 5,167 BOE/d. Management reiterated annual guidance of 5,100-5,400 BOE/d but indicated it currently expects to be at the upper end of the range and that it would reevaluate guidance when it reports 2021-2Q results on August 11th. Our models assume 5,360 BOE/d and are subject to upward revision if management raises guidance as we expect.

    The jump in production combined with higher prices is about to make cash flow explode.  Management anticipates record Adjusted Funds Flow (AFF) in 2021. InPlay reported $27 million in AFF in 2018. Surpassing that amount would blow through the $21.3 million estimate currently being indicated in our models. Management plans to use cash flow to pay down debt to a level of 1.0 times EBITDA which could …


This Company Sponsored Research is provided by Noble Capital Markets, Inc., a FINRA and S.E.C. registered broker-dealer (B/D).

*Analyst certification and important disclosures included in the full report. NOTE: investment decisions should not be based upon the content of this research summary.  Proper due diligence is required before making any investment decision. 

Release – Energy Fuels and Neo Performance Materials Announce Contract Signing and Launch of Commercial Shipments of Rare Earth Product to Europe in Emerging U.S.-Based Rare Earth Supply Chain


Energy Fuels and Neo Performance Materials Announce Contract Signing and Launch of Commercial Shipments of Rare Earth Product to Europe in Emerging U.S.-Based Rare Earth Supply Chain

TORONTO, ON and LAKEWOOD, Colo., July 7, 2021 /CNW/ – Energy
Fuels Inc. (NYSE American: UUUU)
(TSX: EFR) (“Energy Fuels”) and Neo Performance Materials Inc. (TSX: NEO) (“Neo”) are pleased to announce that the first container (approximately 20 tonnes of product) of an expected 15 containers  of mixed rare earth carbonate (“RE Carbonate”) has been successfully produced by Energy Fuels at its White Mesa Mill in Utah (the “Mill”) and is en route to Neo’s rare earth separations facility in Estonia, creating a new United States-to-Europe rare earth supply chain.  Additional shipments of RE Carbonate are expected as Energy Fuels continues to process natural monazite sand ore (“Monazite”) mined in Georgia (U.S.) by Chemours (NYSE: CC) for both the rare earth elements and naturally occurring uranium that it contains.

This new supply chain will initially produce rare earth products from monazite that is processed into RE Carbonate at Energy Fuels’ Mill in Utah.  The RE Carbonate is then processed by Neo at its Silmet rare earth processing facility in Sillamäe, Estonia (“Silmet”) into separated rare earth oxides and other value-added rare earth compounds.  Neo is the only commercial producer of separated rare earth oxides in Europe.

Monazite, which is produced as a byproduct of existing heavy mineral sands mining, also contains naturally occurring uranium that Energy Fuels recovers for use in the generation of carbon-free nuclear energy.

This commercial-scale production of RE Carbonate by Energy Fuels from a U.S. mined rare earth resource positions Energy Fuels as the only company in North America that currently produces a Monazite-derived, enhanced rare earth material.  The physical delivery of this product also represents the launch of a new, environmentally responsible rare earth supply chain that allows for source validation and tracking from mining through to final end-use applications for manufacturers in North America, Europe, Japan, and other nations.

Energy Fuels and Neo are further pleased to announce the signing of a definitive supply agreement (the “Agreement”) by the companies’ respective affiliates. Under the Agreement, Colorado-based Energy Fuels will ship all or a portion of its RE Carbonate to Neo’s Silmet rare earth separations facility. Neo will then process Energy Fuels’ RE Carbonate into separated rare earth materials for use in rare earth permanent magnets and other rare earth-based advanced materials. Because of increasing demand for value-added rare earth materials in European manufacturing, Toronto-based Neo seeks to expand and diversify its current supplies of rare earth feedstock at Silmet, which is the only operational rare earth separations facility in Europe. Silmet has been separating rare earths into commercial value-added products for more than 50 years.

Representatives from both Energy Fuels and Neo were on hand at the White Mesa Mill to celebrate the launch of this new critical supply chain.

In addition to supplying RE Carbonate to Neo, Energy Fuels is also evaluating the potential to develop its own separation capabilities at its White Mesa Mill in Utah (U.S.), or nearby, and possibly adding metals, alloys, and rare earth permanent magnets manufacturing capabilities. As a first step, the Company has hired the French firm, Carester SAS, a leading global expert in rare earth separation and supply chains, to produce a scoping study including capital and operating costs for a full rare earth separations capability at the White Mesa Mill, which would be the next important step towards fully integrating a U.S. rare earth supply chain in the coming years, in addition to continuing to supply RE Carbonate to European markets over the long-term.

“The launch of this new supply chain is a real gamechanger for Neo and our growing customer base in Europe,” said Constantine Karayannopoulos, Neo’s Chief Executive Officer.  “This innovative U.S.-to-Europe supply chain will supplement Neo’s existing rare earth supply from our long-time Russian supplier.  It will enable Neo to expand value-added rare earth production in Estonia to meet growing demand in Europe for these materials.  It begins to unlock the extraordinary economic and environmental potential presented by utilizing low-cost rare earth feedstock from monazite ore that is a byproduct of existing mining.  And, it helps Neo ramp up rare earth production in Estonia just as Europe accelerates vehicle electrification and other initiatives aimed at mitigating climate impacts.”

“Today, Energy Fuels and Neo took significant steps toward restoring critical U.S. and European rare earth supply chains,” stated Mark S. Chalmers, President and CEO of Energy Fuels. “Energy Fuels has methodically ramped up our mixed rare earth carbonate production since we first started feeding Georgia monazite ore into our Utah mill in March. Successfully producing this rare earth product, and physically delivering the first containers of Rare Earth Carbonate to Neo, is an important achievement, not only for Energy Fuels and Neo, but also for U.S. government efforts to restore critical rare earth supply chains. This is also very good news for end-users of rare earth products in the U.S., Europe, Japan and elsewhere who seek alternative sources of rare earths produced in the U.S. and Europe to the highest global standards of environmental protection and sustainability.”

Significant quantities of Monazite are produced around the world as a byproduct of zircon and titanium production from heavy mineral sand operations, including large resources in the U.S., Australia, Brazil, South Africa, and other nations. Energy Fuels is in discussions with several parties to secure additional quantities of Monazite that it can use to expand this quickly emerging rare earth initiative. Energy Fuels has a goal of processing 15,000 tons of Monazite or more per year in the future. For perspective, 15,000 tons of Monazite per annum would contain rare earths equal to roughly 50% of total current U.S. demand, while only utilizing approximately 2% of the White Mesa Mill’s existing throughput capacity and less than 1% of its existing tailings capacity. 

Monazite from the southeast U.S. typically contains roughly 55% total rare earth oxides (“TREO”) of which the magnetic elements neodymium and praseodymium (“NdPr”) comprise approximately 22% of the TREO. NdPr are among the most valuable of the rare earth elements, as they are the key ingredient in the manufacture of high-strength permanent magnets that are essential to the lightweight and powerful motors required in electric vehicles, permanent magnet wind turbines used for renewable energy generation, and a variety of other modern technologies, including, mobile devices and defense applications. U.S. Monazite also contains approximately 14.4% “heavy” rare earths on a TREO basis, including roughly 1.5% dysprosium and terbium which have additional important magnet and national defense applications.

ABOUT NEO PERFORMANCE MATERIALS

Neo manufactures the building blocks of many modern technologies that enhance efficiency and sustainability. Neo’s advanced industrial materials — magnetic powders and magnets, specialty chemicals, metals, and alloys — are critical to the performance of many everyday products and emerging technologies. Neo’s products help to deliver the technologies of tomorrow to consumers today. The business of Neo is organized along three segments: Magnequench, Chemicals & Oxides and Rare Metals. Neo is headquartered in Toronto, Ontario, Canada; with corporate offices in Greenwood Village, Colorado, US; Singapore; and Beijing, China. Neo operates globally with sales and production across 10 countries, being Japan, China, Thailand, Estonia, Singapore, Germany, United Kingdom, Canada, United States, and South Korea. For more information, please visit www.neomaterials.com.

ABOUT ENERGY FUELS

Energy Fuels is a leading U.S.-based uranium mining company, supplying U3O8 to major nuclear utilities. Energy Fuels also produces vanadium from certain of its projects, as market conditions warrant, and is ramping up to commercial production of REE carbonate in 2021. Its corporate offices are in Lakewood, Colorado, near Denver, and all of its assets and employees are in the United States. Energy Fuels holds three of America’s key uranium production centers: the White Mesa Mill in Utah, the Nichols Ranch in-situ recovery (“ISR”) Project in Wyoming, and the Alta Mesa ISR Project in Texas. The White Mesa Mill is the only conventional uranium mill operating in the U.S. today, has a licensed capacity of over 8 million pounds of U3O8 per year, has the ability to produce vanadium when market conditions warrant, as well as REE carbonate from various uranium-bearing ores. The Nichols Ranch ISR Project is on standby and has a licensed capacity of 2 million pounds of U3O8 per year. The Alta Mesa ISR Project is also on standby and has a licensed capacity of 1.5 million pounds of U3O8per year. In addition to the above production facilities, Energy Fuels also has one of the largest NI 43-101 compliant uranium resource portfolios in the U.S. and several uranium and uranium/vanadium mining projects on standby and in various stages of permitting and development. The primary trading market for Energy Fuels’ common shares is the NYSE American under the trading symbol “UUUU,” and the Company’s common shares are also listed on the Toronto Stock Exchange under the trading symbol “EFR.” Energy Fuels’ website is www.energyfuels.com.

CAUTIONARY STATEMENTS REGARDING FORWARD LOOKING STATEMENTS

This news release contains “forward-looking information” within the meaning of applicable securities laws in Canada and the United States. Forward-looking information may relate to future events or future performance of Neo or Energy Fuels. All statements in this release, other than statements of historical facts, with respect to Neo’s or Energy Fuels’ objectives and goals, as well as statements with respect to their beliefs, plans, objectives, expectations, anticipations, estimates, and intentions, are forward-looking information. Specific forward-looking statements in this discussion include, but are not limited to, the following: any expectation that the White Mesa Mill will continue to be successful in producing RE Carbonate on a commercial basis; any expectation that Silmet will be successful in separating the White Mesa Mill’s RE Carbonate on a commercial basis; any expectations with regard to the cost of producing and separating RE Carbonate; any expectation that Energy Fuels will be successful in increasing its supplies of monazite sand ore supplies, developing U.S. separation, metals or metal/alloy capabilities at the White Mesa Mill or nearby, or otherwise fully integrating the U.S RE supply chain in the future; any expectation with regard to the future demand for rare earth materials, including any expectation that Europe will continue to accelerate vehicle electrification and other initiatives aimed at mitigating climate impacts; any expectation with regard to the economic and environmental potential presented by utilizing rare earth feedstock from monazite ore; any expectation with respect to the quantities of monazite ore to be acquired by Energy Fuels, the quantities of RE Carbonate to be produced by the White Mesa Mill or the quantities of contained TREO to be acquired by Silmet for separation; and any expectation that the rare earths produced by Energy Fuels and Neo will continue to be produced to the highest global standards of environmental protection and sustainability. Often, but not always, forward-looking information can be identified by the use of words such as “plans”, “expects”, “is expected”, “budget”, “scheduled”, “estimates”, “continues”, “forecasts”, “projects”, “predicts”, “intends”, “anticipates” or “believes”, or variations of, or the negatives of, such words and phrases, or state that certain actions, events or results “may”, “could”, “would”, “should”, “might” or “will” be taken, occur or be achieved. This information involves known and unknown risks, uncertainties and other factors that may cause actual results or events to differ materially from those anticipated in such forward-looking information. Factors that could cause actual results to differ materially from those anticipated in these forward-looking statements include risks associated with: processing difficulties and upsets; available supplies of monazite sands; the ability of the White Mesa Mill to produce RE Carbonate to meet commercial specifications on a commercial scale at acceptable costs; the ability of Silmet to separate the RE Carbonate to meet commercial specifications on a commercial scale at acceptable costs; the capital and operating costs associated with separation, metal, alloy and/or magnet production facilities; permitting and regulatory delays; litigation risks; competition from others; market factors, including future demand for and prices realized from the sale of rare earth elements; and the policies and actions of foreign governments, which could impact the competitive supply of and global markets for rare earth elements. Forward-looking statements contained herein are made as of the date of this news release, and Neo and Energy Fuels disclaim, other than as required by law, any obligation to update any forward-looking statements whether as a result of new information, results, future events, circumstances, or if management’s estimates or opinions should change, or otherwise. There can be no assurance that forward-looking statements will prove to be accurate, as actual results and future events could differ materially from those anticipated in such statements. Accordingly, the reader is cautioned not to place undue reliance on forward-looking statements. Neo and Energy Fuels assume no obligation to update the information in this communication, except as otherwise required by law.


SOURCE Energy Fuels Inc.

For further information: ENERGY FUELS, Curtis Moore – VP of Marketing & Corporate Development, (303) 974-2154; cmoore@energyfuels.com; NEO PERFORMANCE MATERIALS, Ali Mahdavi, SVP, Corporate Development & Capital Markets, 416-962-3300, Email: a.mahdavi@neomaterials.com; Jim Sims, Director, Corporate Communications, 303-503-6203, Email: j.sims@neomaterials.com, Website: www.neomaterials.com

Alternative Vehicle Fuel Types


Image Credit: C.C. Chapman (Flickr)


Six Alternative Fuel Types Vying to Power our Future


Not many years ago, there were two types of vehicles on the road, gasoline-powered and diesel. Now there is a wider variety with six main alternative fuels. Each of these is intended to put us on the path to reduced or carbon-neutral vehicles. Some have distinct advantages over others from a functional standpoint; all represent investment opportunities, as a few of these are likely to grow to be the primary energy source in tomorrow’s cars and trucks.

Investors interested in the alternative fuels area should make sure they know the basics of each. The following are the basics of all six.


Ethanol

Ethanol is a renewable fuel made from corn and other plant materials. Its use is widespread on the roads today. In fact, more than 98% of gasoline in the U.S. contains some ethanol. The most common blend of ethanol is E10 which is 10% ethanol and 90% gasoline.

Ethanol is also available as E85 (or flex fuel) which is an ethanol blend containing 51% to 83% ethanol, depending on geography and season, used in flexible fuel vehicles. E15is a blend increasing its market presence. It is approved for use in model year 2001 and newer light-duty conventional gas vehicles.

Ethanol is a renewable fuel made from various plant materials collectively known as “biomass.” More than 98% of U.S. gasoline contains ethanol, typically E10 (10% ethanol, 90% gasoline), to oxygenate the fuel, which reduces air pollution.

Ethanol (CH3CH2OH) is clear and colorless. It’salso known as grain alcohol, ethyl alcohol, and EtOH. The fuel has the same chemical make-up regardless of whether it’s produced from starch- or sugar-based feedstocks like corn.

Ethanol has a higher octane than gasoline, so it can be used to raise the octane of low octane gasoline to prevent rough engine operation such as knocking. However, the fuel actually contains less energy per gallon than gas. Denatured ethanol (98% ethanol) contains about 30% less energy than gasoline per gallon. The experience of any cars fuel economy on ethanol depends on whether an engine is optimized to run on gasoline or partial ethanol.

Flexible Fuel Vehicles

Flexible fuel vehicles (FFVs) have an internal combustion engine and can operate on gasoline and/or any blend of gasoline and ethanol up to 83%, such as E85 flex-fuel. E85 is a gasoline-ethanol blend containing 51% to 83% ethanol, depending on geography and season.

According to IHS Markit, as of 2017, there were more than 21 million FFVs in the United States. Because FFVs are factory-made and are capable of operating on gasoline and gasoline-ethanol blends, many vehicle owners don’t realize their car is an FFV and that they have a choice of fuels to use.

You can visit Fueleconomy.gov to learn how to identify an FFV or use the Alternative Fuel and Advanced Vehicle Search to find current FFV models.

Emissions

The carbon dioxide released by a vehicle when ethanol is burned is offset by the carbon dioxide captured when the feedstock crops are grown to produce ethanol. This differs from gasoline and diesel, which are refined from petroleum extracted from the earth. No emissions are offset when these petroleum products are burned.

On a life cycle analysis basis, greenhouse gas (GHG) emissions are reduced on average by 34% with corn-based ethanol produced from dry mills, and range between 88% and 108% if cellulosic feedstocks are used depending on feedstock type, compared with gasoline and diesel production and use.


Electricity

Electric vehicles, which for our purposes includes hybrid (gas and electric), have operating costs that are lower than conventional gas-powered cars. A little more than a decade ago, there was practically no mass market in the U.S.  But the consumer perception and evolution of technology, including battery efficiency, has been putting more hybrids and E.V.s on the road, with more entrants coming each year from the major car companies and start-ups.

Availability and Charging Speeds

Both all-electric cars and a plug-in hybrid have several options for charging. Often, drivers will do the majority of their charging from home. Workplaces, businesses, and some condos and apartments now provide charging. As far as public charging, there are over 16 thousand public charging stations located across the country.

There are three basic types of charging:

Level 1 charging is accomplished by plugging the car or truck into a regular 120 Volt home style outlet. This is the slowest type of charging, and the current pace is about 2 to 5 miles of range per hour of charging. It’s often the most convenient and requires no special charger or adapter. Most, if not all, plug-in vehicles come equipped with a cord to allow level 1 charging.

Level 2 charging is where a supply station offers current at 240 V (or 208 V), which provides 10 to 30 miles of range per hour of charging. Most public chargers are Level 2 chargers. Drivers can also have a Level 2 charger installed at their home. Most public chargers use a standard plug type that is compatible with all vehicles. Tesla charging stations, however, use a different plug type that cannot be used by other manufacturers’ vehicles. Tesla provides an adaptor that allows its vehicles to use both Tesla and standard Level 2 charging stations.

Fast charging is also referred to as D.C. fast charging or D.C. quick charging. This is the fastest method. It allows 50 or more miles of range to the battery in 20 minutes. Not all vehicles can accept fast charging, nor do all vehicles use the same type of plug for D.C. fast charging. This is a consideration for those deciding if an E.V. makes sense for them. Quick charging stations are usually located along heavy traffic corridors. They are generally too expensive to be practical for home installation.

Market Demand

According to BlueWeave Consulting, the global market for electric vehicle market should grow from USD 121.8 billion in 2020 to USD 236.3 billion by 2027, with a CAGR of 10.6% during the forecast period (2021–2027).


Hydrogen


Hydrogen can power a vehicle in two ways: fuel cells, and internal combustion. Fuel cell vehicles (FCVs) turn hydrogen and oxygen from the air into electricity, powering an electric motor. The most abundant element on Earth (H) can also be burned in internal combustion engines (ICEs); the by product (exhaust) is H2O (water).

Emissions

In a virtual sense, Hydrogen doesn’t produce any greenhouse gas emissions. You essentially generate power through a hydrogen fuel cell that just emits warm air and water vapor. Internal combustion methods of propulsion, in the end, combine Hydrogen with oxygen producing harmless water.

Challenges

When it comes to hydrogen fuel, the major challenge is to initially extract the fuel from water or hydrocarbons. Hydrogen does not exist in a lone elemental form; separating it from others atoms requires energy input. In terms of storage, hydrogen creates more hurdles. If you want compact storage of hydrogen fuel, it will need low temperatures and high pressures. Hydrogen is available at fewer than 50 public stations, mostly in California. However, more fueling stations are planned for the future.

Fuel cell hydrogen vehicles cost more than conventional vehicles, but costs are decreasing. Still, only a few models are currently available for sale. Internal combustion hydrogen vehicles are typically conversions of gasoline engines.


Natural Gas

Fundamentals

In 2021, Natural Gas has become one of the most used fuels in the world. Unlike other types of fuel, Natural gas doesn’t contain hydrocarbons; it is one of the cleanest burning alternative fuels. It is used in the form of compressed natural gas (CNG) or liquefied natural gas (LNG) in cars, trucks, and buses.

There are Dedicated natural gas vehicles and bi-fuel. Dedicated are designed to run on natural gas only, while bi-fuel vehicles can also run on gasoline or diesel. Bi-fuel vehicles allow users to take advantage of the widespread availability of gasoline or diesel but use a cleaner, more economical alternative when natural gas is available. Since natural gas is stored in high-pressure fuel tanks, bi-fuel vehicles require two separate fueling systems, which take up passenger/cargo space.

Availability

Natural gas vehicles are not available on a large scale in the U.S.—only a few models are currently offered for sale. However, conventional gasoline and diesel vehicles can be retrofitted for CNG.

Chemical Process

Chemically, renewable natural gas is similar to other fossil fuels that make it highly usable. Creation of biomethane is through an anaerobic digestion process that involves waste from livestock and landfills. This process breaks down the microorganisms into biodegradable material.


BioDiesel

Fundamentals

BioDiesel fuel production is more common than many people realize. The production of the fuel requires animal fats, recycled grease, or vegetable oil. BioDiesel can be used in different diesel vehicles. This is because the chemical makeup is not substantially different from petroleum diesel.

Emissions

In comparison, BioDiesel burns more cleanly, eco-friendly, and safer than traditional petroleum diesel. On average, BioDiesel has more than 130 degrees Celsius of flashpoint, which is significantly higher than normal diesel. What’s more, is that B100 or pure BioDiesel decreases carbon dioxide emissions by up to 75% more than conventional diesel.


Propane

Propane, or liquefied petroleum gas (LPG), is a clean-burning fossil fuel that can be used in internal combustion engines.

Most of the propane used in the U.S. is produced domestically. It’s often less expensive than gasoline and does not degrade performance. LPG-fueled vehicles emit lower amounts of some air pollutants and greenhouse gases, depending on vehicle type, calibration, and drive cycle.

Challenges

The drawbacks to LPG are the limited number of fueling stations and vehicles. Over 900 public fueling stations sell LPG. A few light-duty vehicles – mostly larger trucks and vans – can be ordered from a dealer with a prep-ready engine package and converted to use propane. Consumers can also convert in-use conventional vehicles for LPG use. Some LPG vehicles run on propane only. Others can switch between propane and a conventional fuel such as gasoline.

Propane is stored as a liquid in pressurized fuel tanks rated to 300 psi. So, LPG conversions consist of installing a separate fuel system (if the vehicle will use both conventional fuel and LPG) or a replacement fuel system (LPG-only operation).

Converting a vehicle to use LPG can cost $6,000 to $12,000. However, this cost may be recovered in lower fuel and maintenance costs.

Propane fuel refers to liquefied petroleum gas that makes it one of the most viable alternative fuels. In fact, it is a high-energy and clean-burning fuel that offers many benefits to the automotive industry.

Emissions

On average, the greenhouse gasses reduction from propane fuel is around 10% relative to gasoline.

Cost-Benefit Ratio

On the flip side, propone vehicles are, in fact, quite expensive compared to gasoline vehicles.


Take-Away

These are fuels that will either be stopgaps on our way to cleaner burning fuels or may take a lead in powering our future. As we’re on this path, the increased demand for some or waning demand for others provides opportunity in all the surrounding aspects, of the fuels.


Suggested Reading:

Investment Opportunities in Hydrogen

The Future of Electric Vehicles


Ford’s Announcement is Another Reason for Copper Investors to Smile

Raw Materials and Scalability of Tesla’s Vision


Sources:

https://afdc.energy.gov/fuels/

https://www.nap.edu/read/1889/chapter/14#390

https://www.inspirecleanenergy.com/blog/clean-energy-101/types-of-alternative-energy

https://www.globenewswire.com/news-release/2021/02/10/2173513/0/en/Electric-Vehicles-market-Demand-to-Be-Twofold-in-the-Next-Five-Years-with-a-strong-CAGR-of-10-6-during-forecast-period-2021-2027.html


Stay up to date. Follow us:


Stay up to date. Follow us: