![]()
CanAlaska Options Key Extension Uranium Project
Vancouver, British Columbia–(Newsfile Corp. – September 15, 2021) – CanAlaska Uranium Ltd. (TSXV: CVV) (OTCQB: CVVUF) (FSE: DH7N) (“CanAlaska” or the “Company”) is pleased to announce it has entered into a Letter of Intent (“LOI”) with Durama Enterprises Limited (“Durama”), a private company, to allow CanAlaska to earn up to 100% interest in Durama’s 100%-owned 17,665 hectare Key Extension Project in the Athabasca Basin region, Saskatchewan, Canada (the “Project”) (Figure 1).
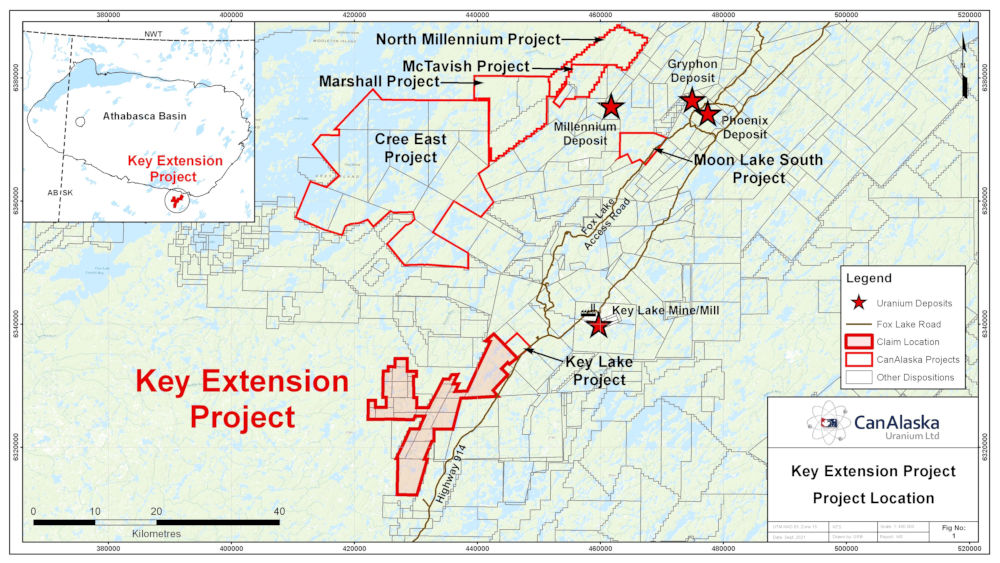
Figure 1: Key Extension Project – Project Location
The Company may earn up to a 100% interest in the Project by undertaking work and payments in a single stage over a four year period. In order to meet conditions of the four year earn-in, CanAlaska will make total cash payments of $50,000, issue 300,000 common shares in the Company subject to approval of the TSX Venture Exchange, and complete work totalling $850,000 as outlined in Table 1. In addition, a 1.5% Net Smelter Return (NSR) royalty will be granted to Durama to complete the earn-in. CanAlaska will retain the right to bring in third-party funding to complete the option requirements.
Table 1: Summary of Option Requirements
| Earned Interest (%) | Cash ($) | Shares (#) | Work Commitment ($) | Timeline (mo.) | |
| Year 1 | 0 | $5,000 | 0 | 0* | 12 |
| Year 2 | 0 | $10,000 | 50,000 | $0 | 12 |
| Year 3 | 0 | $15,000 | 100,000 | $0 | 12 |
| Year 4 | 100 | $20,000 | 150,000 | $850,000 | 12 |
| Total | 100 | $50,000 | 300,000 | $850,000 | 48 |
*Work must cover minimum assessment costs
The Key Extension Project lands cover the highly prospective Wollaston-Mudjatik transition zone (WMTZ) in the Southeastern Athabasca Basin (Figure 2). The Project lands have been explored with historical regional and project scale ground and airborne geophysical surveys, with additional focused prospecting programs targeting lake sediment and boulder anomalies. The regional geophysical surveys map linear magnetic low features with corresponding electromagnetic (EM) conductors on the eastern-most claim of the Project, typical of the Lower Wollaston Domain. On the Western claims, the conductors are generally shorter strike length discontinuous features, typical of the Mudjatik Domain. Focused airborne magnetics and VTEM (Versatile Time Domain Electromagnetic) surveys were completed by past operators of the Project in the early 2000’s, outlining a prominent 10 kilometre long northeast-trending conductor corridor that is coincident with a magnetic lineament that trends toward the historically producing Key Lake uranium deposits, Deilmann and Gaertner (Figure 2), and swings to the south along the Wollaston-Mudjatik boundary.
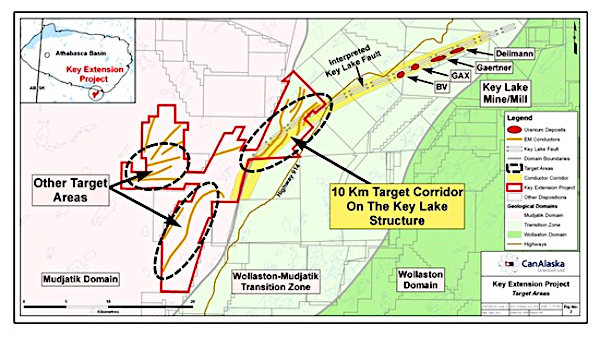
Figure 2: Key Extension Project – Target Areas
Despite the prolonged regional exploration and Key Lake deposit discoveries in the area, the Project lands have only undergone minimal drill testing in the late 1970’s consisting of shallow regional tests of conductors. Extensive drilling has been completed in and around the Key Lake deposits and associated showings, located approximately 10 km from the northeastern project boundary. The Key Lake deposits consist of a series of east-northeast striking pods of unconformity associated uranium mineralization, which have historically produced over 150 million lbs U3O8 from the Gaertner and Deilmann open pits. The deposit-controlling Key Lake structure and stratigraphy are interpreted to trend onto the Project lands based on the magnetic lineaments and conductor patterns in the geophysical data.
CanAlaska CEO, Cory Belyk, comments, “CanAlaska is very pleased to acquire this option on the Key Extension Project. An opportunity to acquire a vastly under-explored 10 km section of the Key Lake structure and stratigraphy ahead of a sustained uranium market up-turn which we believe is coming is a significant achievement for our shareholders. Newly-defined exploration criteria and methods for discovery of basement-hosted Athabasca Basin uranium deposits has yet to be applied on this project. The CanAlaska team is looking forward to the next phase of exploration on Key Extension.”
About CanAlaska Uranium
CanAlaska Uranium Ltd. (TSXV: CVV) (OTCQB: CVVUF) (FSE: DH7N) holds interests in approximately 214,000 hectares (530,000 acres), in Canada’s Athabasca Basin – the “Saudi Arabia of Uranium.” CanAlaska’s strategic holdings have attracted major international mining companies. CanAlaska is currently working with Cameco and Denison at two of the Company’s properties in the Eastern Athabasca Basin. CanAlaska is a project generator positioned for discovery success in the world’s richest uranium district. The Company also holds properties prospective for nickel, copper, gold and diamonds. For further information visit www.canalaska.com.
The qualified technical person for this news release is Nathan Bridge, MSc., P.Geo., CanAlaska’s Vice President, Exploration.
On behalf of the Board of Directors
“Peter Dasler”
Peter Dasler, M.Sc., P.Geo.
President
CanAlaska Uranium Ltd.
Contacts:
Cory Belyk, Executive VP and CEO
Tel: +1.604.688.3211 x 306
Email: [email protected]
Peter Dasler, President
Tel: +1.604.688.3211 x 138
Email: [email protected]
Neither TSX Venture Exchange nor its Regulation Services Provider (as that term is defined in the policies of the TSX Venture Exchange) accepts responsibility for the adequacy or accuracy of this release.
Forward-looking information
All statements included in this press release that address activities, events or developments that the Company expects, believes or anticipates will or may occur in the future are forward-looking statements. These forward-looking statements involve numerous assumptions made by the Company based on its experience, perception of historical trends, current conditions, expected future developments and other factors it believes are appropriate in the circumstances. In addition, these statements involve substantial known and unknown risks and uncertainties that contribute to the possibility that the predictions, forecasts, projections and other forward-looking statements will prove inaccurate, certain of which are beyond the Company’s control. Readers should not place undue reliance on forward-looking statements. Except as required by law, the Company does not intend to revise or update these forward-looking statements after the date hereof or revise them to reflect the occurrence of future unanticipated events.