
Could Telsa’s Robots Permanently Eliminate Labor Shortages?
Motivational experts tell us that if you have a goal you want to achieve, write it down, then it becomes better defined and “real.” They also tell us, if you tell others what you’re going to achieve, you’ll be even more likely to succeed. Elon Musk does this. He announces plans to provide something dramatic, like a Cybertruck, fully self-driving car, a colony on Mars, or a robot, years in advance; then he provides ongoing updates. Tesla’s earnings call this week provided him an opportunity to update us on the importance and status of the robot project.
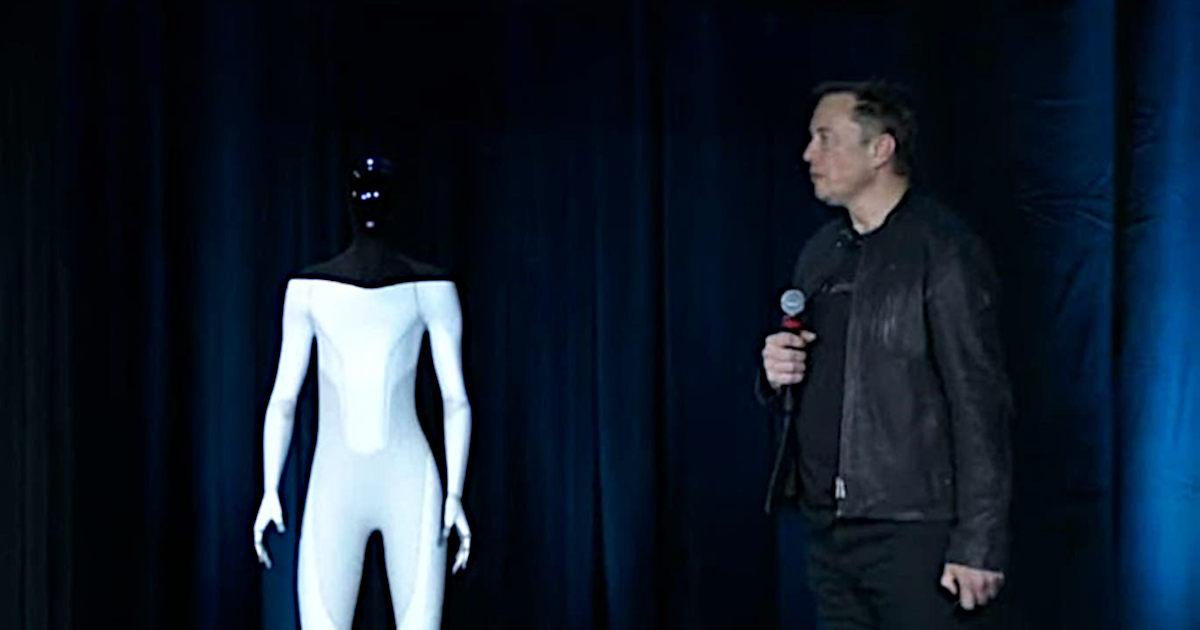
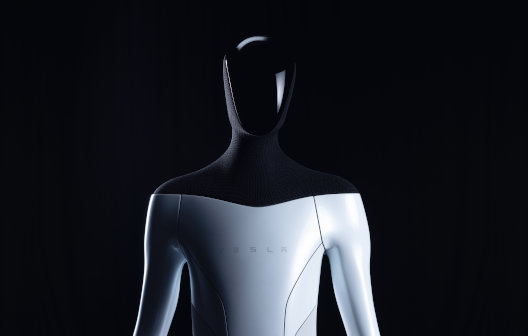
Optimus
Optimus (Latin for “best”) is the “code-name” given to this project at Telsa. Developing a robot to do dangerous, boring, or repetitive tasks would, in the mind of Tesla’s founder, revolutionize the economy, he believes there would not be labor shortages. “If you think about the economy, it is — the foundation of the economy is labor,” he said. “Capital equipment is distilled labor. So what happens if you don’t actually have a labor shortage? I’m not sure what an economy even means at that point. That’s what Optimus is about, so [it’s] very important.”
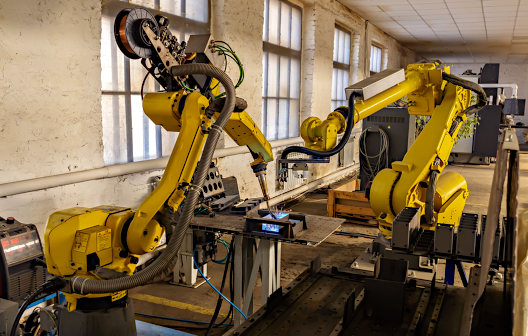
Musk said Wednesday (January 26) he expects the Tesla-Bot could take years to come to market and perhaps will never become fully realized. The goal is to create a machine that can do what can now only be carried out by humans. While advances over the years in robotics have allowed a reduction in workers, there are still limitations with current machines that use existing technology. Many more tasks will be done by robots in the future.
Elon the Showman
The Optimus robot project is the most recent example of Musk announcing his goals publicly, and with typical fanfare and showmanship. In addition to keeping himself on task, his announcing exciting Tesla (or SpaceX) products, envisioned for years into the future, helps to energize employees, excite customers, and of course, attract investors.
|
An Interesting Four-Year-Old The rumor that I’m secretly creating a zombie |
The goals that Musk has in the past set out for any one of his companies, like building EVs for the masses, or reusable space-bound rockets, often require innovation that has not even been fully envisioned. For this reason, he often falls behind on many announced projects. Consumers and investors awaiting products have grown accustomed to delays that often last years. One of many examples of this was the “Autonomy Day” event in April 2019, Musk said the company would have one million autonomous “robotaxis” on the road in 2020. If you’re still waiting for a robotaxi to take you to the airport, you are many more years away from the experience.
About Optimus
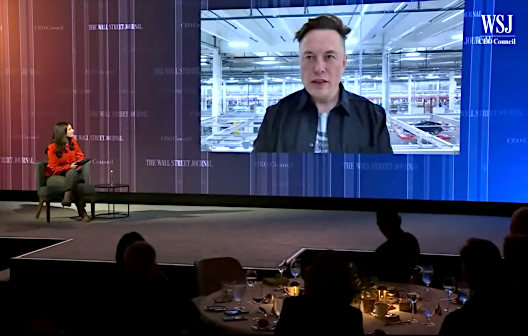
The “Tesla Bot” is the “most important product” that Tesla is developing this year, said Tesla’s CEO on Wednesday’s fourth-quarter earnings call. This places it on the priority list ahead of the Cybertruck, Robotaxi, and other vehicles, including the Semi and the new Roadster. The Tesla Bot, “[it] has the potential to be more significant than the vehicle business over time.”
Take-Away
One thing that can be learned from one of the richest people in the world is how to stay motivated. The other is that failing to meet a goal, timeline, or even follow all the way through is not always important for success. Not unlike investing, where not every trade is a winner, and some securities need to be culled ahead of expectations, running an innovative business does not mean every project is a winner. Some projects need to veer in another direction because of unexpected circumstances, others halted, and others need an even higher priority than originally planned. It is presumed that the next generation of robots will help manufacturing businesses like Tesla. For this reason, a Tesla-Bot is doubly important to the company’s founder.
Managing Editor, Channelchek
Suggested Reading
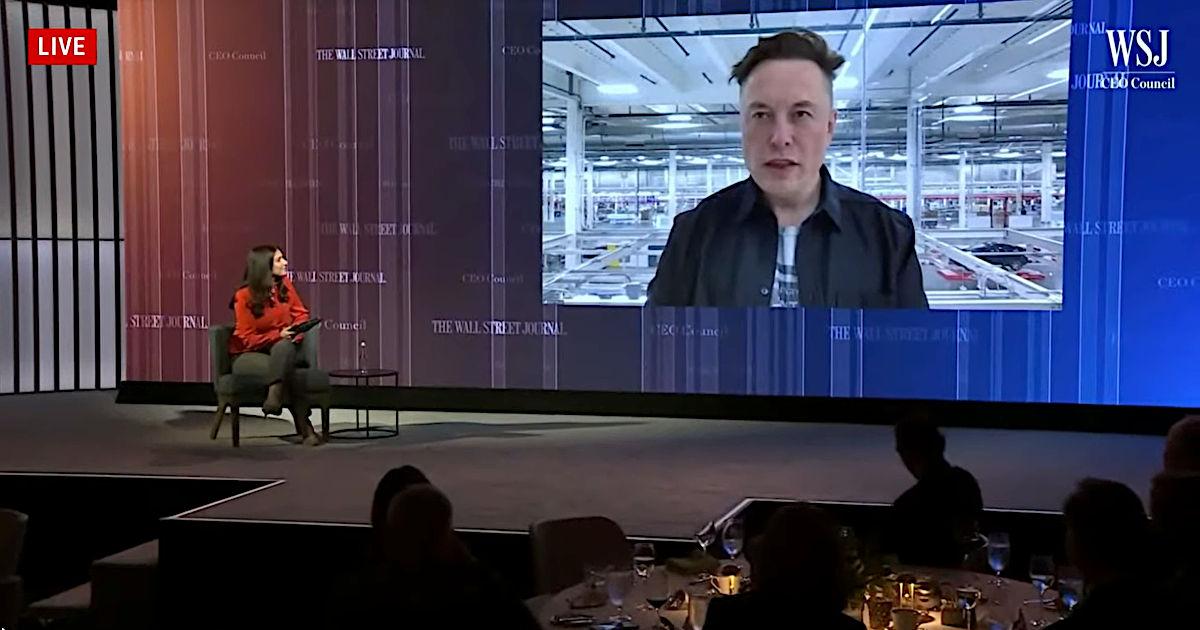
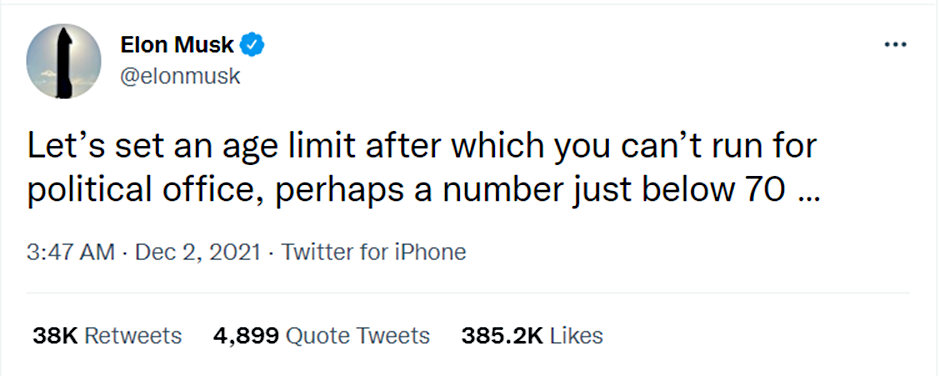
 Tesla’s CEO Surprises Reporters with Views on Robots, Subsidies, and Longevity
|
 Elon Musk’s Tesla Bot Raises Serious Concerns – But Probably Not The Ones You Think
|
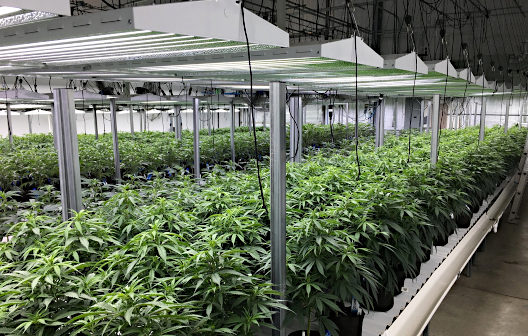 Robotics and AI Are Being Tapped by Cannabis Growers
|
 Social Skills Would Benefit Physical Skills in Robotics
|
Sources
https://www.boringcompany.com/not-a-flamethrower
Stay up to date. Follow us:

|