Image: US Dept. of State (Photo Archive)

Biden’s First State of the Union and Possible Impact on Markets
President Joe Biden has never given a State of the Union address. He’s heard countless SOTUs, and on Wednesday, April 28, 2021, the eve of his 100th day in office, he did speak before a joint session of Congress. But, this is the first official SOTU and accounting of the country’s state of affairs since February 4, 2020.
A lot has changed, including the President that is giving the address. Some of the market and sector-moving expectations from his Build Back Better initiatives seem to be facing a great deal of pushback recently, many seem to have taken a backseat to other events at home and abroad. Will tonight’s speech revive the focus and elevate the industries most likely to benefit?
Big Changes
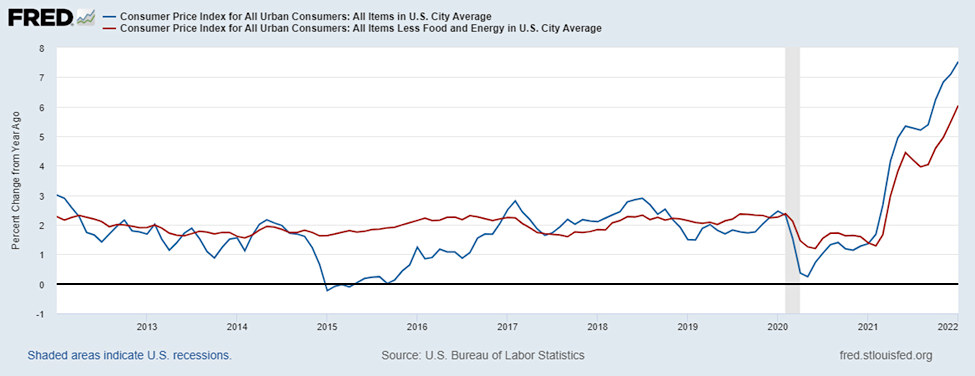
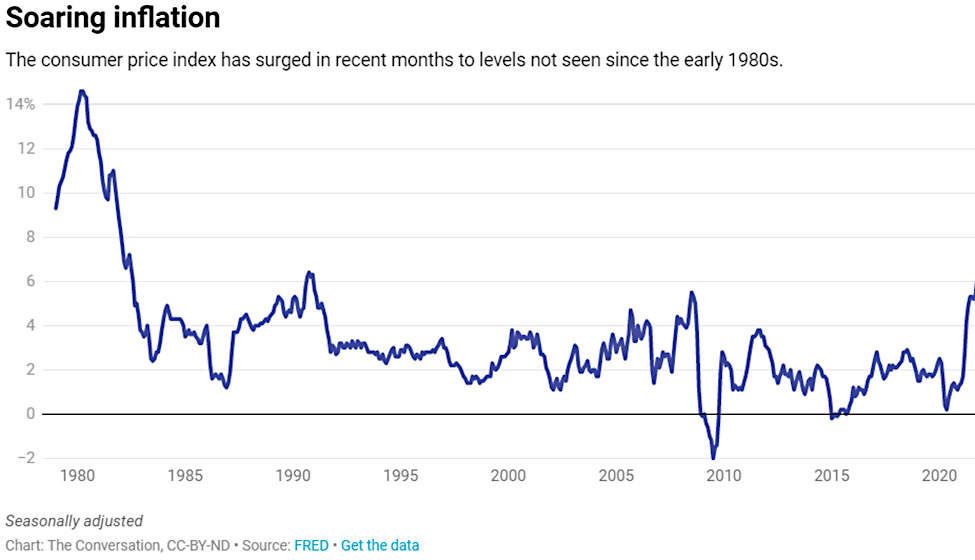
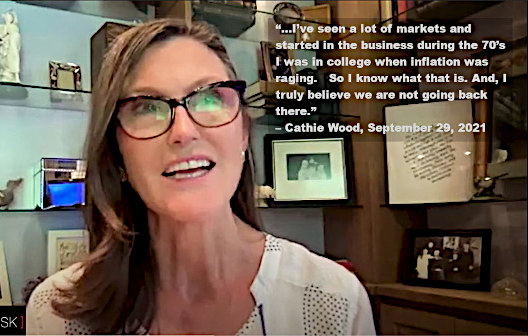
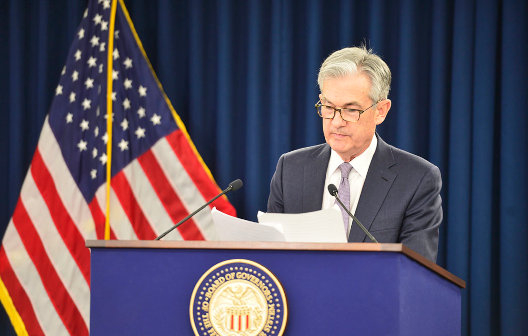
Since the last State of the Union, the fear of deflation has reversed, the current state is the U.S. is experiencing its worst inflation in 40 years, with the risk of prolonged price increases now the focus of economists and market participants.
Inflation isn’t the only thing that has changed. On February 4, 2020, when the last SOTU was given, the novel coronavirus was so “novel” that it was not yet named. It was later in February The World Health Organization (WHO), named the disease Covid19. A few weeks earlier, the U.S. had seen its first case, but it was not yet impacting life in the States.
Energy
There have been trillions approved to be spent on revamping how the U.S. is fueled. These energy initiatives include increased and eventual total reliance on non-fossil fuel forms of energy. Since early 2021, systems have been organized to help develop what is to be the Build Back Better energy initiatives. These plans contrast sharply with two years ago and are now more in-line with initiatives of other developed nations. Now in the early stages, it has left the U.S. vulnerable to shortages during the transition to cleaner fuels. So vulnerable that last year it became necessary for President Biden to ask OPEC+ to pump more oil to fulfill the needs of the U.S.
At the 2020 SOTU, the U.S. was considered “energy independent” and was a net exporter of petroleum. Change to new technologies has its hiccups, but the current state of the U.S. is that we consume more oil than we produce and we’re reliant on other nations. If in his address he believably reassures commitment to alternative fuels and needed infrastructure spending, clean energy market sectors that have been beaten up this year may move in the direction of previous highs. If his economic plan is instead redefined to play down a green focus, further weakness in the alternative fuels sector could follow.
Pandemic
While the last address did not cover Covid19, as it was not a named disease at the time, this address will provide an opportunity for the country to hear an official White House position on whether it expects the steps taken related to the pandemic are expected to be short-lived. These expectations may contribute to how the market opens on Wednesday and behaves.
Russia/Ukraine
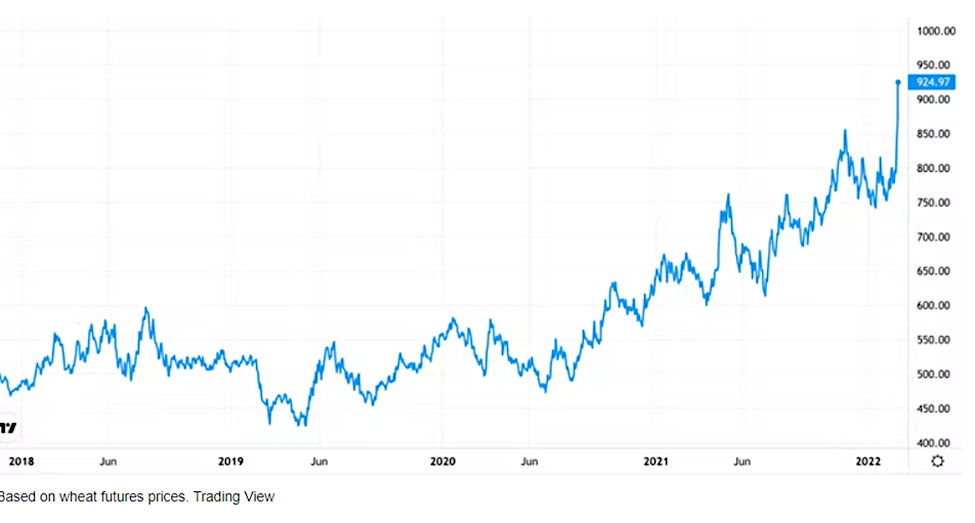
The invasion of Ukraine by Russia is on everyone’s minds. The President will have to address this as well as the risks China relations may present. If his talk is too hawkish, this may rattle markets that involve energy. If too weak, investors may lose confidence in his leadership.
Inflation
In a fact sheet provided on February 28th from the White House, it appears that inflation will get a lot of focus in the address. The speech is likely to talk about manufacturing and making more things in America. Also, moving goods around the country more efficiently and developing a stronger supply chain appears to have been added to his economic plan for the U.S. There could even be talk of reducing the deficit and how working family expenses can be lowered. Also likely to be spoken about is promoting competition to help lower prices to help consumers and stave off some inflation. These are things most American consumers listening at home want to hear.
For investors, getting a sense that inflation will not be persistent, that supply chains are not permanently gunking up the economy, and that money will continue to flow out of Washington in a way that builds or rebuilds infrastructure and provides growth capital to infant industries would set a more bullish tone. It’s a tall order, and worth hoping for.
Biden is scheduled to speak at 9 p.m. Eastern.
Managing Editor, Channelchek
Suggested Reading
 Cryptocurrencies with the Help of DAOs Provide a Means to Support Ukraine’s Efforts
|
 Pros and Cons of a Company Like Berkshire Hathaway in your Portfolio
|
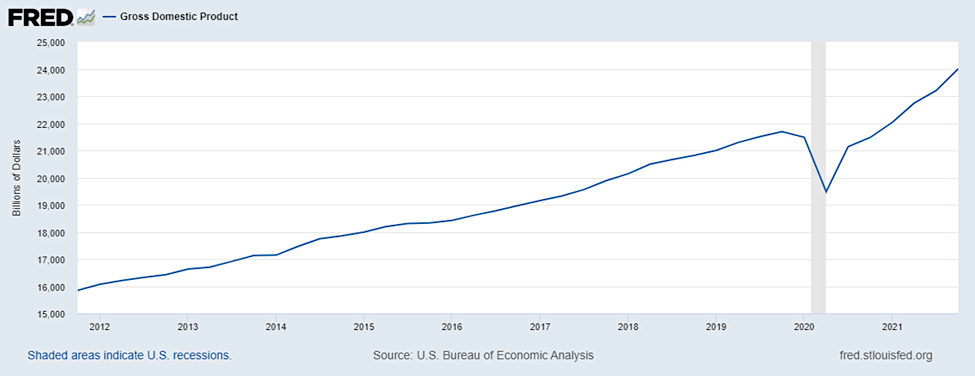
 Is GDP Growth Transitory and Inflation Persistent?
|
 Why 2022 Investing Will Need to be Different
|
Sources
https://www.bls.gov/opub/mlr/2021/beyond-bls/consumer-inflation-during-the-covid-19-pandemic.htm

Stay up to date. Follow us:

|