Image Credit: Monstera (Pexels)
Tilt Confidently – A Perspective on Financial Markets and the Economy
Tilt Confidently
Economic excesses often create potential investment opportunities. When a key economic factor reaches a ridiculous level, it frequently proves profitable to expect a reversal: Recall the 10-year bond yield at 0.5% in mid-2020 (those who tilted investment bets toward rising-yield beneficiaries have since profited)—or the early-1981 extreme of 16%? Another example was 1995, when the U.S. dollar spiked to levels never seen before—nor since. In the 1990s, the labor participation rate peaked near 68% after having never risen above 60% prior to 1970. And, in the mid-1990s, following a decline of nearly 20% from its 1973 post-war high, the real-wage rate finally bottomed.
Although short-term timing on any economic trend is always a challenge, when something gets severely out of bounds, the favored odds are that it is apt to soon adjust. Today, there are several matters that could be considered remarkably out of the norm, including economic policies, inflation, various commodity prices, and geopolitical turmoil. However, in our view, the greatest economic extreme, at this time, is “confidence.”
Extreme Main-Street Pessimism?
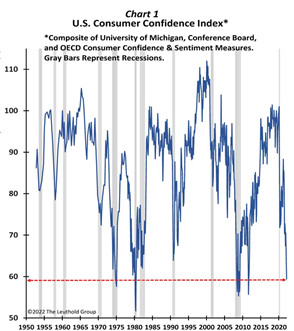
Chart 1 shows a measure of U.S. consumer confidence from the 1950s to date. At present, confidence is lower than 98.5% of the time since 1952! Obviously, pessimism is at an extreme—there have been only a handful of readings as low as today. But what makes this extraordinarily uncommon is, for the last two years, confidence has plummeted while stocks have been in a strong bull market driven by a robust economic recovery. Yes, inflation is currently very high, and there is a war in Ukraine. All the same, inflation was even higher, for longer, in the 1970s when the Vietnam War was ongoing, and, yet, outside of recessions, consumer confidence sustained at much higher levels.
Nearly every significant decay in confidence occurred when the U.S. was in a recession. While an imminent recession is always possible, the likelihood that the U.S. is now in a recession—or even headed for one this year—seems rather remote. Outside of recessions, there was only one other time that confidence was as low as it is today: After a solid recovery in confidence at the start of the 2009 expansion, there was a brief confidence breakdown in mid-2011. Then, renewed fears that the expansion would fail is probably why confidence again declined. Those fears, however, proved unfounded; confidence quickly revived and embarked on a multi-year advance until the 2020 pandemic.
Is confidence about the contemporary expansion following a similar path? It bounced from about 70 to 90 during the first year of this recovery, but since last April, it has again collapsed (like in 2011). Despite strong economic growth and the S&P 500 within 5% of its all-time high, Main Street confidence remains depressed due to a combination of Federal Reserve and interest-rate fears, the highest inflation rate in decades, and Putin’s war.
In our view, even if some or all of these fears continue to fester, confidence will not likely fall much further. Indeed, it would truly be “extreme” if it did. Rather, some of the current nightmares facing the recovery will probably turn out better than feared, causing Main Street sentiment to soon lift, as it did after its 2011 break- down.
According to a Bloomberg survey of private-sector economists, the consensus for U.S. real-GDP growth in 2022 is a robust 3.5%. With Main Street characterized by excessive pessimism and solid real growth, in our view, an opportunity exists for investors to exploit the likelihood that confidence is poised to rise.
Portfolio Tilts For “Rising Confidence?”
Confidence as subdued as today’s is reminiscent of being in a recession that is nearing the start of a new economic expansion. Consequently, many of the investment options highlighted here are typically favored in the infancy of a new economic expansion. It is very odd for conviction to be so low when starting the third year of a recovery.
Nonetheless, if confidence does perk up from today’s extraordinarily low level—whether it is the start of a new expansion or the third year of an ongoing recovery—greater enthusiasm will likely run through both the economy and the stock market in a fashion similar to how it has traditionally done in a fresh recovery.
The following charts illustrate six distinct investments whose relative performance corresponds closely with consumer confidence. Investors may want to consider some of these as possible portfolio tilts.
|
|
1. Cyclicals Need Some Confidence!
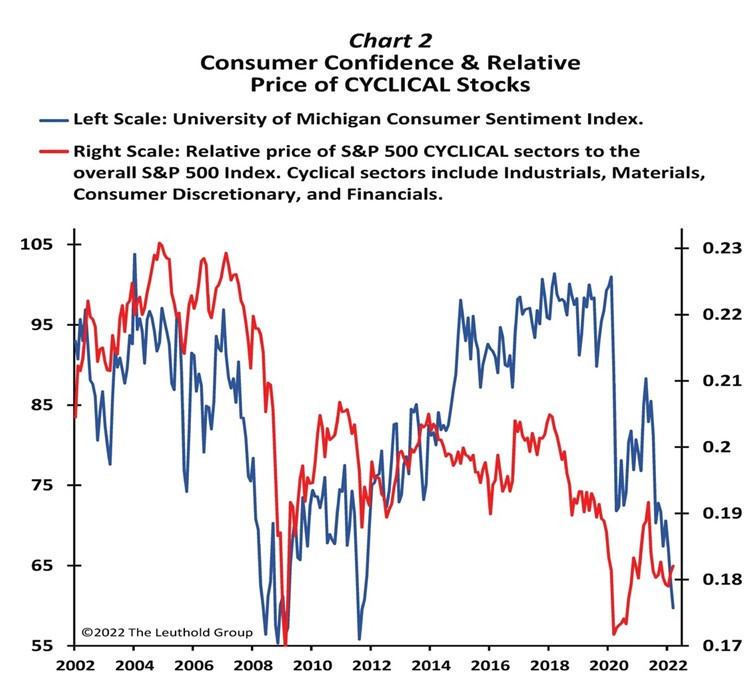
Chart 2 overlays the relative return of the S&P 500’s major cyclical sectors with the Consumer Confidence Index. At least since 2002, there has been a close relationship between cyclical stock leadership and Main Street confidence. Indeed, cyclicals led after the March 2020 bear-market bottom until May 2021, when confidence rolled over. Could cyclical stocks be nearing a “mini-replay” of 2020, driven by a renewed spike in consumer confidence?
|
|
|
|
2. Low Quality?
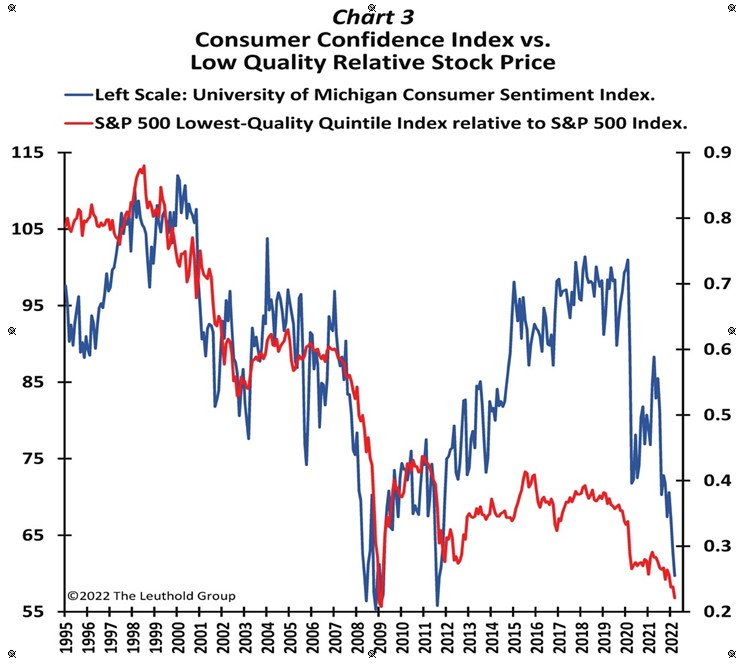
With the S&P 500 Index still trying to recover from a recent correction, and yields rising at an aggressive pace, most are advocating to boost the “quality” in portfolios. However, as illustrated in Chart 3, not only is the relative price of low-quality stocks nearly the same today as at the bottom of the 2009 bear market, but a trend of improved confidence could prompt a period of leadership for low-quality stocks.
|
|
|
|
3. High-Beta’s Run To Continue?
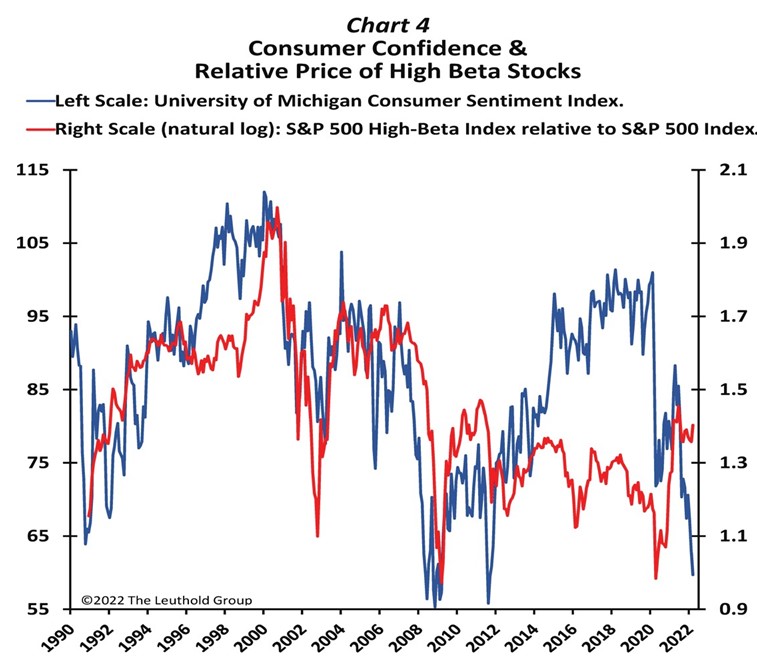
High-beta stocks have led the stock market throughout most of this bull run (Chart 4) and may continue to be superior investments should Main Street confidence finally improve. Most recently, after confidence peaked last May, high-beta has slightly underperformed but has not suffered as aggressively as other confidence-sensitive investments. Nevertheless, since at least 1990, it has paid to be overweight high-beta stocks during periods of improving confidence.
|
|
|
|
4. An IPO Leadership Replay?
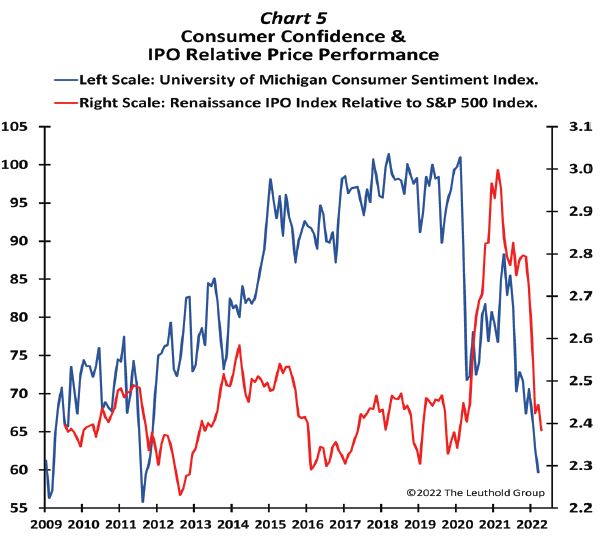
IPOs and SPACs had a massive run earlier in this bull market, followed by an epic collapse (Chart 5). The pattern is similar to the surge and plunge of Main Street confidence. While far from a perfect relationship, since at least 2009, when confidence improved, IPOs directionally outpaced. Likewise, periods of rising pessimism on Main Street have been associated with underperforming IPOs. Many perceive the IPO run as a speculative frenzy that has now been left for dead. Is it possible, though, if confidence again turns up, IPOs could have another “curtain call” in the balance of this bull market?
|
|
|
|
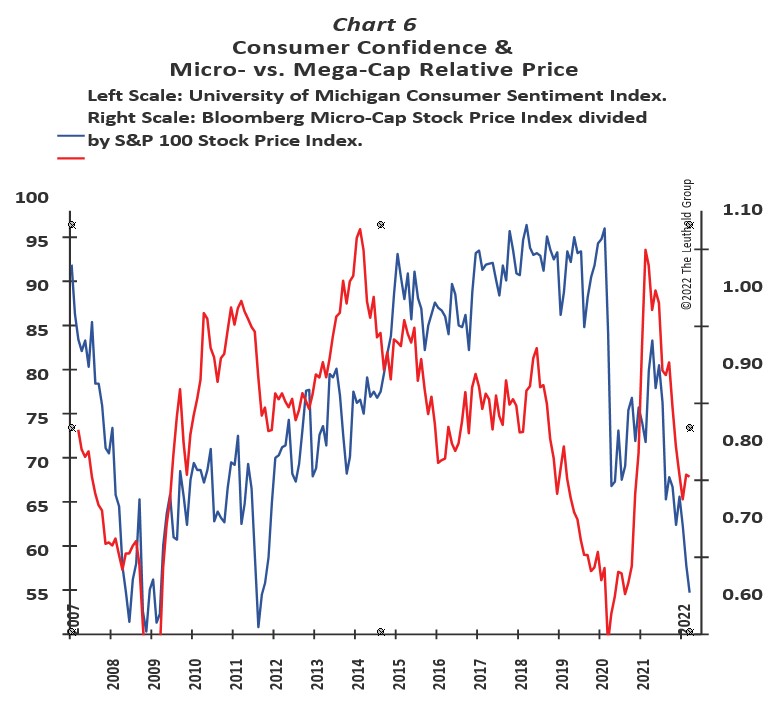
5. Smaller Cap For A Confidence Run!
Not surprisingly, as illustrated by Chart 6, smaller-cap stocks do best when consumer confidence rises. The blue line represents the price return of micro-cap stocks relative to mega-caps. The notable periods when consumer confidence surged (2009, 2011, and 2020) were all associated with solid leadership by microcap stocks. As confidence collapsed over the last year, versus the largest stocks, micro caps have relinquished about two-thirds of their cumulative outperformance since this bull market began in March 2020. If consumer confidence is poised for another revival, it may be time to tilt away from your mega-cap winners toward smaller stocks!
|
|
|
|
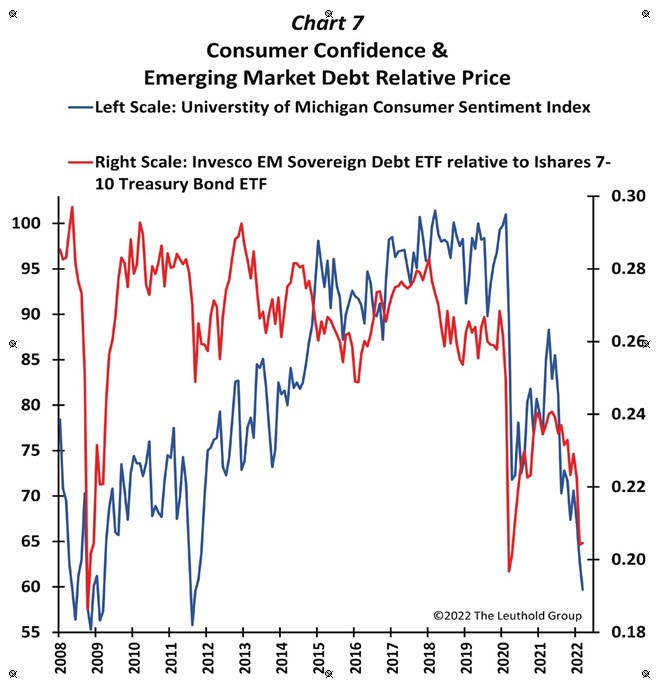
6. Tilting Toward EM Debt?
It is not obvious why EM debt tends to outpace when U.S. consumers are confident. As shown in Chart 7, since 2008, EM debt has significantly rewarded investors whenever Main Street sentiment was improving. Currently, the price of EM debt relative to Treasuries is nearly as low as it was at the stock-market bottoms of 2009 and 2020. It is not a coincidence these were periods when consumer confidence had also declined substantially. This chart is a good reminder that if Main Street confidence does soon improve, investors may need to adjust exposure to bonds as well as stocks.
|
|
Final Comments
Consumer confidence is now as low—or lower— than it has been in any recession in the post-war era. Considering that economic growth looks healthy and the stock market is near record highs, today’s excessive level of Main Street pessimism is odd.
Understandably, many investments that typically do poorly as pessimism rises have been severe underperformers in the last year. Even if a recession is imminent, neither consumer confidence nor sentiment-sensitive investments are likely to do much worse because both are already priced for a recession. But should today’s economic fears prove overblown, Main Street confidence is likely headed for a substantial recovery that should boost the relative results of a number of investments, including cyclicals, low-quality, high-beta, IPOs, small caps, and EM debt.
If you, too, believe there is simply too much pessimism today, get your shopping list ready and “Tilt Confidently.”
The above was reprinted with permission from Paulsen’s Perspective an institutional newsletter published by THE LEUTHOLD GROUP.
Authored by James W Paulsen, Ph.D. Chief Investment Strategist of The Leuthold Group, LLC. Jim is a member of the investment committee, authors market and economic commentary, and works with the Leuthold investment team in serving institutional, financial advisor, and investment professional clients.
The Leuthold Group has been producing original analysis for the institutional marketplace for nearly half a century. Driven by the research, its investment management arm is centered on tactical asset allocation and disciplined quantitative methodologies.

Stay up to date. Follow us: