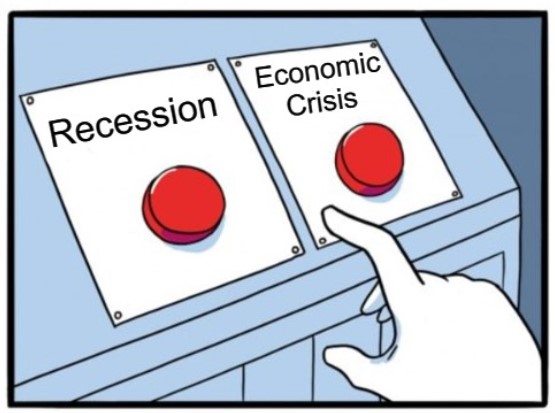
What Will the Fed Choose: Recession or an Economic Crisis?
Last week was all about earnings, as some of Wall Street’s heavyweights released their quarterly reports. Moreover, while mixed results caused sentiment to swing from one extreme to the other, inflation remains front and center, and the outlook for Fed policy is bullish.
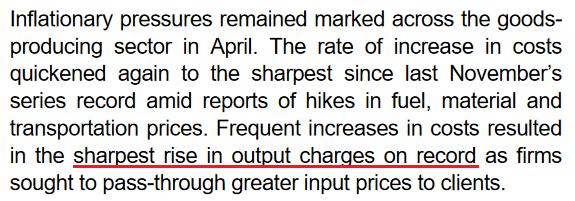
For example, whether it’s PepsiCo, Mondelez, or Whirlpool, companies have warned that inflation remains extremely problematic. Moreover, with American Express and Visa highlighting consumers’ eagerness to spend, the pricing pressures show no signs of slowing down. Likewise, S&P Global released its U.S. Composite PMI on Apr. 22, and I wrote on Apr. 25 that it was another all-time high for inflation.
Services:
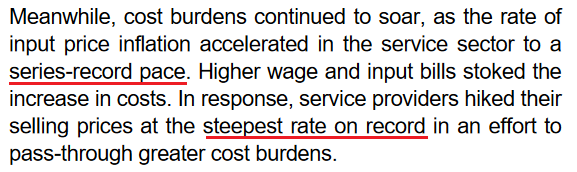
Source: S&P Global
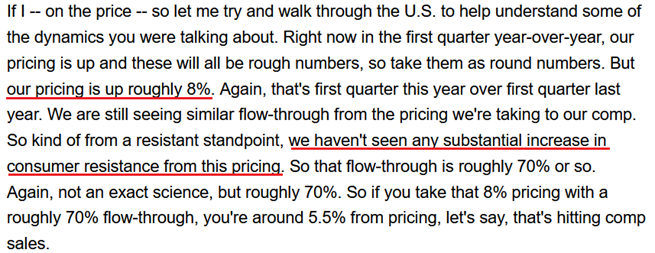
Manufacturing:
Source: S&P Global
With growth, employment and inflation supporting several rate hikes over the next several months, there is little in the release that implies a dovish U-turn. To that point, please remember that the survey was conducted from Apr. 11 to Apr. 21. Therefore, while investors hope that decelerating growth and inflation will allow the Fed to back off, the PMI data suggests otherwise. As such, the Fed’s conundrum continues to intensify.
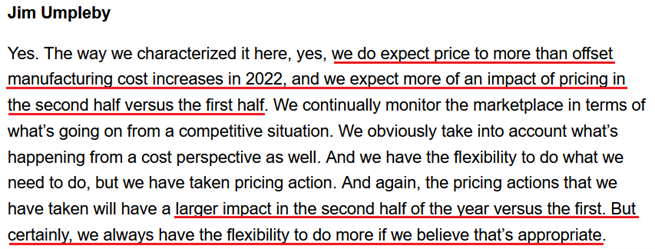
Furthermore, with more appetizing earnings reports released on Apr. 28, the results were even more bullish for Fed policy. Likewise, with the precious metals (PMs’) force fields wearing off, they should suffer profoundly as rate hike volatility increases. For example, McDonald’s released its first-quarter earnings on Apr. 28. CFO Kevin Ozan said during the Q1 earnings call:
“In the U.S., I think last quarter, I mentioned that we thought commodities were going to be up roughly 8% or so for the U.S. That number is now more like 12% to 14% for the year. So U.S. commodities clearly have risen (…).”
“On the labor side, in the U.S., it’s probably over 10% right now. Part of that is because, you’ll recall that we made adjustments to our wages in our company-owned restaurants mid-year last year, so we haven’t lapped that. So part of it is due to that and part of it is due to just continued wage inflation.”
As a result, the Fed is losing control of the inflation situation, and the largest restaurant chain in the world is still sounding the alarm. Therefore, with the pricing pressures unwilling to abate on their own (which I’ve warned about for some time), killing demand is the only way to reduce the wage-price spiral.
Please see below:
Source: McDonald’s/Seeking Alpha
On top of that, Caterpillar released its first-quarter earnings on Apr. 28. For context, the company is the world’s largest construction equipment manufacturer. CFO Andrew Bonfield said during the Q1 earnings call:
“We remain encouraged by the strong demand for our products and services. The first quarter of 2022 marked the fifth consecutive quarter of higher end user demand compared to the prior year. Services remained strong in the quarter. We continue to make progress on our service initiatives, including customer value agreements, e-commerce, connected assets and prioritized service events.”
CEO Jim Umpleby added:
“Absent the supply chain constraints, our top line would have been even stronger. When the supply chain conditions ease, we expect to be well positioned to fully meet demand and gain operating leverage from higher volumes.”
Thus, with each new earnings season, companies note that demand remains resilient. As a result, why not raise prices and capitalize on too much stimulus?
Source: Caterpillar/Seeking Alpha
As expected, the “transitory” camp waved the white flag in 2022. However, the merry-go-round of input/output inflation was visible from a mile away. For example, remember what I wrote on Mar. 30, 2021?
Didn’t Powell insist that near-term inflation was only “one-time” and “transient”? Well, despite government-issued CPI data failing to capture the effect of the Fed’s liquidity circus, pricing pressures are popping up everywhere. And with corporations’ decision tree left to raising prices or accepting lower margins, which one do you think they’ll choose?
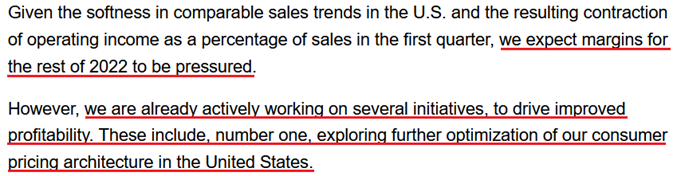
Continuing the theme, Domino’s Pizza reported its first-quarter earnings on Apr. 28. For context, the company is the largest pizza chain in the U.S. Moreover, when contrasting the quarterly results of Microsoft and Alphabet on Apr. 28, I wrote that investors fail to realize that some companies have succumbed to the medium-term realities sooner than others. Therefore, Domino’s Pizza is another example. CEO Ritch Allison said during the Q1 earnings call:
“Consistent with our communications during our prior earnings call, we faced significant inflationary cost increases across the business in Q1. Those cost pressures combined with the deleveraging from the decline in U.S. same-store sales resulted in earnings falling short of our high expectations for the business (…).”
“We believe that we will continue to face pressure both on the top line for our U.S. business and on our bottom line earnings over the next few quarters. While we remain very optimistic about our ability to drive long-term profitable growth in the near-term 2022 is shaping up to be a challenging year.”
CFO Sandeep Reddy added:
“In addition, we would like to update the guidance we provided in March for 2022. Based on the continuously evolving inflationary environment, we now expect the increase in the store food basket within our U.S. system to range from 10% to 12% as compared to 2021 levels.”
If that wasn’t enough, with unprecedented handouts reducing U.S. citizens’ incentive to work, staffing shortages materially impacted Domino’s Q1 results. Moreover, the development is extremely inflationary and only increases the chances of future interest rate hikes.
Please see below:
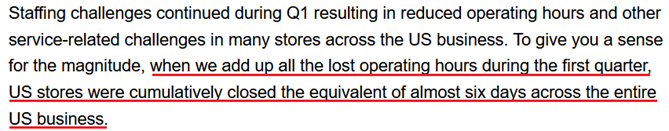
Source: Domino’s Pizza/Seeking Alpha
Therefore, while I’ve warned on numerous occasions that the Fed is in a lose-lose situation, investors still hold out hope for a dovish pivot. However, they fail to understand the consequences. For example, a dovish 180 is extremely unlikely in this environment; but even if officials completely reversed course, the long-term economic damage would be even more paramount.
When companies are saddled with input pressures, even value-oriented chains like Domino’s Pizza can only endure margin erosion for so long. Thus, with management searching for new ways to appease investors, Fed officials’ patience will only cause an even bigger long-term collapse once inflationary demand destruction unfolds.
Please see below:
Source: Domino’s Pizza/Seeking Alpha
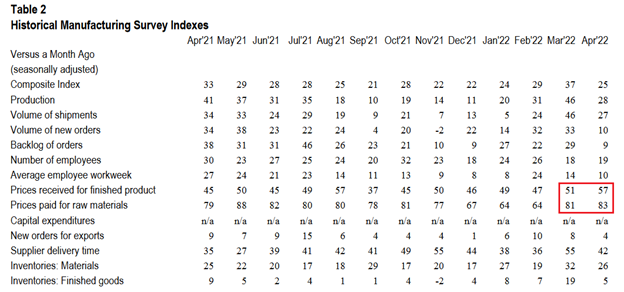
Turning to the macroeconomic front, some interesting data also hit the wire on Apr. 28. For example, the Kansas City Fed released its Tenth District Manufacturing Survey. The headline index declined from 37 in March to 25 in April. Chad Wilkerson, Vice President and Economist at the KC Fed, said:
“The pace of regional factory growth eased somewhat but remained strong. Firms continued to report issues with higher input prices, increased supply chain disruptions, and labor shortages. However, firms were optimistic about future activity and reported little impact from higher interest rates.”
To that point, both the prices paid and received indexes increased month-over-month (MoM).
Please see below:
Source: KC Fed
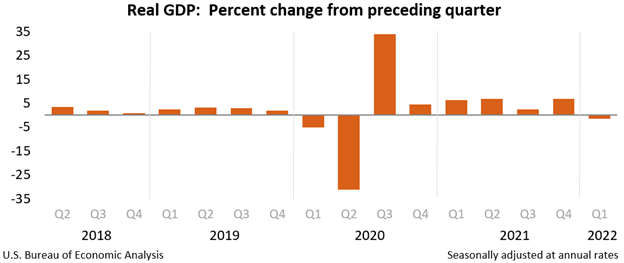
Finally, the major surprise on Apr. 28 was that U.S. real GDP contracted by 1.4% (advance estimate) in Q1. The report stated: “The decrease in real GDP reflected decreases in private inventory investment, exports, federal government spending, and state and local government spending, while imports, which are a subtraction in the calculation of GDP, increased.”
However: “Personal consumption expenditures (PCE), nonresidential fixed investment, and residential fixed investment increased.”
Therefore, with supply chain disruptions leading to import stockpiling (which hurts GDP), net trade was the weak link. However, the dynamic should reverse in Q2 and Q3, and if so, shouldn’t impact the Fed’s rate hike cycle.
The bottom line? The Fed is stuck between a rock and a hard place: deal with inflation now and (likely) push the U.S. into a recession later or ignore inflation and watch an even bigger crisis unfold down the road. As such, the first option is the most likely outcome. Remember, while Fed officials may seem out of touch, they’re not stupid, and history shows the devastating consequences of letting unabated inflation fester. Therefore, interest rate hikes should dominate the headlines over the next several months, and the PMs and the S&P 500 should suffer mightily along the way.
In conclusion, the PMs were mixed on Apr. 28, as silver was the daily underperformer. Moreover, while mining stocks were boosted by the S&P 500, the ‘buy the dip’ crowd is fighting a losing battle. With Amazon and Apple down after the bell on Apr. 28, weak earnings guidance should also dominate the headlines in the months to come. As a result, with the USD Index on fire and real yields poised to continue their ascent, the PMs’ medium-term outlooks are extremely treacherous.
What to Watch for Next Week
With more U.S. economic data releases next week, the most important are as follows:
May 2: ISM Manufacturing PMI
Like this week’s S&P Global Report, ISM’s report is one of the most important data points because it covers growth, inflation, and employment across the entire U.S. Therefore, the results are more relevant than regional surveys.
May 3: JOLTS job openings
Since the lagged data covers March’s figures, it’s less relevant than leading data like the PMIs. However, it’s still important to monitor how government-tallied results are shaping up.
May 4: ADP private payrolls, ISM Services PMI, FOMC statement and press conference
With the FOMC poised to hike interest rates by 50 basis points on May 4, the results and Powell’s comments are the most important fundamental developments of the week. However, ADP’s private payrolls will also provide insight into the health of the U.S. labor market, while the ISM’s Services PMI will have similar implications as the manufacturing PMI. Moreover, both will provide clues about future Fed policy.
May 5: Challenger jobs cuts
With the data showcasing how many employees were fired in April, it’s another indicator of the health of the U.S. labor market.
May 6: Nonfarm payrolls, unemployment rate, average hourly earnings
Half of the Fed’s dual mandate is maximum employment, so continued strength in nonfarm payrolls is bullish for Fed policy. In addition, a low unemployment rate is also helpful, while average hourly earnings will showcase the current state of wage inflation.
All in all, economic data releases impact precious metals because they impact monetary policy. Moreover, if we continue to see higher employment and inflation, the Fed should keep its foot on the hawkish accelerator. If that occurs, the outcome is profoundly bearish for the PMs.
|
About the Author: Przemyslaw Radomski, CFA (PR) writes for and publishes articles that underscore his disposition of being passionately curious about markets behavior. He uses his statistical and financial background to question the common views and profit on the misconceptions.
|
Suggested Reading
Stay up to date. Follow us: