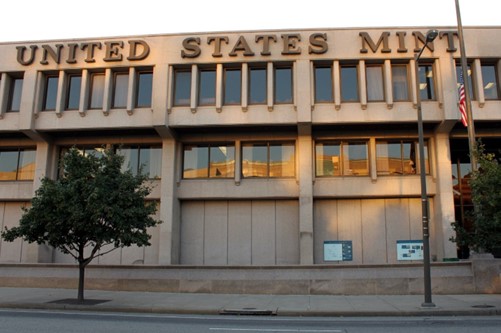
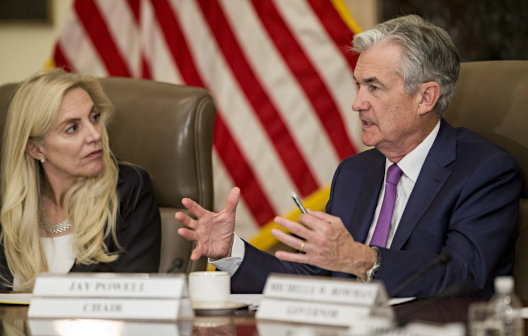
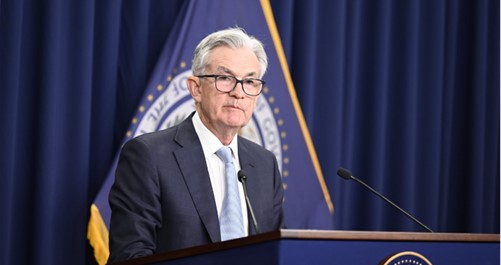
Image Credit: Federal Reserve (Flickr)
The Fed Chairman is Less Likely to Box Himself in With Specific Promises
It might surprise investors born after 1990 that back when 69-year-old Jerome Powell was a young man working for an investment bank, the Fed was very secretive. There was no forward guidance announced, and rate moves were never made immediately after FOMC meetings. Instead, the Fed changed policy secretly on random Fridays. Any adjustments to Fed Funds levels were not made certain to the public until the minutes were released over a month later. The markets were instead left to figure out what the Fed may or may not be doing.
The covert Fed slowly became more open under pressure from Congress toward the end of Greenspan’s 18 years. His last term ended in early 2006. He was followed by Bernanke, who, as part of the financial crisis of 2008, moved toward an even more overt Fed, signaling what to expect years out so that markets would be calmed. Yellen followed Bernanke and continued the policies of setting longer-term expectations.
Powell’s first term caused another leap toward more openly showing the Fed’s playbook to the world. The Fed made sure there were no surprises and worked to calm fears. After all, he was Fed chair during the pandemic, it became important for the U.S. central bank to show it had a plan; this helped to maintain confidence in economies worldwide.
Today Powell has continued his pandemic era guidance up until the last interest rate move in June, where he moved more aggressively than previously stated he would. Otherwise, he has, well in advance, let markets know when and by how much rates are going to move. In June, he had previously guided a 50bp tightening. Just prior to the meeting, stronger economic numbers were released; this prompted the FOMC to move by more than the initial telegraphed guidance.
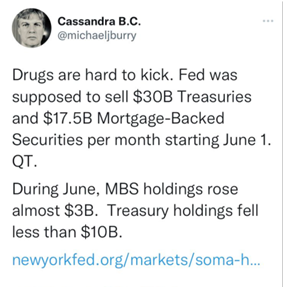
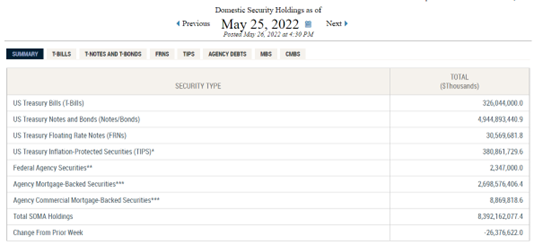
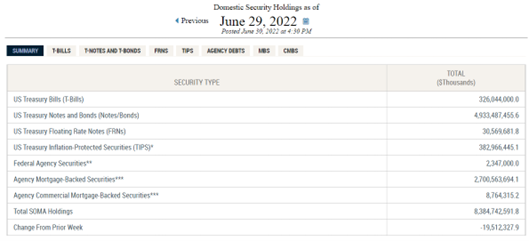
Since it began its current round of interest-rate hikes this year, the U.S. Federal Reserve has aimed to let investors know ahead of time, not just where rates are heading but exactly how big a move to expect each time. It also more aggressively reduced its previously announced purchase of securities (tapering) as it became clearer to Fed governors that inflation was more persistent than transitory.
Fed Chair Powell wants the markets to know that he reserves the right to change plans as conditions change. He did this by moving 75bp in June and by changing the tapering strategy. Conditions are now too uncertain to be locked into 90-day-old promises. He isn’t likely to abandon telegraphing expectations, but he doesn’t want to jolt the market if he and other voting members of the FOMC adjust their thinking last minute. This gives them more flexibility.
The Fed’s ability to be more nimble and pivot should create confidence within the markets. During the 2008 financial crisis, what the markets needed to hear was rates would be held low for a long time; this way, capital could flow with increased confidence. Now the confidence would seem to come from the comfort that the Fed will do what it takes even if it shifts its plans unannounced and more quickly.
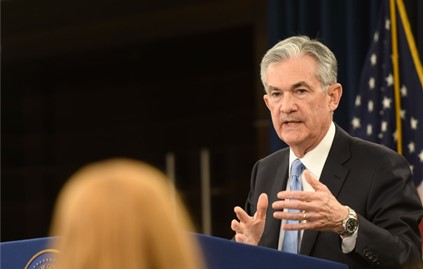
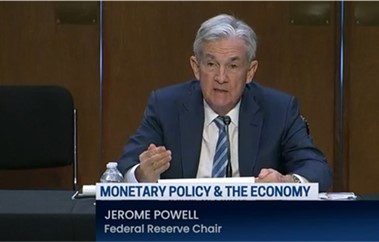
“It’s a very difficult environment to try to give forward guidance 60, 90 days in advance,” Powell said during a press conference on May 4th. “There are just so many things that can happen in the economy and around the world. So, you know, we’re leaving ourselves room to look at the data and make a decision as we get there.”
Take Away
As the head of the world’s most powerful central bank, battling record inflation, Powell’s primary duty is to get it right; estimating what the months ahead will bring is too difficult, and tying the Fed’s hands with pre-announced moves could interfere with the needed precision to achieve an economic soft landing.
On Wednesday, July 27th, the FOMC ends a two-day meeting at which they are expected to agree on a 0.75 percentage point increase. It is likely that the statement afterward will again put parameters around what to expect after the September 20-21 meeting. But that meeting is two months away, so the wording may be less exacting than we have become accustomed to.
Managing Editor, Channelchek
Suggested Content
 Both Powell and Yellen are Resolved to Clobber Bond Prices
|
 Bond Market Understanding is Again Critical for Stock Investors
|
 One Way to Keep the Investor Focus Needed to Succeed When Markets Turn
|
 Leveraged and Inverse ETF Do’s and Mostly Don’ts
|
Sources
https://www.federalreserve.gov/mediacenter/files/FOMCpresconf20220504.pdf
Stay up to date. Follow us:

|