Xcel Brands, Inc. 1333 Broadway 10th Floor New York, NY 10018 United States https:/Sector(s): Consumer Cyclical Industry: Apparel Manufacturing Full Time Employees: 84 Key Executives Name Title Pay Exercised Year Born Mr. Robert W. D’Loren Chairman, Pres & CEO 1.27M N/A 1958 Mr. James F. Haran CFO, Principal Financial & Accou
Michael Kupinski, Director of Research, Equity Research Analyst, Digital, Media & Technology , Noble Capital Markets, Inc.
Refer to the full report for the price target, fundamental analysis, and rating.
Files S1. The company plans to sell 1.381 million shares on a “best efforts” basis and pre-funded warrants. Pre-funded warrants are exercisable at any time after the date of issuance and may be exercised at any time. Notably, management has indicated its interest in participating in the offering for up to 10% of the shares. Following the prospective sale, total shares outstanding would increase to 3.819 million shares.
Use of proceeds. Based on the current stock price and assuming all shares are sold, management expects to generate roughly $1.9 million in net proceeds from the offering. The company plans to use the proceeds for working capital and general corporate purposes and toward a $50,000 principal loan payment to a company controlled by Robert D’Loren, the company’s Chairman and CEO.
Equity Research is available at no cost to Registered users of Channelchek. Not a Member? Click ‘Join’ to join the Channelchek Community. There is no cost to register, and we never collect credit card information.
This Company Sponsored Research is provided by Noble Capital Markets, Inc., a FINRA and S.E.C. registered broker-dealer (B/D).
*Analyst certification and important disclosures included in the full report. NOTE: investment decisions should not be based upon the content of this research summary. Proper due diligence is required before making any investment decision.
Middle market companies across manufacturing, retail, and technology sectors are scrambling to assess potential impacts after President Trump’s Monday announcement of 25% tariffs on Japanese and South Korean imports, set to take effect August 1st. The move sent shockwaves through equity markets, with major indices posting their worst single-day performance in weeks.
The Dow Jones Industrial Average plummeted over 400 points, closing down 1.21%, while the S&P 500 and Nasdaq Composite shed 0.98% and 1.03% respectively. For middle market investors, the selloff signals deeper concerns about how expanding trade tensions could reshape global supply chains and corporate profitability.
Middle market manufacturers with exposure to Japanese and South Korean suppliers face immediate headwinds. Companies in automotive parts, electronics components, and industrial machinery sectors are particularly vulnerable, as these industries rely heavily on specialized inputs from both countries.
Japan remains a critical supplier of precision machinery and automotive components, while South Korea dominates in semiconductors, displays, and advanced materials. The proposed 25% levy could force companies to either absorb significant cost increases or pass them to consumers, potentially crimping demand.
Trump’s escalation extends beyond Asia, with threatened tariffs ranging from 25% to 40% on imports from South Africa, Malaysia, and other nations. The President’s additional 10% levy on countries aligned with BRICS policies adds another layer of complexity for companies with emerging market exposure.
The timing proves particularly challenging as many middle market firms are still recovering from previous trade disruptions. Companies that invested heavily in supply chain diversification following earlier tariff rounds now face the prospect of further reorganization.
Technology-focused middle market companies face dual pressures from both component cost increases and potential retaliation affecting export opportunities. Manufacturing firms with just-in-time inventory systems may need to accelerate stockpiling, tying up working capital.
Retail-oriented middle market companies importing consumer goods from targeted countries could see margin compression if they cannot pass costs to price-sensitive customers. The uncertainty also complicates inventory planning and pricing strategies heading into the crucial back-to-school and holiday seasons.
Despite the volatility, some middle market investors see potential opportunities emerging. Companies with domestic supply chains or those positioned to benefit from supply chain reshoring could gain competitive advantages. Additionally, firms with strong balance sheets may find acquisition opportunities as smaller competitors struggle with increased costs.
Treasury Secretary Scott Bessent’s indication of potential deals in coming days provides some hope for resolution, though markets remain skeptical given the administration’s aggressive timeline. The focus on 18 major trading partners before expanding to over 100 countries suggests a systematic approach, but also highlights the scope of potential disruption.
With earnings season approaching, middle market companies will face intense scrutiny on guidance and cost management strategies. Thursday’s Delta Air Lines report kicks off what many analysts expect to be a challenging quarter for companies with significant international exposure.
The key question for middle market investors remains whether current valuations adequately reflect the potential for prolonged trade tensions. As markets digest the implications of Trump’s latest tariff expansion, portfolio positioning and risk management become increasingly critical for navigating the uncertain landscape ahead.
Joe Gomes, CFA, Managing Director, Equity Research Analyst, Generalist , Noble Capital Markets, Inc.
Refer to the full report for the price target, fundamental analysis, and rating.
Refi. Commercial Vehicle Group successfully refinanced its debt, extending the maturity out to 2030 from 2027. We believe this should provide the Company with additional financial flexibility as management continues to drive further operational efficiency.
Details. The Company went from an $85 million term loan to a $95 million term loan and from a $125 million ABL to a $115 million ABL. Proceeds were used to repay $120.1 million outstanding under the previous facility. The initial interest rate on the term loan is 9.75%, although future rates will have a tiered interest cost based on the consolidated leverage ratio. The initial ABL rate is SOFR plus 1.75%.
Equity Research is available at no cost to Registered users of Channelchek. Not a Member? Click ‘Join’ to join the Channelchek Community. There is no cost to register, and we never collect credit card information.
This Company Sponsored Research is provided by Noble Capital Markets, Inc., a FINRA and S.E.C. registered broker-dealer (B/D).
*Analyst certification and important disclosures included in the full report. NOTE: investment decisions should not be based upon the content of this research summary. Proper due diligence is required before making any investment decision.
Joe Gomes, CFA, Managing Director, Equity Research Analyst, Generalist , Noble Capital Markets, Inc.
Refer to the full report for the price target, fundamental analysis, and rating.
Diner Views. Today’s diners are seeking out venues that prioritize entertainment and uniqueness, according to a Yelp survey that analyzed consumer web searches from January to March. The Yelp findings are in-line with recent research by hospitality management platform SevenRooms. According to SevenRooms’ 2025 U.S. Restaurant Industry Trends, consumers who dine out value unique experiences, even at a premium, with 74% of consumers returning to a restaurant after a unique experience.
A Vibe Dining Leader. As a leader in Vibe Dining, ONE Hospitality is well positioned to capitalize on this trend through its portfolio of concepts, including chains STK, Benihana, Kona Grill, and RA Sushi, as well as the Salt Water Social and Samurai concepts. These upscale and polished casual, high-energy restaurants and lounges provide entertainment and unique experiences for diners, as well as one-of-a-kind, celebratory experiences that bring customers back.
Equity Research is available at no cost to Registered users of Channelchek. Not a Member? Click ‘Join’ to join the Channelchek Community. There is no cost to register, and we never collect credit card information.
This Company Sponsored Research is provided by Noble Capital Markets, Inc., a FINRA and S.E.C. registered broker-dealer (B/D).
*Analyst certification and important disclosures included in the full report. NOTE: investment decisions should not be based upon the content of this research summary. Proper due diligence is required before making any investment decision.
Iconic Burger Franchise to Increase Footprint in State to Over 40 Restaurants
LOS ANGELES, July 02, 2025 (GLOBE NEWSWIRE) — FAT (Fresh. Authentic. Tasty.) Brands Inc., parent company of Fatburger and 17 other restaurant concepts, announces a new development deal with existing franchisee Whole Factor Inc., to open 40 additional Fatburger locations across Florida over the next 10 years, including new areas such as Jacksonville. Since 2021, Whole Factor Inc. has been steadily growing the Fatburger brand across the state with a 14-unit development deal to grow in the Orlando and Tampa areas, with two restaurants open to date in Riverview and Celebration.
“Two years ago, Fatburger made its return to the state of Florida after a 20-year absence, and we are not looking back,” said Taylor Wiederhorn, Co-CEO and Chief Development Officer of FAT Brands. “Our Riverview and Celebration locations have exceeded expectations with an incredible fanbase that loves our cooked-to-order burgers, fries, and hand-scooped milkshakes. Whole Factor is an excellent partner that understands what makes Fatburger such a unique, beloved brand, and their future growth will cement Fatburger as a key burger player in the state of Florida.”
“We are excited to grow Fatburger across the state with Whole Factor Inc., bringing our fresh, handcrafted burgers to more communities in the Tampa and Orlando areas in addition to entering the Jacksonville market,” said Spike Singh, Owner of Whole Factor Inc. “With a new store opening later this year in Orange Park near Jacksonville, we are eager to share Fatburger’s iconic menu and vibrant atmosphere with even more fans.”
Ever since the first Fatburger opened in Los Angeles over 70 years ago, the chain has been known for its delicious, grilled-to-perfection and cooked-to-order burgers. Founder Lovie Yancey believed that a big burger with everything on it is a meal in itself; at Fatburger “everything” is not just the usual roster of toppings. Burgers can be customized with everything from bacon and eggs to chili and onion rings. In addition to its famous burgers, the Fatburger menu also includes Fat and Skinny Fries, sweet potato fries, scratch-made onion rings, Impossible™ Burgers, turkeyburgers, hand-breaded crispy chicken sandwiches, and hand-scooped milkshakes made from 100 percent real ice cream.
FAT Brands (NASDAQ: FAT) is a leading global franchising company that strategically acquires, markets and develops fast casual, quick-service, casual and polished casual dining restaurant concepts around the world. The Company currently owns 18 restaurant brands: Round Table Pizza, Fatburger, Marble Slab Creamery, Johnny Rockets, Fazoli’s, Twin Peaks, Great American Cookies, Smokey Bones, Hot Dog on a Stick, Buffalo’s Cafe & Express, Hurricane Grill & Wings, Pretzelmaker, Elevation Burger, Native Grill & Wings, Yalla Mediterranean and Ponderosa and Bonanza Steakhouses, and franchises and owns over 2,300 units worldwide. For more information on FAT Brands, please visit www.fatbrands.com.
About Fatburger
An all-American, Hollywood favorite, Fatburger is a fast-casual restaurant serving big, juicy, tasty burgers, crafted specifically to each customer’s liking. With a legacy spanning over 70 years, Fatburger’s extraordinary quality and taste inspire fierce loyalty amongst its fan base, which includes a number of A-list celebrities and athletes. Featuring a contemporary design and ambiance, Fatburger offers an unparalleled dining experience, demonstrating the same dedication to serving gourmet, homemade, custom-built burgers as it has since 1952 – The Last Great Hamburger Stand™.
Forward Looking Statements
This press release contains forward-looking statements within the meaning of the Private Securities Litigation Reform Act of 1995, including statements relating to the timing and performance of new store openings and area development agreements. Forward-looking statements reflect expectations of FAT Brands Inc. (“we” or “our”) concerning the future and are subject to significant business, economic and competitive risks, uncertainties and contingencies. These factors are difficult to predict and beyond our control, and could cause our actual results to differ materially from those expressed or implied in such forward-looking statements. We refer you to the documents that we file from time to time with the Securities and Exchange Commission, such as our reports on Form 10-K, Form 10-Q and Form 8-K, for a discussion of these and other factors. We undertake no obligation to update any forward-looking statement to reflect events or circumstances occurring after the date of this press release.
Joe Gomes, CFA, Managing Director, Equity Research Analyst, Generalist , Noble Capital Markets, Inc.
Refer to the full report for the price target, fundamental analysis, and rating.
Mixed Environment. Steelcase continues to face a mixed environment, both on a vertical basis and a geographical basis. The key large corporate customer cohort is doing well, driven by a number of factors such as return to office, but education and government have been hit by funding uncertainties. Germany and France remain sluggish in the key small-to-mid-sized business, but India and China are doing better.
International Actions. Steelcase is taking steps to implement additional cost reduction efforts in Europe, given the weak macroeconomic factors and lower demand in France and Germany. A goal of these actions is to get the International segment back to profitability.
Equity Research is available at no cost to Registered users of Channelchek. Not a Member? Click ‘Join’ to join the Channelchek Community. There is no cost to register, and we never collect credit card information.
This Company Sponsored Research is provided by Noble Capital Markets, Inc., a FINRA and S.E.C. registered broker-dealer (B/D).
*Analyst certification and important disclosures included in the full report. NOTE: investment decisions should not be based upon the content of this research summary. Proper due diligence is required before making any investment decision.
Key Points: – Mortgage rates fell to 6.77%, the lowest since May, as Treasury yields dipped. – High rates and home prices continue to constrain homebuyer activity. – Forecasters expect only modest rate relief through the end of the year.
Mortgage rates have inched lower for a fourth straight week, offering a glimmer of relief for homebuyers, but not enough to spark a major rebound in the housing market. The average 30-year fixed mortgage rate dropped to 6.77% this week, its lowest level since May, down slightly from 6.81% last week, according to data from Freddie Mac. The average rate for a 15-year mortgage also dipped to 5.89% from 5.96%.
This modest decline comes as geopolitical tensions ease and Treasury yields soften. A recent ceasefire between Iran and Israel helped calm global markets, while dovish comments from Federal Reserve officials increased expectations that rate cuts could come as early as July. These factors contributed to a dip in the 10-year Treasury yield, which mortgage rates tend to closely follow.
Though the Federal Reserve has not moved to lower interest rates yet, speculation around future cuts is already influencing mortgage rate behavior. Fed Chair Jerome Powell reiterated during recent congressional testimony that while rate cuts are not imminent, the central bank remains open to adjusting policy if inflation continues to cool or if economic conditions shift.
Despite the recent rate movement, mortgage rates are still hovering near the upper end of a narrow range. Since mid-April, rates have fluctuated within a tight 15-basis-point band, limiting their ability to meaningfully impact housing affordability.
High borrowing costs, coupled with persistently high home prices, have continued to dampen housing activity. While pending home sales rose by 1.8% in May from the previous month, and 1.1% year-over-year, the overall housing market remains subdued. New home sales, in contrast, fell sharply last month, plunging 14% — the steepest monthly drop in three years, highlighting buyer hesitation in the current rate environment.
Mortgage applications for new purchases were essentially flat last week, according to the Mortgage Bankers Association, while refinancing activity saw a modest 3% increase. The latter suggests that some homeowners are finding incentive in even small rate drops to restructure their existing loans, though the overall refinancing market remains a fraction of what it was during the ultra-low rate environment of the pandemic.
Looking ahead, economists expect only gradual improvement. The Mortgage Bankers Association projects rates to close out the year around 6.7%, while Fannie Mae anticipates a slightly more optimistic 6.5%. Either way, most forecasts suggest a slow decline rather than a swift return to significantly lower levels.
For prospective buyers, this means affordability may improve modestly, but major relief remains unlikely in the short term. With inflation, Federal Reserve policy, and global uncertainty still in play, the mortgage market is expected to remain cautious.
Joe Gomes, CFA, Managing Director, Equity Research Analyst, Generalist , Noble Capital Markets, Inc.
Refer to the full report for the price target, fundamental analysis, and rating.
1Q26. Steelcase reported solid results for the first quarter of fiscal 2026. Revenue grew 7% y-o-y to $779 million, towards the upper end of guidance. We had forecast $760 million and the consensus was $762 million. Gross margin of 33.9% was up 170 bp y-o-y and above management’s 33% guide. Steelcase reported net income of $13.6 million, or EPS of $0.11, and adjusted EPS of $0.20, compared to $10.9 million, $0.09, and $0.16, respectively, last year. We were at adjusted EPS of $0.14, while consensus was $0.13.
Quarterly Drivers. The Americas business was up 9%, both on a reported and organic basis, driven by a higher beginning backlog compared to the prior year and included strong growth from large corporate, government, and healthcare customers. International was up 1% on a reported basis but down 1% on an organic basis, driven by declines in Germany and France, mostly offset by growth in India, the UK, and China.
Equity Research is available at no cost to Registered users of Channelchek. Not a Member? Click ‘Join’ to join the Channelchek Community. There is no cost to register, and we never collect credit card information.
This Company Sponsored Research is provided by Noble Capital Markets, Inc., a FINRA and S.E.C. registered broker-dealer (B/D).
*Analyst certification and important disclosures included in the full report. NOTE: investment decisions should not be based upon the content of this research summary. Proper due diligence is required before making any investment decision.
Key Points: – Consumer confidence fell unexpectedly in June, driven by concerns over tariffs and inflation. – Perceptions of the labor market have softened, with fewer respondents viewing jobs as readily available. – Despite rising geopolitical tensions, trade policy and high prices remain the primary concerns for American consumers.
Consumer confidence took an unexpected step back in June, reflecting growing anxieties around tariffs and persistent inflation that continue to shape household sentiment. Despite a brief upswing the previous month, optimism around the economy and job market has moderated as Americans grow more cautious about future conditions.
The Conference Board’s Consumer Confidence Index dipped to 93 in June, a notable decline from 98.4 in May and below economists’ projections. The Expectations Index, which measures consumers’ outlook for income, business, and labor conditions over the next six months, dropped to 69 from 73.6. The sharp decline follows what had been the largest one-month surge in sentiment since the financial crisis recovery in 2009.
Tariffs remained on top of consumers’ minds and were frequently associated with concerns about their negative impacts on the economy and prices. Inflation and high prices were another important concern cited by consumers in June.
Although the administration has delayed several rounds of tariffs in recent weeks, the effective U.S. tariff rate remains significantly elevated. According to estimates from the Yale Budget Lab, the current rate stands at approximately 14.7%—the highest since the Great Depression era in 1938. This has raised the cost of imported goods and weighed on consumer sentiment, especially for lower- and middle-income households who are more sensitive to rising everyday expenses.
Interestingly, geopolitical events, including renewed conflict in the Middle East, were not cited as major factors in consumer sentiment. The survey cutoff occurred amid increasing global tensions, but Guichard noted that topics like international conflict and social unrest “remained much lower on the list of topics affecting consumers’ views.”
Labor market perceptions also softened in June. The share of consumers who said jobs are “plentiful” declined to 29.2%, down from 31.1% the month before. At the same time, 18.1% of respondents said jobs were “hard to get,” nearly unchanged from May. The gap between these two numbers—known as the labor market differential—narrowed to 11.1 percentage points, its lowest level since early 2021 when the economy was emerging from pandemic-era shutdowns.
The cooling in labor sentiment mirrors recent trends in government data. Job openings have declined from earlier in the year, and unemployment claims have risen, suggesting some softening in what had been a resilient job market.
While the recent pullback in confidence does not necessarily signal a recession, it highlights the fragility of sentiment in the face of policy uncertainty and inflationary pressure. As the Federal Reserve continues to weigh interest rate decisions and the White House balances trade policy with economic growth, consumer perceptions will remain a key bellwether for the broader economic outlook.
QuoteMedia is a leading software developer and cloud-based syndicator of financial market information and streaming financial data solutions to media, corporations, online brokerages, and financial services companies. The Company licenses interactive stock research tools such as streaming real-time quotes, market research, news, charting, option chains, filings, corporate financials, insider reports, market indices, portfolio management systems, and data feeds. QuoteMedia provides industry leading market data solutions and financial services for companies such as the Nasdaq Stock Exchange, TMX Group (TSX Stock Exchange), Canadian Securities Exchange (CSE), London Stock Exchange Group, FIS, U.S. Bank, Broadridge Financial Systems, JPMorgan Chase, CI Financial, Canaccord Genuity Corp., Hilltop Securities, HD Vest, Stockhouse, Zacks Investment Research, General Electric, Boeing, Bombardier, Telus International, Business Wire, PR Newswire, FolioFN, Regal Securities, ChoiceTrade, Cetera Financial Group, Dynamic Trend, Inc., Qtrade Financial, CNW Group, IA Private Wealth, Ally Invest, Inc., Suncor, Virtual Brokers, Leede Jones Gable, Firstrade Securities, Charles Schwab, First Financial, Cirano, Equisolve, Stock-Trak, Mergent, Cision, Day Trade Dash and others. Quotestream®, QModTM and Quotestream ConnectTM are trademarks of QuoteMedia. For more information, please visit www.quotemedia.com.
Michael Kupinski, Director of Research, Equity Research Analyst, Digital, Media & Technology , Noble Capital Markets, Inc.
Jacob Mutchler, Research Associate, Noble Capital Markets, Inc.
Refer to the full report for the price target, fundamental analysis, and rating.
Solid Q1 Results. The company reported solid Q1 results, with revenue growing 3% over the prior year period to $4.8 million, marking the highest quarterly revenue in the company’s history. Adj. EBITDA of $0.4 million in Q1 was moderately lower than our estimate of $0.5 million estimate. We believe its business pipeline appears to be improving and should gain momentum throughout the year and into 2026.
Capitalizing less development costs. Notably, the company capitalized less development costs in Q1 than in prior quarters, leading to more development costs expensed in Q1. While this impacted Q1, we believe that margins should improve as the company begins to recognize the revenue from the new business “wins” in future quarters. Furthermore, the company will be expensing development costs at a similar rate to Q1 moving forward.
Equity Research is available at no cost to Registered users of Channelchek. Not a Member? Click ‘Join’ to join the Channelchek Community. There is no cost to register, and we never collect credit card information.
This Company Sponsored Research is provided by Noble Capital Markets, Inc., a FINRA and S.E.C. registered broker-dealer (B/D).
*Analyst certification and important disclosures included in the full report. NOTE: investment decisions should not be based upon the content of this research summary. Proper due diligence is required before making any investment decision.
NEW YORK, June 23, 2025 (GLOBE NEWSWIRE) — Xcel Brands (NASDAQ: XELB), an industry leading media and consumer products company specializing in building influencer-driven brands through social commerce and livestreaming, is proud to announce a groundbreaking new partnership with supermodel, advocate, and founder of Coco Rocha Model Camp, Coco Rocha.
With more than two decades at the highest level of the fashion industry—having graced over 100 magazine covers, been shot by top photographers across the globe, and walked runways for luxury fashion houses ranging from Chanel, Louis Vuitton, John Galliano, Prada and Schiaparelli to Jean Paul Gaultier, Tom Ford, Moschino, and Marc Jacobs—Coco Rocha brings a rare depth of experience and insight to this collaboration. Rocha’s illustrious career has granted her a front-row seat to the inner workings of the world’s most legendary designers. Together, Coco Rocha and Xcel Brands will develop a bold, thoughtfully crafted fashion brand designed for women who lead with both strength and style.
“What excites me about partnering with Xcel is the opportunity to finally channel all of those unbelievable lived experiences into something of my own,” said Rocha. “This isn’t about chasing trends or putting my name on a label—it’s about designing elevated essentials that reflect the life I live now as a mother, businesswoman, and creative.”
This collaboration aims to speak to women seeking pieces that feel as powerful and dynamic as their daily lives. Coco Rocha’s collection will deliver runway-inspired elegance with everyday practicality.
Robert W. D’Loren, Chairman and CEO of Xcel Brands, said, “Coco Rocha is one of the most influential fashion figures of our time. Her perspective, creativity, and commitment to authenticity make her the perfect partner for our next brand launch. We are thrilled to work alongside her in building something empowering and extraordinary.”
This announcement further pushes Xcel’s commitment to redefining modern fashion through innovative partnerships with authentic, visionary creators. For more information, visit www.xcelbrands.com
About Xcel Brands Xcel Brands, Inc. (NASDAQ: XELB) is a media and consumer products company engaged in the design, licensing, marketing, live streaming, and social commerce sales of branded apparel, footwear, accessories, fine jewelry, home goods and other consumer products, and the acquisition of dynamic consumer lifestyle brands. Xcel was founded in 2011 with a vision to reimagine shopping, entertainment, and social media as social commerce. Xcel owns the Halston, Judith Ripka, and C. Wonder brands, as well as the co-branded collaboration brands TowerHill by Christie Brinkley, LB70 by Lloyd Boston, Trust. Respect. Love. by Cesar Millan, and GemmaMade by Gemma Stafford, and also holds noncontrolling interests or long-term license agreements in the Isaac Mizrahi brand, Orme Live and Jenny Martinez Live brands. Xcel also owns and manages the Longaberger brand through its controlling interest in Longaberger Licensing, LLC. Xcel is pioneering a true modern consumer products sales strategy which includes the promotion and sale of products under its brands through interactive television, digital live-stream shopping, social commerce, brick-and-mortar retailers, and e-commerce channels to be everywhere its customers shop. The company’s brands have generated in excess of $5 billion in retail sales via livestreaming in interactive television and digital channels alone and consisting of over 20,000 hours of content production time in live-stream and social commerce. The brand portfolio reaches in excess of 40 million social media followers with broadcast reach into 200 million households. Headquartered in New York City, Xcel Brands is led by an executive team with significant live streaming, production, merchandising, design, marketing, retailing, and licensing experience, and a proven track record of success in elevating branded consumer products companies. For more information, visit www.xcelbrands.com.
About Coco Rocha Coco Rocha is an internationally acclaimed supermodel, entrepreneur, and educator who has redefined the role of a model through two decades of innovation and influence. Named Model of the Year by Elle and Marie Claire, and hailed by Vogue Paris and Vogue Italia as one of the top models of all time, she has graced the runways of every major fashion house and appeared in countless international campaigns and covers.
Widely known as the “Queen of Pose”, Coco is considered one of the most technically proficient and versatile models of her generation. In 2014, she authored Study of Pose, a 2,000-page visual encyclopedia that has become a go-to reference for models and photographers alike. A pioneer in digital influence, Coco was the first high-fashion model to fully embrace social media—amassing millions of followers and earning recognition from Time magazine and TikTok as a leading voice in fashion.
An outspoken advocate for model rights, she played a pivotal role in passing legislation in New York to protect underage models. In 2018, she launched the Coco Rocha Model Camp (CRMC), a first-of-its-kind program offering hands-on modeling training combined with career and business strategy. Nearly 5,000 students have trained under Coco—including Kendall Jenner, Alix Earle, Bryce Dallas Howard, Dixie D’Amelio, Tabria Majors, and more.
She has shared her expertise through guest lectures at Harvard, Brown, and SCAD, and co-founded Nomad MGMT, a boutique modeling agency with offices in three countries. Beyond fashion, Coco is an active investor and advisor to early-stage startups in tech, media, and commerce. She lives in New York with her husband and creative partner, James Conran, and their three children.
Coco Rocha is represented by The Lions Management.
500 5th Avenue 20th Floor New York, NY 10110 United States Sector(s): Consumer Cyclical Industry: Apparel Manufacturing Full Time Employees: 599 Key Executives Name Title Pay Exercised Year Born Mr. Jonathan CEO & Director 825.62k N/A 1958 Ms. Marie Fogel Senior VP and Chief Merchandising & Manufacturing Officer 633.19k N/A 1961 Mr. John Chief Financial Officer
Michael Kupinski, Director of Research, Equity Research Analyst, Digital, Media & Technology , Noble Capital Markets, Inc.
Jacob Mutchler, Research Associate, Noble Capital Markets, Inc.
Refer to the full report for the price target, fundamental analysis, and rating.
Solid Q1 results. the company reported Q1 revenue of $57.9 million and an adj. EBITDA loss of $3.0 million, both of which were better than our estimates of $56.0 million and a loss of $5.5 million, respectively. Notably, while revenue and adj. EBITDA are both modestly lower than the prior year period; we view the Q1 results favorably, given the company’s ability to manage the uncertain tariff outlook.
Tariff mitigation. The company highlighted that it has been taking steps to reduce its exposure to China, currently roughly 60% of its cost of goods sold. Notably, the company is sourcing from other countries and expects that China will be roughly 25% of its cost of goods by the end of 2025. The company has leadership located in the sourcing countries to ensure product quality.
Equity Research is available at no cost to Registered users of Channelchek. Not a Member? Click ‘Join’ to join the Channelchek Community. There is no cost to register, and we never collect credit card information.
This Company Sponsored Research is provided by Noble Capital Markets, Inc., a FINRA and S.E.C. registered broker-dealer (B/D).
*Analyst certification and important disclosures included in the full report. NOTE: investment decisions should not be based upon the content of this research summary. Proper due diligence is required before making any investment decision.
NEW YORK–(BUSINESS WIRE)– Vince Holding Corp. (NYSE: VNCE) (“VNCE” or the “Company”), a global contemporary retailer, today reported its financial results for the first quarter ended May 3, 2025.
Brendan Hoffman, Chief Executive Officer of VNCE said, “I continue to be encouraged by the strong execution and commitment to excellence I see across our organization, and while we are navigating a challenging environment marked by uncertainty, our first quarter performance was relatively in line with our expectations. As an organization, we quickly pivoted all efforts in the latter portion of the quarter to develop and put into action mitigation plans in light of the evolving tariff policies. In short order we have diversified our supply chain, negotiated with vendors, and leveraged other opportunities to mitigate near-term costs. As we look ahead, we will continue these efforts along with providing customers a high quality product offering and an engaging experience across our channels.”
In this press release, the Company is presenting its financial results in conformity with U.S. generally accepted accounting principles (“GAAP”) as well as on an “adjusted” basis. Adjusted results presented in this press release are non-GAAP financial measures. See “Non-GAAP Financial Measures” below for more information about the Company’s use of non-GAAP financial measures and Exhibit 3 and Exhibit 4 to this press release for a reconciliation of GAAP measures to such non-GAAP measures.
For the first quarter ended May 3, 2025:
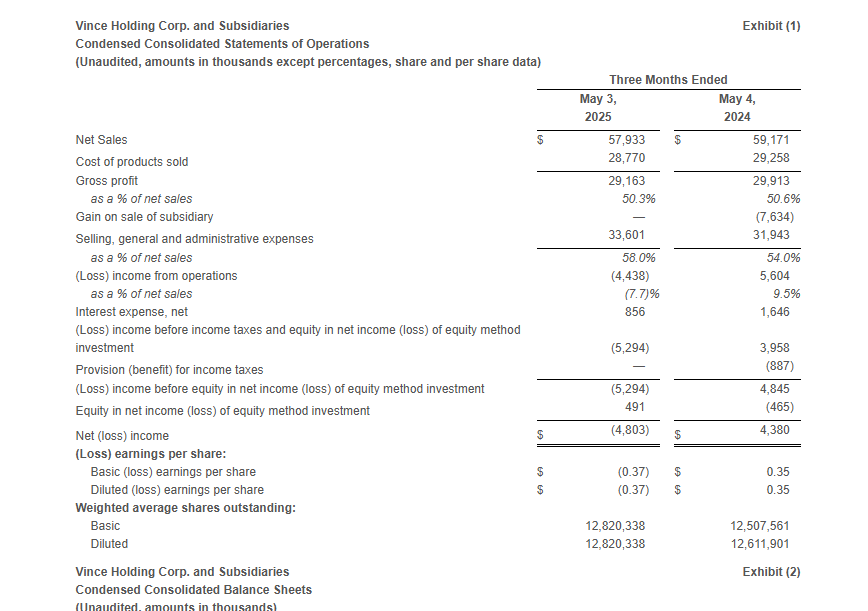
Total Company net sales decreased 2.1% to $57.9 million compared to $59.2 million in the first quarter of fiscal 2024. The year-over-year decline was driven by store closures and remodels which negatively impacted the retail store channel in the direct-to-consumer segment.
Gross profit was $29.2 million, or 50.3% of net sales, compared to gross profit of $29.9 million, or 50.6% of net sales, in the first quarter of fiscal 2024. The decrease in gross margin rate was primarily driven by approximately 260 basis points related to higher freight and duty costs, approximately 120 basis points related to wholesale channel mix, and approximately 60 basis points due to higher distribution and handling costs. These factors were partially offset by approximately 330 basis points related to lower product costs and higher pricing and approximately 80 basis points related to lower promotional activity.
Selling, general, and administrative expenses were $33.6 million, or 58.0% of sales, compared to $31.9 million, or 54.0% of sales, in the first quarter of fiscal 2024. The increase in SG&A dollars was primarily driven by higher marketing and advertising expenses, increased legal, information technology and third-party costs as well as increased expenses related to remodels and relocations.
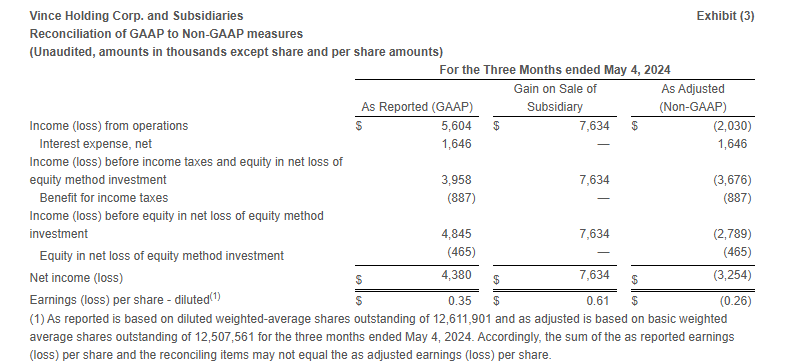
Loss from operations was $4.4 million compared to income from operations of $5.6 million in the same period last year. Excluding the Gain on Sale of Subsidiary (as defined below) in the first quarter of fiscal 2024, Adjusted loss from operations* in the first quarter of fiscal 2024 was $2.0 million.
The income tax provision was $0 for the first quarter of fiscal 2025, as the Company has year-to-date ordinary pre-tax losses for the interim period and is anticipating annual ordinary pre-tax income for the fiscal year. The Company has determined that it is more likely than not that the tax benefit of the year-to-date loss will not be realized in the current or future years and as such, tax provisions for the interim periods should not be recognized until the Company has year-to-date ordinary pre-tax income. The tax provision in the first quarter of fiscal 2025 compares to an income tax benefit of $0.9 million in the same period last year.
Net loss was $4.8 million or $(0.37) per share compared to net income of $4.4 million or $0.35 per share in the same period last year. Excluding the Gain on Sale of Subsidiary, the Adjusted net loss* was $3.3 million or $(0.26) per share in the first quarter of fiscal 2024.
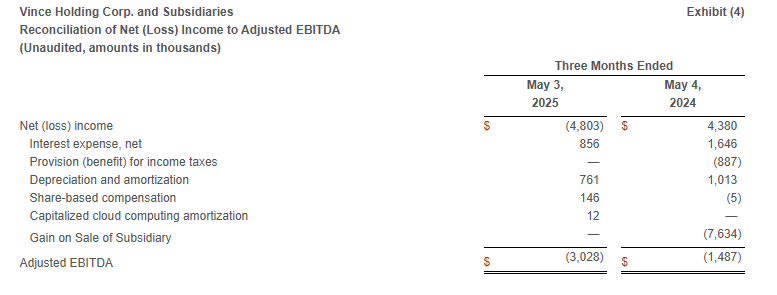
Adjusted EBITDA* was $(3.0) million compared to $(1.5) million in the same period last year.
The Company ended the quarter with 58 company-operated Vince stores, a net decrease of 4 stores since the first quarter of fiscal 2024.
First Quarter Review
Net sales decreased 2.1% to $57.9 million as compared to the first quarter of fiscal 2024.
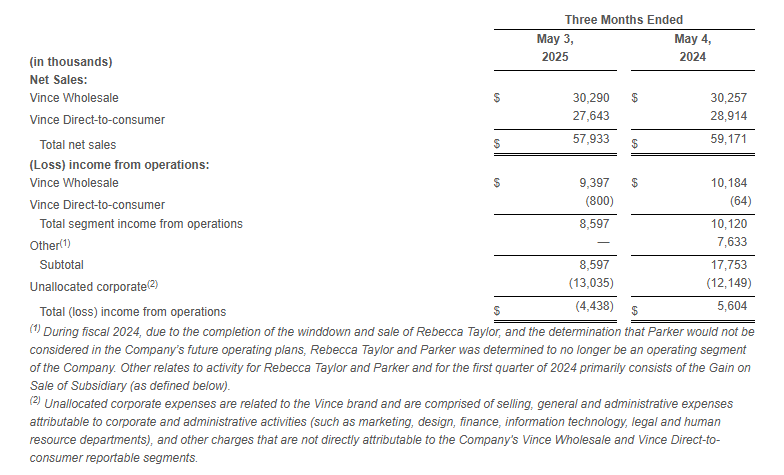
Wholesale segment sales increased 0.1% to $30.3 million compared to the first quarter of fiscal 2024.
Direct-to-consumer segment sales decreased 4.4% to $27.6 million compared to the first quarter of fiscal 2024.
Income from operations relating to our reportable segments, Vince Wholesale and Vince Direct-to-consumer, was $8.6 million compared to income from operations of $10.1 million in the same period last year.
Net Sales and Operating Results by Segment:
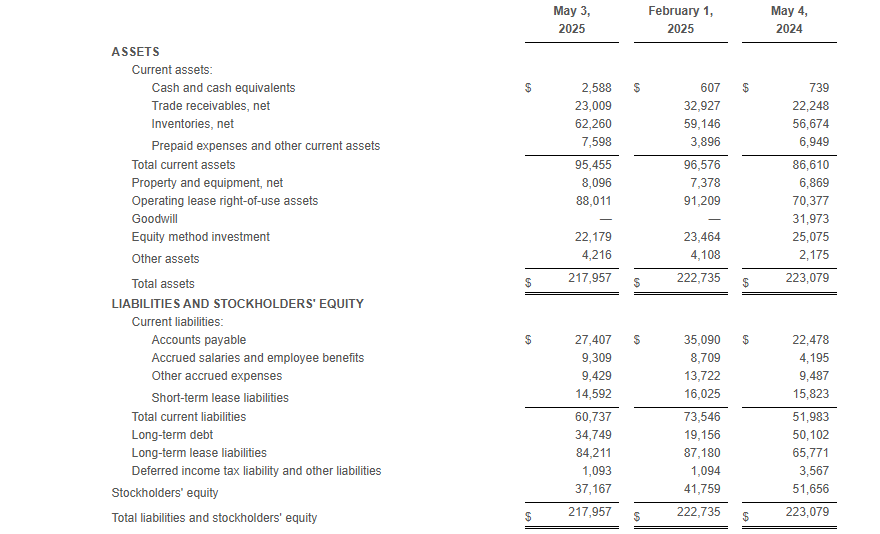
Balance Sheet
At the end of the first quarter of fiscal 2025, total borrowings under the Company’s debt agreements totaled $34.7 million and the Company had $20.4 million of excess availability under its revolving credit facility.
Net inventory at the end of the first quarter of fiscal 2025 was $62.3 million compared to $56.7 million at the end of the first quarter of fiscal 2024.
During the quarter ended May 3, 2025, the Company did not issue shares of common stock under the ATM program. The Company continues to have shares available under the program to exercise with proceeds to be used as sources, along with cash from operations, to fund future growth.
Outlook
For the second quarter of fiscal 2025 the Company expects the following:
Net sales to be approximately flat to down 3% compared to the prior year period.
Operating Income as a percentage of net sales to be approximately (1)% to 1%.
Adjusted EBITDA as a percentage of net sales to be approximately 1% to 4%.
Given the uncertainty related to the potential impact and duration of current tariff policy, the Company is not providing guidance for the full year fiscal 2025.
Strategic Partnership with Authentic Brands Group
On May 25, 2023, the Company announced that it completed the previously announced transaction (the “Authentic Transaction”) with Authentic Brands Group (“Authentic”).
In connection with the Authentic Transaction, VNCE entered into an exclusive, long-term license agreement (the “License Agreement”) with Authentic for usage of the contributed intellectual property for VNCE’s existing business in a manner consistent with the Company’s current wholesale, retail and e-commerce operations. The License Agreement contains an initial ten-year term and eight ten-year renewal options allowing VNCE to renew the agreement.
*Non-GAAP Financial Measures
In addition to reporting financial results in accordance with GAAP, the Company has provided, with respect to the financial results relating to the three months ended May 3, 2025 and May 4, 2024, adjusted EBITDA, which is a non-GAAP measure. Adjusted EBITDA is calculated as earnings before interest, taxes, depreciation and amortization, share-based compensation, capitalized cloud computing amortization, and gain on sale of Rebecca Taylor, Inc. and its wholly owned subsidiary (“Gain on Sale of Subsidiary”). For the three months ended May 4, 2024, the Company has provided adjusted income (loss) from operations, adjusted income (loss) before income taxes and equity in net loss of equity method investment, adjusted income (loss) before equity in net loss of equity method investment, adjusted net income (loss), and adjusted earnings (loss) per share, which are non-GAAP measures, in order to eliminate the effect of the Gain on Sale of Subsidiary.
The Company believes that the presentation of these non-GAAP measures facilitates an understanding of the Company’s continuing operations without the impact associated with the aforementioned items. While these types of events can and do recur periodically, they are excluded from the indicated financial information due to their impact on the comparability of earnings across periods. Non-GAAP financial measures should not be considered in isolation from, or as a substitute for, financial information prepared in accordance with GAAP. A reconciliation of GAAP to non-GAAP results has been provided in Exhibit 3 and Exhibit 4 to this press release.
Conference Call
A conference call to discuss the first quarter results will be held today, June 17, 2025, at 8:30 a.m. ET, hosted by Vince Holding Corp. Chief Executive Officer, Brendan Hoffman, and Chief Financial Officer, Yuji Okumura. During the conference call, the Company may make comments concerning business and financial developments, trends and other business or financial matters. The Company’s comments, as well as other matters discussed during the conference call, may contain or constitute information that has not been previously disclosed.
Those who wish to participate in the call may do so by dialing (833) 470-1428, conference ID 598215. Any interested party will also have the opportunity to access the call via the Internet at http://investors.vince.com/. To listen to the live call, please go to the website at least 15 minutes early to register and download any necessary audio software. For those who cannot listen to the live broadcast, a recording will be available for 12 months after the date of the event. Recordings may be accessed at http://investors.vince.com.
ABOUT VINCE HOLDING CORP.
Vince Holding Corp. is a global retail company that operates the Vince brand women’s and men’s ready to wear business. Vince, established in 2002, is a leading global luxury apparel and accessories brand best known for creating elevated yet understated pieces for every day effortless style. Vince Holding Corp. operates 44 full-price retail stores, 14 outlet stores, and its e-commerce site, as well as through premium wholesale channels globally. Please visit www.vince.com for more information.
Forward-Looking Statements: This document, and any statements incorporated by reference herein contain forward-looking statements under the Private Securities Litigation Reform Act of 1995. Forward-looking statements include the statements under “Outlook” above as well as statements regarding, among other things, our current expectations about possible or assumed future results of operations of the Company and are indicated by words or phrases such as “may,” “will,” “should,” “believe,” “expect,” “seek,” “anticipate,” “intend,” “estimate,” “plan,” “target,” “project,” “forecast,” “envision” and other similar phrases. Although we believe the assumptions and expectations reflected in these forward-looking statements are reasonable, these assumptions and expectations may not prove to be correct and we may not achieve the results or benefits anticipated. These forward-looking statements are not guarantees of actual results, and our actual results may differ materially from those suggested in the forward-looking statements. These forward-looking statements involve a number of risks and uncertainties, some of which are beyond our control, including, without limitation: changes to and unpredictability in the trade policies and tariffs imposed by the U.S. and the governments of other nations; our ability to maintain adequate cash flow from operations or availability under our revolving credit facility to meet our liquidity needs; general economic conditions; restrictions on our operations under our credit facilities; our ability to improve our profitability; our ability to maintain our larger wholesale partners; our ability to accurately forecast customer demand for our products; our ability to maintain the license agreement with ABG Vince, a subsidiary of Authentic Brands Group; ABG Vince’s expansion of the Vince brand into other categories and territories; ABG Vince’s approval rights and other actions; our ability to realize the benefits of our strategic initiatives; the execution of our customer strategy; our ability to make lease payments when due; our ability to open retail stores under favorable lease terms and operate and maintain new and existing retail stores successfully; our operating experience and brand recognition in international markets; our ability to remediate the identified material weakness in our internal control over financial reporting; our ability to comply with domestic and international laws, regulations and orders; increased scrutiny regarding our approach to sustainability matters and environmental, social and governance practices; competition in the apparel and fashion industry; the transition associated with the appointment of new chief executive officer and new chief financial officer; our ability to attract and retain key personnel; seasonal and quarterly variations in our revenue and income; the protection and enforcement of intellectual property rights relating to the Vince brand; our ability to successfully conclude remaining matters following the wind down of the Rebecca Taylor business; the extent of our foreign sourcing; our reliance on independent manufacturers; our ability to ensure the proper operation of the distribution facilities by third-party logistics providers; fluctuations in the price, availability and quality of raw materials; the ethical business and compliance practices of our independent manufacturers; our ability to mitigate system or data security issues, such as cyber or malware attacks, as well as other major system failures; our ability to adopt, optimize and improve our information technology systems, processes and functions; our ability to comply with privacy-related obligations; our ability to submit a required business plan and regain compliance with the New York Stock Exchange (the “NYSE”) Listed Company Manual and maintain a listing of our common stock on the NYSE; our status as a “controlled company”; our status as a “smaller reporting company”; and other factors as set forth from time to time in our Securities and Exchange Commission filings, including those described under “Item 1A—Risk Factors” in our Annual Report on Form 10-K and Quarterly Reports on Form 10-Q. We intend these forward-looking statements to speak only as of the time of this release and do not undertake to update or revise them as more information becomes available, except as required by law.