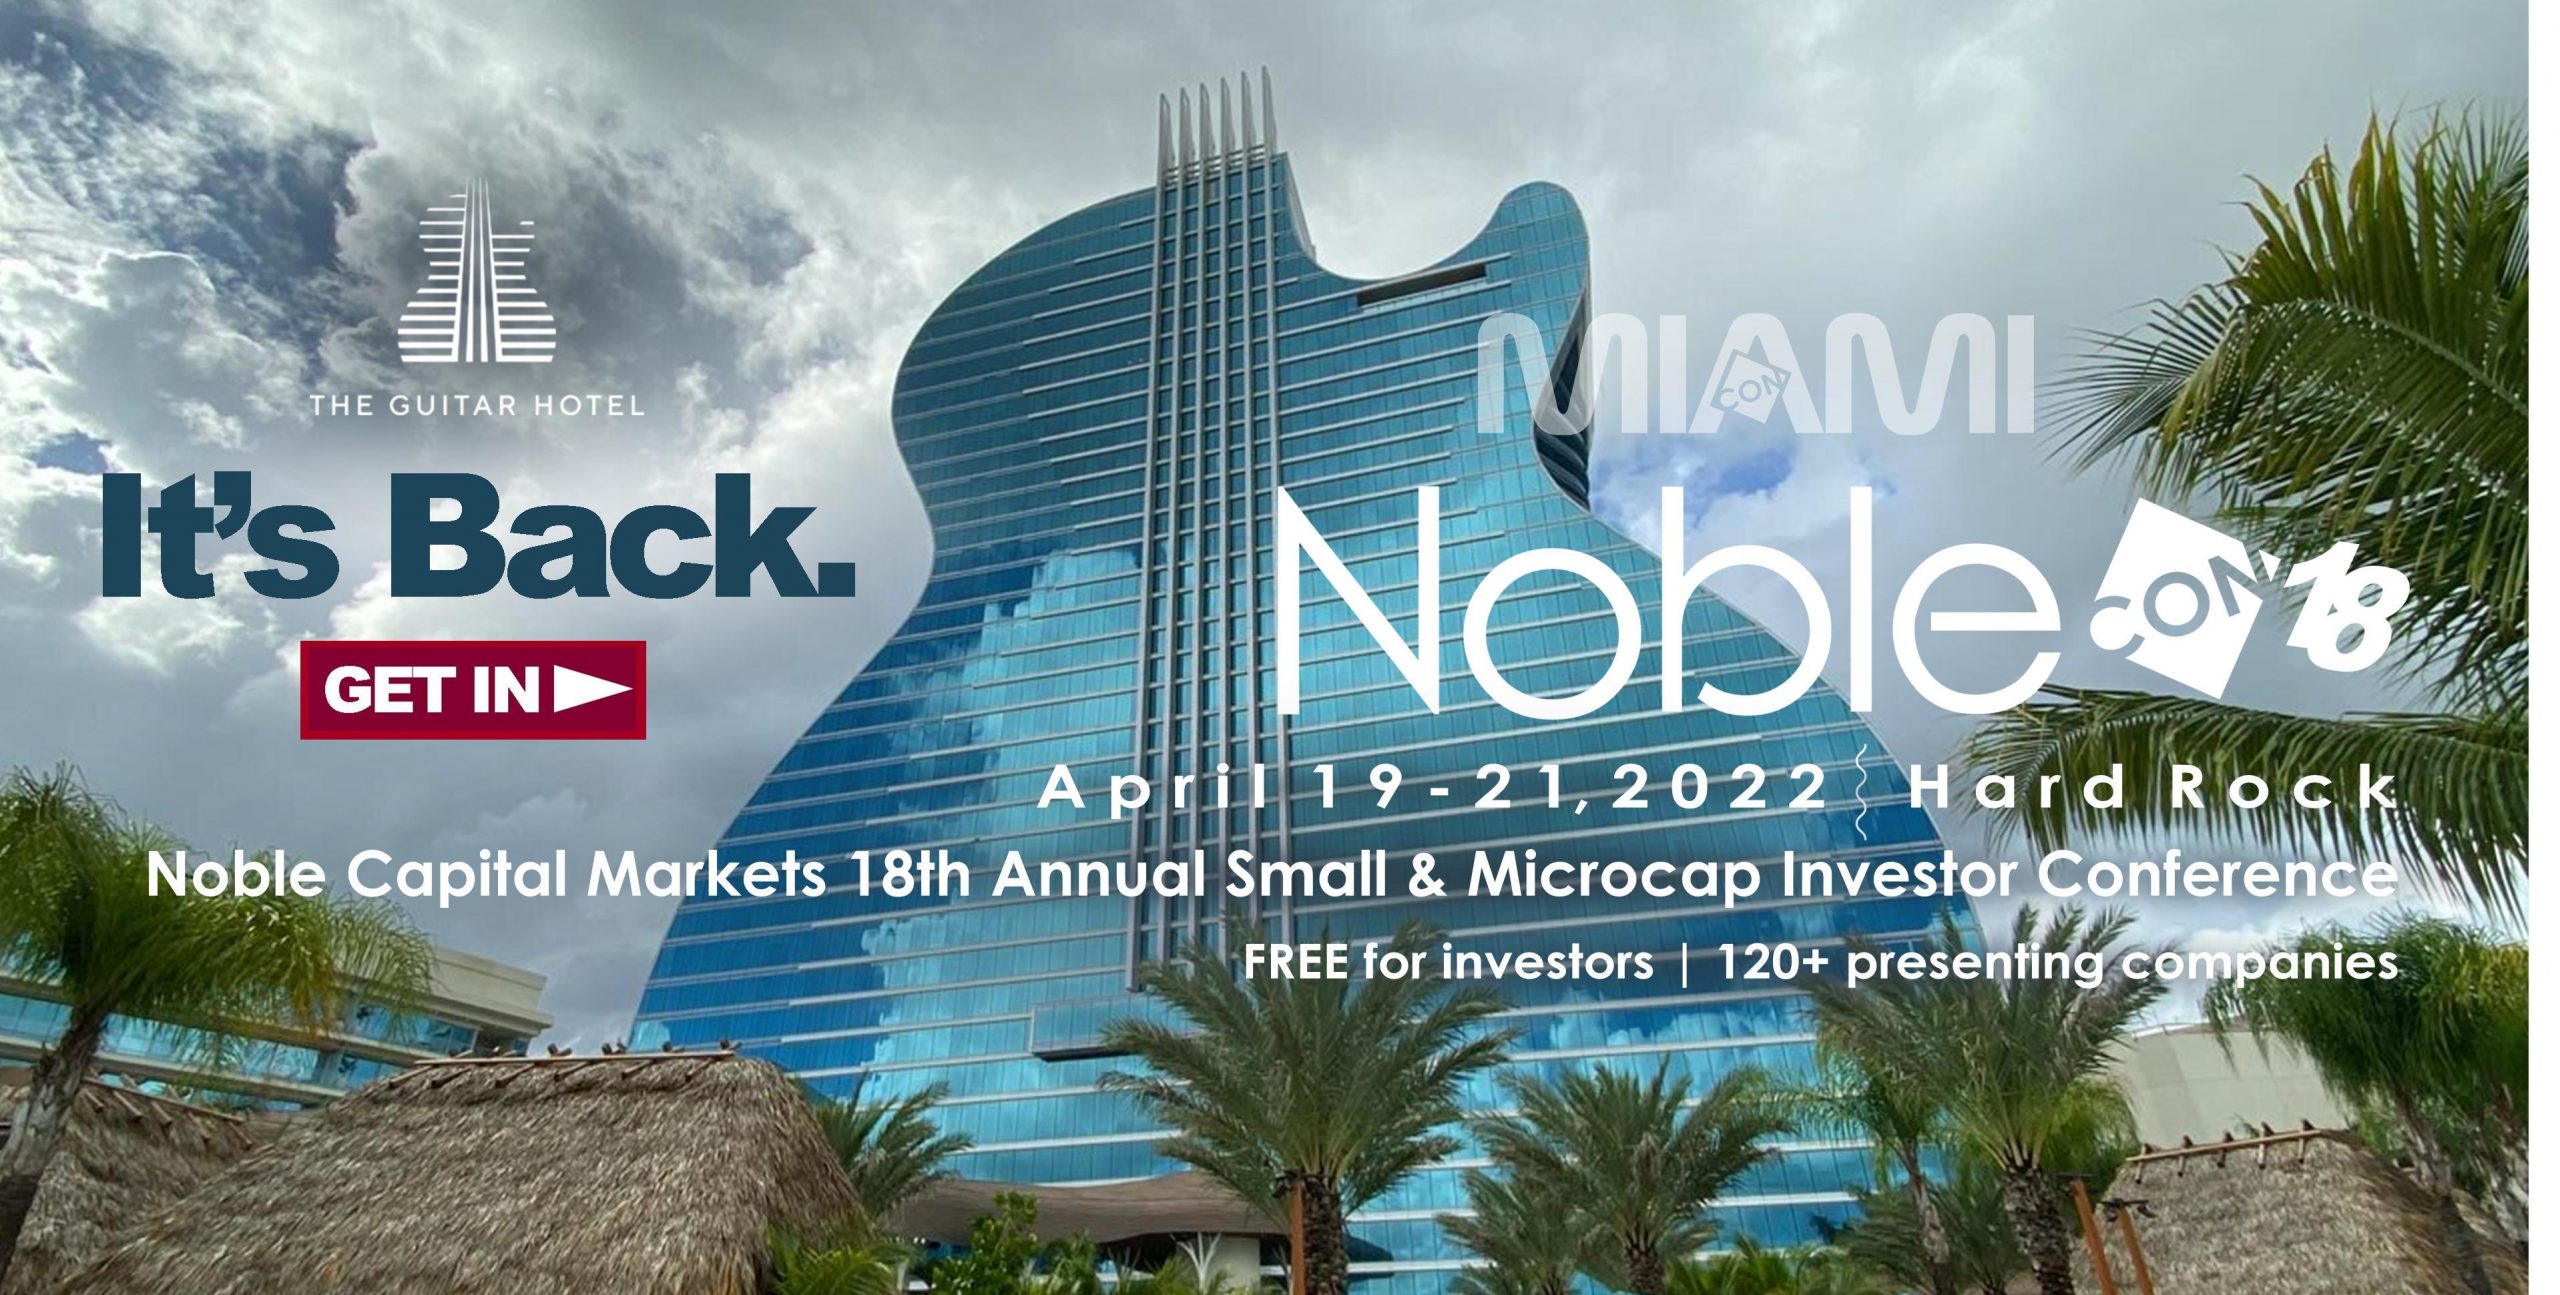
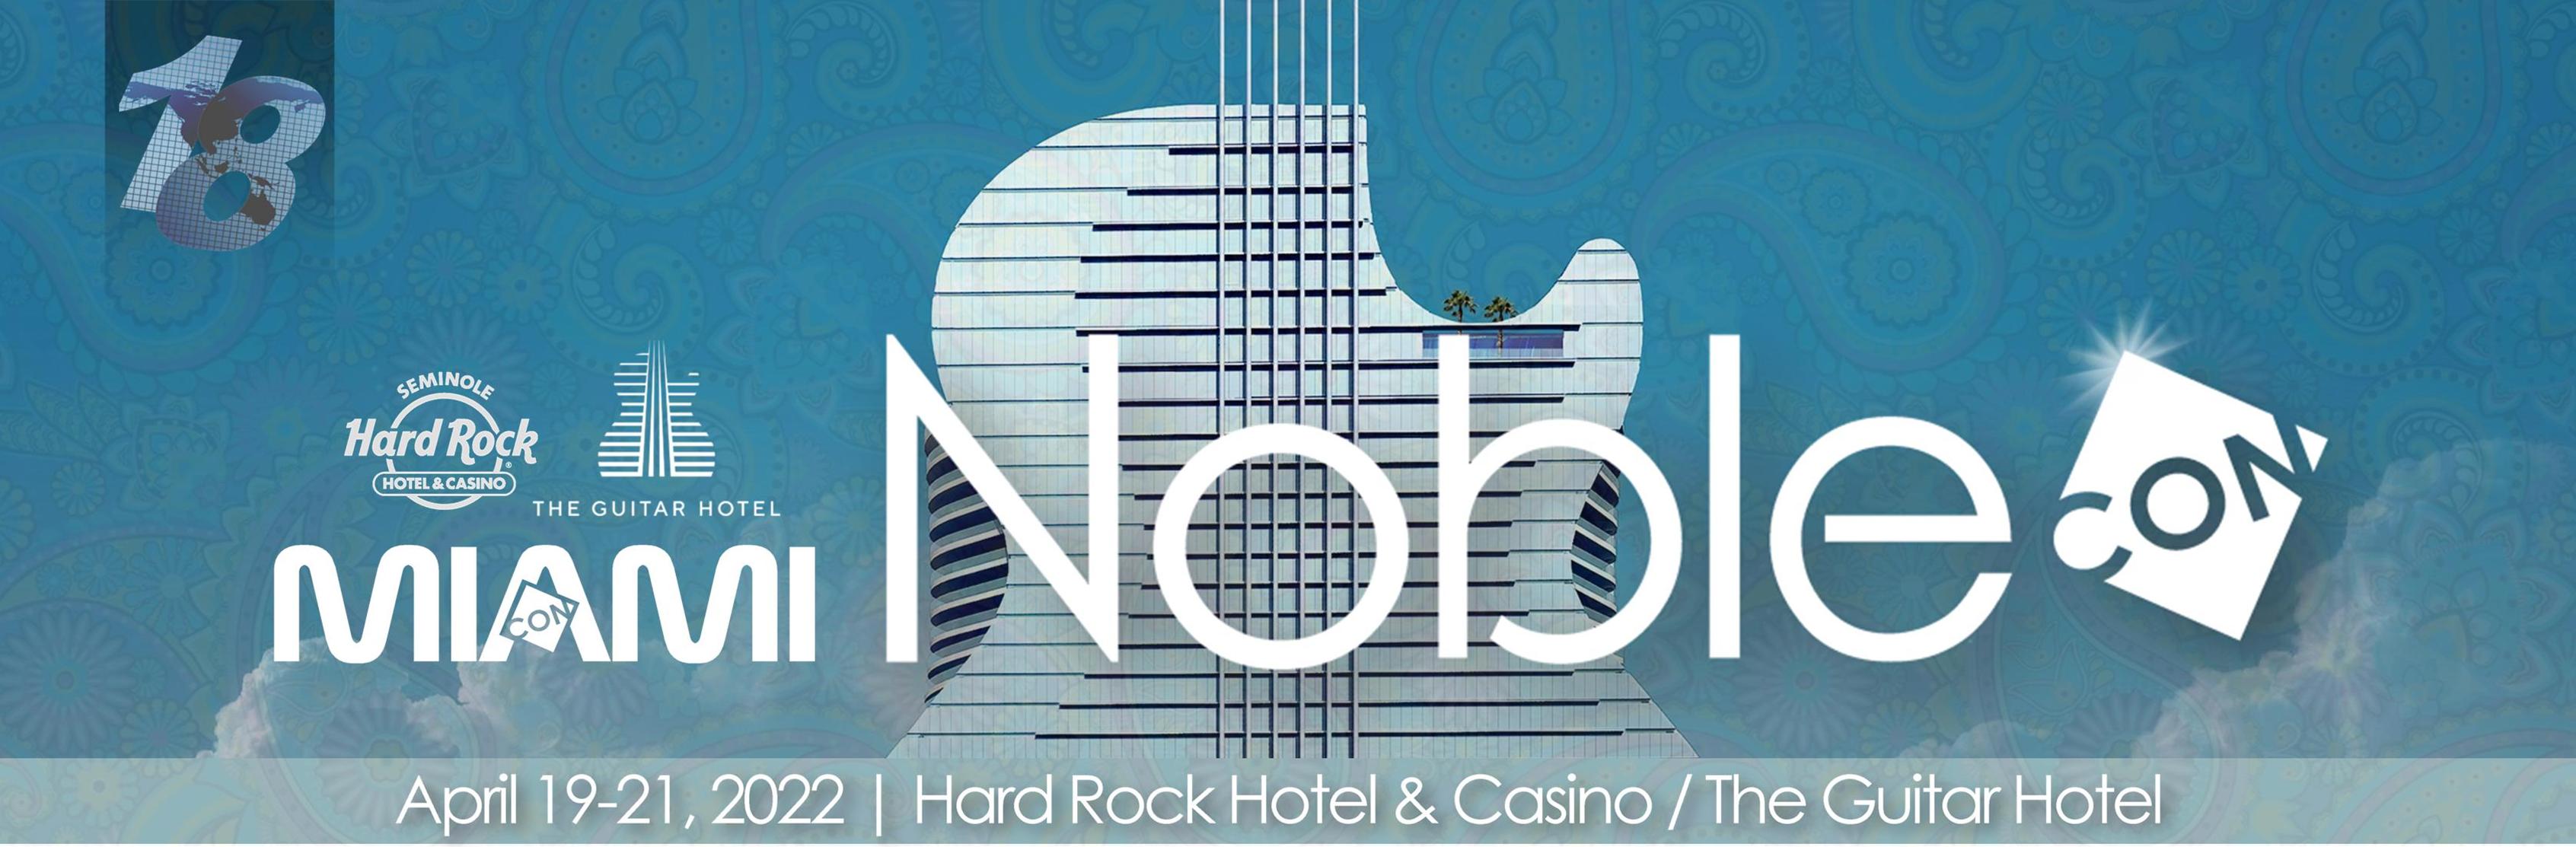
CoreCivic Announces Proposed Tack-On Offering of $100 Million of 8.25% Senior Notes Due 2026


CoreCivic Announces Proposed Tack-On Offering of $100 Million of 8.25% Senior Notes Due 2026


BRENTWOOD, Tenn., Sept. 22, 2021 (GLOBE NEWSWIRE) — CoreCivic, Inc. (NYSE: CXW) (the Company) announced today that it intends to offer an additional $100,000,000 aggregate principal amount of its 8.25% senior unsecured notes due 2026 (the “Additional Notes”), subject to market and other customary conditions. CoreCivic’s previously issued $450 million aggregate principal amount of 8.25% senior unsecured notes due 2026 (the “Existing Notes”) and the Additional Notes will constitute a single class of securities. The Additional Notes will be senior unsecured obligations of CoreCivic and will be guaranteed on a senior unsecured basis by all of CoreCivic’s subsidiaries that guarantee its senior secured credit facilities, the Existing Notes and its other indebtedness. CoreCivic intends to use the net proceeds from the offering of the Additional Notes for general corporate purposes, which may include purchasing CoreCivic’s existing $174.0 million principal amount of 4.625% senior notes due 2023 and CoreCivic’s existing $250.0 million principal amount of 4.75% senior notes due 2027 in open market or privately negotiated transactions, and/or repayment of amounts outstanding under CoreCivic’s revolving credit facility, Term Loan A or Term Loan B. To the extent CoreCivic repays amounts outstanding under its revolving credit facility, such amounts may be reborrowed. There can be no assurance that the offering of the Additional Notes will be consummated.

Imperial Capital is acting as left lead underwriter, StoneX Financial Inc. is acting as joint lead arranger, and Wedbush Securities Inc. is acting as co-manager for the offering.

The Additional Notes are being offered pursuant to CoreCivic’s effective shelf registration statement on Form S-3ASR, which became effective upon filing with the Securities and Exchange Commission on April 6, 2021. A preliminary prospectus supplement describing the terms of the offering has been filed with the Securities and Exchange Commission and is available at www.sec.gov. The offering may be made only by means of a prospectus supplement and the accompanying prospectus. Copies of the preliminary prospectus supplement and accompanying prospectus relating to this offering may be obtained at Imperial Capital, LLC, 10100 Santa Monica Boulevard, Suite 2400, Los Angeles, CA 90067, Attn: Prospectus Department, or by telephone at (310) 246-3700.

This press release is neither an offer to sell nor a solicitation of an offer to buy any securities, nor shall there be any offer, solicitation or sale in any jurisdiction in which such offer, solicitation or sale would be unlawful.

This press release includes forward-looking statements regarding CoreCivic’s intention to issue the Additional Notes and its intended use of the net proceeds from the issuance of the Additional Notes. These forward-looking statements may be affected by risks and uncertainties in CoreCivic’s business and market conditions. This information is qualified in its entirety by cautionary statements and risk factor disclosures contained in CoreCivic’s Securities and Exchange Commission filings, including CoreCivic’s annual report on Form 10-K, quarterly reports on Form 10-Q and current reports on Form 8-K, as well as the risks identified in the preliminary prospectus supplement and the accompanying prospectus relating to the offering. CoreCivic wishes to caution readers that certain important factors may have affected and could in the future affect CoreCivic’s actual results and could cause CoreCivic’s actual results for subsequent periods to differ materially from those expressed in any forward-looking statement made by or on behalf of CoreCivic, including the risk that the offering of the Additional Notes cannot be successfully completed. CoreCivic undertakes no obligation to update forward-looking statements to reflect events or circumstances after the date hereof.

About CoreCivic

CoreCivic is a diversified government solutions company with the scale and experience needed to solve tough government challenges in flexible, cost-effective ways. CoreCivic provides a broad range of solutions to government partners that serve the public good through corrections and detention management, a network of residential reentry centers to help address America’s recidivism crisis, and government real estate solutions. CoreCivic is the nation’s largest owner of partnership correctional, detention and residential reentry facilities, and believes it is the largest private owner of real estate used by government agencies in the U.S. CoreCivic has been a flexible and dependable partner for government for more than 35 years. CoreCivic’s employees are driven by a deep sense of service, high standards of professionalism and a responsibility to help government better the public good.

Contact:    Investors: Cameron Hopewell – Managing Director, Investor Relations – (615) 263-3024
Media: Steve Owen – Vice President, Communications – (615) 263-3107

Release – CoreCivic Enters Into New Lease Agreement with the State of New Mexico at the Northwest New Mexico Correctional Center


CoreCivic Enters Into New Lease Agreement with the State of New Mexico at the Northwest New Mexico Correctional Center


BRENTWOOD, Tenn., Sept. 21, 2021 (GLOBE NEWSWIRE) — CoreCivic, Inc. (NYSE: CXW) (the Company) announced today that it has entered into a new three-year lease agreement with the State of New Mexico at the Company’s 596-bed Northwest New Mexico Correctional Center. CoreCivic currently operates the Northwest New Mexico Correctional Center under a contract with New Mexico and will transition facility operations to the New Mexico Corrections Department when the new lease agreement commences on November 1, 2021. CoreCivic will retain responsibility for facility maintenance throughout the term of the lease. The new lease agreement includes automatic extension options that could extend the term of the lease through October 31, 2041.

Damon T. Hininger, CoreCivic’s President and Chief Executive Officer, said, “We are pleased to have successfully responded to the shifting needs of our government partners in New Mexico, which will allow them to continue to utilize our Northwest New Mexico Correctional Center while the New Mexico Corrections Department directly provides facility-level operations. Under the new agreement, the state will maintain access to critical capacity, we will generate fixed monthly payments under the lease, and our facility employees will be provided the opportunity to retain employment at the facility with the New Mexico Corrections Department. Including this new agreement, we lease five correctional facilities to five different states through our Properties segment. We believe solutions like this provide our government partners with increased flexibility and value.”

The average annual rent for the initial three-year lease term is $3.2 million, including annual rent of $4.2 million in the second and third years of the lease, with annual escalators thereafter. For the six months ended June 30, 2021, the Northwest New Mexico Correctional Center generated revenue of $5.3 million and incurred a facility net operating loss of $1.3 million.

About CoreCivic

CoreCivic is a diversified government solutions company with the scale and experience needed to solve tough government challenges in flexible, cost-effective ways. CoreCivic provides a broad range of solutions to government partners that serve the public good through corrections and detention management, a network of residential reentry centers to help address America’s recidivism crisis, and government real estate solutions. CoreCivic is the nation’s largest owner of partnership correctional, detention and residential reentry facilities, and believes it is the largest private owner of real estate used by government agencies in the U.S. CoreCivic has been a flexible and dependable partner for government for more than 35 years. CoreCivic’s employees are driven by a deep sense of service, high standards of professionalism and a responsibility to help government better the public good.

Forward-Looking Statements

This press release contains statements as to our beliefs and expectations of the outcome of future events that are “forward-looking” statements within the meaning of Section 21E of the Securities Exchange Act of 1934, as amended, and the Private Securities Litigation Reform Act of 1995. These forward-looking statements are subject to risks and uncertainties that could cause actual results to differ materially from the statements made. These include, but are not limited to, the risks and uncertainties associated with: (i) changes in government policy (including the United States Department of Justice, or DOJ, not renewing contracts as a result of President Biden’s Executive Order on Reforming Our Incarceration System to Eliminate the Use of Privately Operated Criminal Detention Facilities) (two agencies of the DOJ, the United States Federal Bureau of Prisons and the United States Marshals Service, utilize our services), legislation and regulations that affect utilization of the private sector for corrections, detention, and residential reentry services, in general, or our business, in particular, including, but not limited to, the continued utilization of our correctional and detention facilities by the federal government, and the impact of any changes to immigration reform and sentencing laws (we do not, under longstanding policy, lobby for or against policies or legislation that would determine the basis for, or duration of, an individual’s incarceration or detention); (ii) our ability to obtain and maintain correctional, detention, and residential reentry facility management contracts because of reasons including, but not limited to, sufficient governmental appropriations, contract compliance, negative publicity and effects of inmate disturbances; (iii) changes in the privatization of the corrections and detention industry, the acceptance of our services, the timing of the opening of new facilities and the commencement of new management contracts (including the extent and pace at which new contracts are utilized), as well as our ability to utilize available beds; (iv) general economic and market conditions, including, but not limited to, the impact governmental budgets can have on our contract renewals and renegotiations, per diem rates, and occupancy; (v) fluctuations in our operating results because of, among other things, changes in occupancy levels, competition, contract renegotiations or terminations, increases in costs of operations, fluctuations in interest rates and risks of operations; (vi) the duration of the federal government’s denial of entry at the United States southern border to asylum-seekers and anyone crossing the southern border without proper documentation or authority in an effort to contain the spread of COVID-19; (vii) government and staff responses to staff or residents testing positive for COVID-19 within public and private correctional, detention and reentry facilities, including the facilities we operate; (viii) restrictions associated with COVID-19 that disrupt the criminal justice system, along with government policies on prosecutions and newly ordered legal restrictions that affect the number of people placed in correctional, detention, and reentry facilities, including those associated with a resurgence of COVID-19; (ix) whether revoking our real estate investment trust, or REIT, election, effective January 1, 2021, and our revised capital allocation strategy can be implemented in a cost effective manner that provides the expected benefits, including facilitating our planned debt reduction initiative and planned return of capital to shareholders; (x) our ability to successfully identify and consummate future development and acquisition opportunities and our ability to successfully integrate the operations of our completed acquisitions and realize projected returns resulting therefrom; (xi) our ability, following our revocation of our REIT election, to identify and initiate service opportunities that were unavailable under the REIT structure; (xii) our ability to have met and maintained qualification for taxation as a REIT for the years we elected REIT status; and (xiii) the availability of debt and equity financing on terms that are favorable to us, or at all. Other factors that could cause operating and financial results to differ are described in the filings we make from time to time with the Securities and Exchange Commission.

CoreCivic takes no responsibility for updating the information contained in this press release following the date hereof to reflect events or circumstances occurring after the date hereof or the occurrence of unanticipated events or for any changes or modifications made to this press release or the information contained herein by any third-parties, including, but not limited to, any wire or internet services.

Contact: Investors: Cameron Hopewell – Managing Director, Investor Relations – (615) 263-3024
Media: Steve Owen – Vice President, Communications – (615) 263-3107

CoreCivic Enters Into New Lease Agreement with the State of New Mexico at the Northwest New Mexico Correctional Center


CoreCivic Enters Into New Lease Agreement with the State of New Mexico at the Northwest New Mexico Correctional Center


BRENTWOOD, Tenn., Sept. 21, 2021 (GLOBE NEWSWIRE) — CoreCivic, Inc. (NYSE: CXW) (the Company) announced today that it has entered into a new three-year lease agreement with the State of New Mexico at the Company’s 596-bed Northwest New Mexico Correctional Center. CoreCivic currently operates the Northwest New Mexico Correctional Center under a contract with New Mexico and will transition facility operations to the New Mexico Corrections Department when the new lease agreement commences on November 1, 2021. CoreCivic will retain responsibility for facility maintenance throughout the term of the lease. The new lease agreement includes automatic extension options that could extend the term of the lease through October 31, 2041.

Damon T. Hininger, CoreCivic’s President and Chief Executive Officer, said, “We are pleased to have successfully responded to the shifting needs of our government partners in New Mexico, which will allow them to continue to utilize our Northwest New Mexico Correctional Center while the New Mexico Corrections Department directly provides facility-level operations. Under the new agreement, the state will maintain access to critical capacity, we will generate fixed monthly payments under the lease, and our facility employees will be provided the opportunity to retain employment at the facility with the New Mexico Corrections Department. Including this new agreement, we lease five correctional facilities to five different states through our Properties segment. We believe solutions like this provide our government partners with increased flexibility and value.”

The average annual rent for the initial three-year lease term is $3.2 million, including annual rent of $4.2 million in the second and third years of the lease, with annual escalators thereafter. For the six months ended June 30, 2021, the Northwest New Mexico Correctional Center generated revenue of $5.3 million and incurred a facility net operating loss of $1.3 million.

About CoreCivic

CoreCivic is a diversified government solutions company with the scale and experience needed to solve tough government challenges in flexible, cost-effective ways. CoreCivic provides a broad range of solutions to government partners that serve the public good through corrections and detention management, a network of residential reentry centers to help address America’s recidivism crisis, and government real estate solutions. CoreCivic is the nation’s largest owner of partnership correctional, detention and residential reentry facilities, and believes it is the largest private owner of real estate used by government agencies in the U.S. CoreCivic has been a flexible and dependable partner for government for more than 35 years. CoreCivic’s employees are driven by a deep sense of service, high standards of professionalism and a responsibility to help government better the public good.

Forward-Looking Statements

This press release contains statements as to our beliefs and expectations of the outcome of future events that are “forward-looking” statements within the meaning of Section 21E of the Securities Exchange Act of 1934, as amended, and the Private Securities Litigation Reform Act of 1995. These forward-looking statements are subject to risks and uncertainties that could cause actual results to differ materially from the statements made. These include, but are not limited to, the risks and uncertainties associated with: (i) changes in government policy (including the United States Department of Justice, or DOJ, not renewing contracts as a result of President Biden’s Executive Order on Reforming Our Incarceration System to Eliminate the Use of Privately Operated Criminal Detention Facilities) (two agencies of the DOJ, the United States Federal Bureau of Prisons and the United States Marshals Service, utilize our services), legislation and regulations that affect utilization of the private sector for corrections, detention, and residential reentry services, in general, or our business, in particular, including, but not limited to, the continued utilization of our correctional and detention facilities by the federal government, and the impact of any changes to immigration reform and sentencing laws (we do not, under longstanding policy, lobby for or against policies or legislation that would determine the basis for, or duration of, an individual’s incarceration or detention); (ii) our ability to obtain and maintain correctional, detention, and residential reentry facility management contracts because of reasons including, but not limited to, sufficient governmental appropriations, contract compliance, negative publicity and effects of inmate disturbances; (iii) changes in the privatization of the corrections and detention industry, the acceptance of our services, the timing of the opening of new facilities and the commencement of new management contracts (including the extent and pace at which new contracts are utilized), as well as our ability to utilize available beds; (iv) general economic and market conditions, including, but not limited to, the impact governmental budgets can have on our contract renewals and renegotiations, per diem rates, and occupancy; (v) fluctuations in our operating results because of, among other things, changes in occupancy levels, competition, contract renegotiations or terminations, increases in costs of operations, fluctuations in interest rates and risks of operations; (vi) the duration of the federal government’s denial of entry at the United States southern border to asylum-seekers and anyone crossing the southern border without proper documentation or authority in an effort to contain the spread of COVID-19; (vii) government and staff responses to staff or residents testing positive for COVID-19 within public and private correctional, detention and reentry facilities, including the facilities we operate; (viii) restrictions associated with COVID-19 that disrupt the criminal justice system, along with government policies on prosecutions and newly ordered legal restrictions that affect the number of people placed in correctional, detention, and reentry facilities, including those associated with a resurgence of COVID-19; (ix) whether revoking our real estate investment trust, or REIT, election, effective January 1, 2021, and our revised capital allocation strategy can be implemented in a cost effective manner that provides the expected benefits, including facilitating our planned debt reduction initiative and planned return of capital to shareholders; (x) our ability to successfully identify and consummate future development and acquisition opportunities and our ability to successfully integrate the operations of our completed acquisitions and realize projected returns resulting therefrom; (xi) our ability, following our revocation of our REIT election, to identify and initiate service opportunities that were unavailable under the REIT structure; (xii) our ability to have met and maintained qualification for taxation as a REIT for the years we elected REIT status; and (xiii) the availability of debt and equity financing on terms that are favorable to us, or at all. Other factors that could cause operating and financial results to differ are described in the filings we make from time to time with the Securities and Exchange Commission.

CoreCivic takes no responsibility for updating the information contained in this press release following the date hereof to reflect events or circumstances occurring after the date hereof or the occurrence of unanticipated events or for any changes or modifications made to this press release or the information contained herein by any third-parties, including, but not limited to, any wire or internet services.

Contact: Investors: Cameron Hopewell – Managing Director, Investor Relations – (615) 263-3024
Media: Steve Owen – Vice President, Communications – (615) 263-3107

Release – CoreCivic Provides Update on U.S. Marshals Service Contract for the West Tennessee Detention Facility


CoreCivic Provides Update on U.S. Marshals Service Contract for the West Tennessee Detention Facility


BRENTWOOD, Tenn., Sept. 17, 2021 (GLOBE NEWSWIRE) — As has been previously disclosed, CoreCivic, Inc. (NYSE: CXW) (the Company) has a direct contract with the U.S. Marshals Service (USMS) at the 600-bed West Tennessee Detention Facility in Mason, Tennessee that is scheduled to expire on September 30, 2021. The Company recently was provided with a definitive inmate population ramp down plan from the USMS indicating that all inmates will be transferred out of the facility by September 30, 2021. As a result, the Company does not expect the USMS to exercise its renewal option under the existing contract.

The Company has been actively marketing the facility to other government agencies, and in August 2021, the Company submitted a formal response to a government agency’s request for proposal to utilize the West Tennessee Detention Facility. However, the Company can provide no assurances that it will be successful in entering into a new contract with the government agency.

The revenue generated from the USMS at the West Tennessee Detention Facility for the year ended December 31, 2020, and six months ended June 30, 2021, was $18.4 million and $10.2 million, respectively. For the year ended December 31, 2020, the facility incurred a $1.4 million net operating loss, and for the six months ended June 30, 2021, the facility generated net operating income of $0.8 million.

About CoreCivic

CoreCivic is a diversified government solutions company with the scale and experience needed to solve tough government challenges in flexible, cost-effective ways. CoreCivic provides a broad range of solutions to government partners that serve the public good through corrections and detention management, a network of residential reentry centers to help address America’s recidivism crisis, and government real estate solutions. CoreCivic is the nation’s largest owner of partnership correctional, detention and residential reentry facilities, and believes it is the largest private owner of real estate used by government agencies in the U.S. CoreCivic has been a flexible and dependable partner for government for more than 35 years. CoreCivic’s employees are driven by a deep sense of service, high standards of professionalism and a responsibility to help government better the public good.

Forward-Looking Statements

This press release contains statements as to our beliefs and expectations of the outcome of future events that are “forward-looking” statements within the meaning of Section 21E of the Securities Exchange Act of 1934, as amended, and the Private Securities Litigation Reform Act of 1995. These forward-looking statements are subject to risks and uncertainties that could cause actual results to differ materially from the statements made. These include, but are not limited to, the risks and uncertainties associated with: (i) changes in government policy (including the United States Department of Justice, or DOJ, not renewing contracts as a result of President Biden’s Executive Order on Reforming Our Incarceration System to Eliminate the Use of Privately Operated Criminal Detention Facilities) (two agencies of the DOJ, the United States Federal Bureau of Prisons and the United States Marshals Service, utilize our services), legislation and regulations that affect utilization of the private sector for corrections, detention, and residential reentry services, in general, or our business, in particular, including, but not limited to, the continued utilization of our correctional and detention facilities by the federal government, and the impact of any changes to immigration reform and sentencing laws (we do not, under longstanding policy, lobby for or against policies or legislation that would determine the basis for, or duration of, an individual’s incarceration or detention); (ii) our ability to obtain and maintain correctional, detention, and residential reentry facility management contracts because of reasons including, but not limited to, sufficient governmental appropriations, contract compliance, negative publicity and effects of inmate disturbances; (iii) changes in the privatization of the corrections and detention industry, the acceptance of our services, the timing of the opening of new facilities and the commencement of new management contracts (including the extent and pace at which new contracts are utilized), as well as our ability to utilize available beds; (iv) general economic and market conditions, including, but not limited to, the impact governmental budgets can have on our contract renewals and renegotiations, per diem rates, and occupancy; (v) fluctuations in our operating results because of, among other things, changes in occupancy levels, competition, contract renegotiations or terminations, increases in costs of operations, fluctuations in interest rates and risks of operations; (vi) the duration of the federal government’s denial of entry at the United States southern border to asylum-seekers and anyone crossing the southern border without proper documentation or authority in an effort to contain the spread of COVID-19; (vii) government and staff responses to staff or residents testing positive for COVID-19 within public and private correctional, detention and reentry facilities, including the facilities we operate; (viii) restrictions associated with COVID-19 that disrupt the criminal justice system, along with government policies on prosecutions and newly ordered legal restrictions that affect the number of people placed in correctional, detention, and reentry facilities, including those associated with a resurgence of COVID-19; (ix) whether revoking our real estate investment trust, or REIT, election, effective January 1, 2021, and our revised capital allocation strategy can be implemented in a cost effective manner that provides the expected benefits, including facilitating our planned debt reduction initiative and planned return of capital to shareholders; (x) our ability to successfully identify and consummate future development and acquisition opportunities and our ability to successfully integrate the operations of our completed acquisitions and realize projected returns resulting therefrom; (xi) our ability, following our revocation of our REIT election, to identify and initiate service opportunities that were unavailable under the REIT structure; (xii) our ability to have met and maintained qualification for taxation as a REIT for the years we elected REIT status; and (xiii) the availability of debt and equity financing on terms that are favorable to us, or at all. Other factors that could cause operating and financial results to differ are described in the filings we make from time to time with the Securities and Exchange Commission.

CoreCivic takes no responsibility for updating the information contained in this press release following the date hereof to reflect events or circumstances occurring after the date hereof or the occurrence of unanticipated events or for any changes or modifications made to this press release or the information contained herein by any third-parties, including, but not limited to, any wire or internet services.

Contact:    Investors: Cameron Hopewell – Managing Director, Investor Relations – (615) 263-3024
Media: Steve Owen – Vice President, Communications – (615) 263-3107

CoreCivic Provides Update on U.S. Marshals Service Contract for the West Tennessee Detention Facility


CoreCivic Provides Update on U.S. Marshals Service Contract for the West Tennessee Detention Facility


BRENTWOOD, Tenn., Sept. 17, 2021 (GLOBE NEWSWIRE) — As has been previously disclosed, CoreCivic, Inc. (NYSE: CXW) (the Company) has a direct contract with the U.S. Marshals Service (USMS) at the 600-bed West Tennessee Detention Facility in Mason, Tennessee that is scheduled to expire on September 30, 2021. The Company recently was provided with a definitive inmate population ramp down plan from the USMS indicating that all inmates will be transferred out of the facility by September 30, 2021. As a result, the Company does not expect the USMS to exercise its renewal option under the existing contract.

The Company has been actively marketing the facility to other government agencies, and in August 2021, the Company submitted a formal response to a government agency’s request for proposal to utilize the West Tennessee Detention Facility. However, the Company can provide no assurances that it will be successful in entering into a new contract with the government agency.

The revenue generated from the USMS at the West Tennessee Detention Facility for the year ended December 31, 2020, and six months ended June 30, 2021, was $18.4 million and $10.2 million, respectively. For the year ended December 31, 2020, the facility incurred a $1.4 million net operating loss, and for the six months ended June 30, 2021, the facility generated net operating income of $0.8 million.

About CoreCivic

CoreCivic is a diversified government solutions company with the scale and experience needed to solve tough government challenges in flexible, cost-effective ways. CoreCivic provides a broad range of solutions to government partners that serve the public good through corrections and detention management, a network of residential reentry centers to help address America’s recidivism crisis, and government real estate solutions. CoreCivic is the nation’s largest owner of partnership correctional, detention and residential reentry facilities, and believes it is the largest private owner of real estate used by government agencies in the U.S. CoreCivic has been a flexible and dependable partner for government for more than 35 years. CoreCivic’s employees are driven by a deep sense of service, high standards of professionalism and a responsibility to help government better the public good.

Forward-Looking Statements

This press release contains statements as to our beliefs and expectations of the outcome of future events that are “forward-looking” statements within the meaning of Section 21E of the Securities Exchange Act of 1934, as amended, and the Private Securities Litigation Reform Act of 1995. These forward-looking statements are subject to risks and uncertainties that could cause actual results to differ materially from the statements made. These include, but are not limited to, the risks and uncertainties associated with: (i) changes in government policy (including the United States Department of Justice, or DOJ, not renewing contracts as a result of President Biden’s Executive Order on Reforming Our Incarceration System to Eliminate the Use of Privately Operated Criminal Detention Facilities) (two agencies of the DOJ, the United States Federal Bureau of Prisons and the United States Marshals Service, utilize our services), legislation and regulations that affect utilization of the private sector for corrections, detention, and residential reentry services, in general, or our business, in particular, including, but not limited to, the continued utilization of our correctional and detention facilities by the federal government, and the impact of any changes to immigration reform and sentencing laws (we do not, under longstanding policy, lobby for or against policies or legislation that would determine the basis for, or duration of, an individual’s incarceration or detention); (ii) our ability to obtain and maintain correctional, detention, and residential reentry facility management contracts because of reasons including, but not limited to, sufficient governmental appropriations, contract compliance, negative publicity and effects of inmate disturbances; (iii) changes in the privatization of the corrections and detention industry, the acceptance of our services, the timing of the opening of new facilities and the commencement of new management contracts (including the extent and pace at which new contracts are utilized), as well as our ability to utilize available beds; (iv) general economic and market conditions, including, but not limited to, the impact governmental budgets can have on our contract renewals and renegotiations, per diem rates, and occupancy; (v) fluctuations in our operating results because of, among other things, changes in occupancy levels, competition, contract renegotiations or terminations, increases in costs of operations, fluctuations in interest rates and risks of operations; (vi) the duration of the federal government’s denial of entry at the United States southern border to asylum-seekers and anyone crossing the southern border without proper documentation or authority in an effort to contain the spread of COVID-19; (vii) government and staff responses to staff or residents testing positive for COVID-19 within public and private correctional, detention and reentry facilities, including the facilities we operate; (viii) restrictions associated with COVID-19 that disrupt the criminal justice system, along with government policies on prosecutions and newly ordered legal restrictions that affect the number of people placed in correctional, detention, and reentry facilities, including those associated with a resurgence of COVID-19; (ix) whether revoking our real estate investment trust, or REIT, election, effective January 1, 2021, and our revised capital allocation strategy can be implemented in a cost effective manner that provides the expected benefits, including facilitating our planned debt reduction initiative and planned return of capital to shareholders; (x) our ability to successfully identify and consummate future development and acquisition opportunities and our ability to successfully integrate the operations of our completed acquisitions and realize projected returns resulting therefrom; (xi) our ability, following our revocation of our REIT election, to identify and initiate service opportunities that were unavailable under the REIT structure; (xii) our ability to have met and maintained qualification for taxation as a REIT for the years we elected REIT status; and (xiii) the availability of debt and equity financing on terms that are favorable to us, or at all. Other factors that could cause operating and financial results to differ are described in the filings we make from time to time with the Securities and Exchange Commission.

CoreCivic takes no responsibility for updating the information contained in this press release following the date hereof to reflect events or circumstances occurring after the date hereof or the occurrence of unanticipated events or for any changes or modifications made to this press release or the information contained herein by any third-parties, including, but not limited to, any wire or internet services.

Contact:    Investors: Cameron Hopewell – Managing Director, Investor Relations – (615) 263-3024
Media: Steve Owen – Vice President, Communications – (615) 263-3107

Evaluating Opportunity With the iPhone New Marijuana Policy


Image Credit: Engin Akyurt (Pexels)


Apple’s Marijuana Decision Will Lead to Many Critical Decisions for Investors


Taking emotion out of investing is important. The recent news that iPhone users can purchase marijuana and other products containing THC through the Apple App store has implications for portfolios beyond just wider U.S. cannabis acceptance.  Although it helps to know Apple is confident in the regulatory future, this is just part of the possible investor benefit. Discovering early which apps are becoming the most downloaded, and evaluating the business models to assess if they provide for-profit and growth, may make exploring technology companies surrounding MJ as or more worthwhile as the overall lift this gives to the entire industry.

Apple’s Previous Policy

Apps that encourage consumption of tobacco and vape products, illegal drugs, or excessive amounts of alcohol are not permitted on the App Store. … Facilitating the sale of controlled substances (except for licensed pharmacies), marijuana, or tobacco is not allowed.


Background:

Apple had updated its policy that banned cannabis delivery apps from the iPhone store with exceptions for “licensed or otherwise legal cannabis dispensaries.” In July, Apple approved its first MJ delivery app. The first on the phone is Eaze.

The addition of this first app means a great deal to the legal marijuana industry. Apps that have been added since include Beta, Caliva, and Pineapple Express. Weedmaps, which helps users find local dispensaries, had already been approved and available since they did not sell product. The app instead helps to locate dispensaries.

Message for the Industry

Fortune lists Apple as #6 on its 500 list of largest companies. The amount of pull, insight, and legal “firepower” that makes Apple who they are, suggests that they are confident that being part of the transfer of marijuana, which is still a federal offense, should not cause them trouble. In short order, the amount of weed transferred or delivered through an app on their product could break all previous records of marijuana sales.

Delivery App Ranking

In order to determine which MJ delivery apps are being downloaded the most, you can consult with free services that report on app downloads. Techspot provides a weekly roundup of downloaded apps on Apple. This could be a good starting point to find active companies. From here, for those companies that are publicly traded, search for the ticker on Channelchek and other top-tier trusted sites for information on growing companies.

Take-Away

News of Apple’s inclusion of MJ delivery apps is a great sign for the entire industry. Selecting winners within different segments of the industry, and there are many, requires tools to determine where activity is, insight into management, discovering which company’s have better business models, and building a company that will either grow or be acquired at a premium.

As with other areas of investing, there is no crystal ball. Using a website to watch what companies are downloaded and Channelchek to review numbers and other news, may provide an edge.


Suggested Reading:


Cannabis Customers Served by Ice Cream Truck Delivery Model


Medical Cannabis Companies vs. Recreational Cannabis Companies


Stem Holdings, Inc. CEO, Adam Berk – C-Suite


Medicine Man Technologies, Inc. CEO Justin Dye


Sources:

https://www.techspot.com/downloads/popular-this-week/

https://fortune.com/global500/?utm_content=invest&tpcc=gfortune500&gclid=Cj0KCQjwvO2IBhCzARIsALw3ASoLpMmEDaVIAwsoGLyFI1nYUDpuMwMDRpl-UGTJJ39ZLpfiRTVuHlQaAskCEALw_wcB

https://mashable.com/article/weed-app-store-apple-ban-lifted-marijuana-delivery

https://www.businesswire.com/news/home/20210708005603/en/Eaze-Launches-First-Shoppable-Cannabis-Delivery-App-for-Apple

https://apps.apple.com/us/app/caliva-weed-delivery/id1565206998

https://apps.apple.com/us/app/beta-cannabis-delivery/id1528965142

https://apps.apple.com/us/app/pineapple-express-delivers/id1467738745

https://www.independent.co.uk/newsletters?utm_medium=referral&utm_source=msn&utm_campaign=newsletters

https://twitter.com/hashtag/Weedmaps?src=hash&ref_src=twsrc%5Etfw

https://twitter.com/weedmaps/status/1425126068025913344?ref_src=twsrc%5Etfw


Stay up to date. Follow us:


Why Walmart Embracing Cryptocurrency is Important


Walmart’s Blockchain History to Add a New Chapter


Walmart seems to be following Amazon in mapping out the most appropriate path to embrace cryptocurrency as a form of payment. Walmart, the number one retailer in the U.S., just ran a LinkedIn ad seeking a director who will “Own and drive the Digital Currency strategy for Walmart.” Crypto traders are viewing this as a further mainstreaming of the asset class, and acceptance as a payment form.

Based on the ad, there is an active search for someone to fill this lead role and the position will be at Walmart HQ in Bentonville, Arkansas. The position as described will be tasked to, “Identify Crypto related investment and partnerships” and “Identify customer needs and translate them into product requirements.”


Source: LinkedIn/jobs

Walmart’s Blockchain History

It is unclear at this point whether Walmart’s design and implementation of a digital currency payment solution will involve the use of the current large cryptocurrencies such as Bitcoin. However, the company has been embracing the technology for a while. In August of 2019, Walmart filed an application with the U.S. Patent and Trademark Office. In their application, Walmart was seeking a stablecoin currency “tied to a regular currency.” Other features suggested within the broad patent filing included the ability to replace the need for credit cards with consumers acting as a “pre-approved biometric (e.g., fingerprint or eye pattern) credit.”

Walmart is already using blockchain for tracking products like perishable produce and pharmaceuticals. The retailer has also been investigating various technology use cases, with projects including connecting automated delivery drones.

There are no public updates related to the stablecoin patent application.


Take-Away

If the number one and two retailers in the U.S. (Kroger is #3) become open to accepting digital currency and even retaining some in reserve as a strategic asset, the understanding and acceptance of its uses will leap forward for a large part of the population. Together the two firms would be responsible for introducing tens of millions of shoppers to the ledger technology. This may not cause them to understand how or why it serves as a payment method, but it could cause many to drop their fears and adopt crypto payments far quicker than if they had no connection in their day-to-day life.


Suggested Reading:


Is Amazon Getting Primed for Cryptocurrencies?


What’s in the Surprise Cryptocurrency Bill


Crypto Mining Gives Mothballed Fossil Fuel Plants New Life


$68 Billion Headed to Senior Citizens


Sources:

https://www.linkedin.com/jobs/view/digital-currency-and-cryptocurrency-product-lead-at-walmart-2680351507/

https://www.coindesk.com/walmart-wants-to-patent-a-stablecoin-that-looks-a-lot-like-facebook-libra

https://www.coindesk.com/walmart-explores-blockchain-for-connecting-automated-delivery-drones


Stay up to date. Follow us:


Kelly Services Inc. (KELYA) – Recovery Continuing Reinstates Dividend

Friday, August 13, 2021

Kelly Services Inc. (KELYA)
Recovery Continuing; Reinstates Dividend

Kelly Services Inc is a provider of workforce solutions and consulting and staffing services. The company’s operations are divided into three business segments namely Americas Staffing, Global Talent Solutions (“GTS”) and International Staffing. It provides staffing solutions through its branch networks in Americas and International operations and also provides a suite of innovative talent fulfilment and outcome-based solutions through GTS segment. Americas Staffing generates maximum revenue from its operations.

Joe Gomes, Senior Research Analyst, Noble Capital Markets, Inc.

Refer to the full report for the price target, fundamental analysis, and rating.

    2Q21. Revenue of $1.26 billion was up 29% year-over-year (26.2% in constant currency) driven by increased customer demand as the economy recovers and a 310 bp impact from Softworld. Kelly reported operating earnings of $13.7 million, up 24.1% y-o-y, and up 29.3% sequentially. GAAP EPS for 2Q21 was $0.60 compared to $1.04 in 2Q20. Adjusted EPS for the second quarter was $0.49 versus $0.51 last year. We had projected revenue of $1.25 billion and adjusted EPS of $0.32.

    Demand Continues to Rebound.  Kelly saw strong demand across all of its operating segments in the quarter. P&I revenues rose 14.8% y-o-y, SET rose 20.6%, Education was up 322.1%, OCG revenues rose 28.2%, and International revenues were up 31.6% y-o-y. Operating earnings rose in each segment, with the exception of P&I …


This Company Sponsored Research is provided by Noble Capital Markets, Inc., a FINRA and S.E.C. registered broker-dealer (B/D).

*Analyst certification and important disclosures included in the full report. NOTE: investment decisions should not be based upon the content of this research summary.  Proper due diligence is required before making any investment decision. 

Kelly Services Inc. (KELYA) – Recovery Continuing; Reinstates Dividend

Friday, August 13, 2021

Kelly Services Inc. (KELYA)
Recovery Continuing; Reinstates Dividend

Kelly Services Inc is a provider of workforce solutions and consulting and staffing services. The company’s operations are divided into three business segments namely Americas Staffing, Global Talent Solutions (“GTS”) and International Staffing. It provides staffing solutions through its branch networks in Americas and International operations and also provides a suite of innovative talent fulfilment and outcome-based solutions through GTS segment. Americas Staffing generates maximum revenue from its operations.

Joe Gomes, Senior Research Analyst, Noble Capital Markets, Inc.

Refer to the full report for the price target, fundamental analysis, and rating.

    2Q21. Revenue of $1.26 billion was up 29% year-over-year (26.2% in constant currency) driven by increased customer demand as the economy recovers and a 310 bp impact from Softworld. Kelly reported operating earnings of $13.7 million, up 24.1% y-o-y, and up 29.3% sequentially. GAAP EPS for 2Q21 was $0.60 compared to $1.04 in 2Q20. Adjusted EPS for the second quarter was $0.49 versus $0.51 last year. We had projected revenue of $1.25 billion and adjusted EPS of $0.32.

    Demand Continues to Rebound.  Kelly saw strong demand across all of its operating segments in the quarter. P&I revenues rose 14.8% y-o-y, SET rose 20.6%, Education was up 322.1%, OCG revenues rose 28.2%, and International revenues were up 31.6% y-o-y. Operating earnings rose in each segment, with the exception of P&I …


This Company Sponsored Research is provided by Noble Capital Markets, Inc., a FINRA and S.E.C. registered broker-dealer (B/D).

*Analyst certification and important disclosures included in the full report. NOTE: investment decisions should not be based upon the content of this research summary.  Proper due diligence is required before making any investment decision. 

Release – Kelly Reports Second-Quarter 2021 Earnings and Announces Dividend


Kelly Reports Second-Quarter 2021 Earnings and Announces Dividend


Financial Highlights

  • Q2 revenue up 29.0%; 26.2% in constant currency
  • Q2 operating earnings of $13.7 million; up 24.1% from a year ago
  • Q2 earnings per share of $0.60 down from $1.04 a year ago; adjusted EPS of $0.49 compared to $0.51

TROY, Mich., Aug. 12, 2021 (GLOBE NEWSWIRE) — Kelly (Nasdaq: KELYA) (Nasdaq: KELYB), a leading specialty talent solutions provider, today announced results for the second quarter of 2021.

Peter Quigley, president and chief executive officer, announced revenue for the second quarter of 2021 totaled $1.3 billion, a 29.0% increase compared to the corresponding quarter of 2020. Revenue improved year-over-year in the quarter reflecting increased customer demand compared to the COVID-19-impacted prior year period.

Earnings from operations in the second quarter of 2021 totaled $13.7 million, compared to earnings of $11.1 million reported in the second quarter of 2020.

Diluted earnings per share in the second quarter of 2021 were $0.60 compared to $1.04 per share in the second quarter of 2020. Included in the earnings per share is a non-cash gain per share, net of tax, on Kelly’s investment in Persol Holdings common stock of $0.11 in the second quarter of 2021 and $0.52 in the second quarter of 2020. On an adjusted basis, earnings per share were $0.49 in the second quarter of 2021 compared to $0.51 in the corresponding quarter of 2020.

“All five of our operating segments—Professional & Industrial (P&I); Science, Engineering & Technology (SET); Education; OCG; and International—delivered organic year-over-year revenue growth in the second quarter as the recovery gained momentum,” said Quigley. “OCG continues to exceed pre-COVID growth rates; Education exited the quarter on track with 2019 revenue; our International and SET segments delivered solid specialty growth; and our Softworld acquisition is already delivering top- and bottom-line results for the enterprise. Demand is strong in our P&I segment, though it will take longer to fully recover. We’re encouraged by the healthy sales pipelines and new wins we’re seeing across all of our businesses. Our reinstatement of a dividend for the quarter reflects the progress we’re making with our specialization and M&A strategies, and our confidence in the economic recovery. Kelly is well-positioned for the future and ready for what’s next.”

Kelly also reported that on August 11, its board of directors declared a dividend of $0.05 per share. The dividend is payable on September 7, 2021 to stockholders of record as of the close of business on August 25, 2021.

In conjunction with its second quarter earnings release, Kelly has published a financial presentation on the Investor Relations page of its public website and will host a conference call at 9 a.m. ET on August 12 to review the results and answer questions. The call may be accessed in one of the following ways:

Via the Internet:
Kellyservices.com

Via the Telephone
(877) 692-8955 (toll free) or (234) 720-6979 (caller paid)
Enter access code 5728672
After the prompt, please enter “#”

A recording of the conference call will be available after 2:30 p.m. ET on August 12, 2021, at (866) 207-1041 (toll-free) and (402) 970-0847 (caller-paid). The access code is 8454029#. The recording will also be available at kellyservices.com during this period.

This release contains statements that are forward looking in nature and, accordingly, are subject to risks and uncertainties. These factors include, but are not limited to, changing market and economic conditions, the recent novel coronavirus (COVID-19) outbreak, competitive market pressures including pricing and technology introductions and disruptions, disruption in the labor market and weakened demand for human capital resulting from technological advances, competition law risks, the impact of changes in laws and regulations (including federal, state and international tax laws), unexpected changes in claim trends on workers’ compensation, unemployment, disability and medical benefit plans, or the risk of additional tax liabilities in excess of our estimates, our ability to achieve our business strategy, our ability to successfully develop new service offerings, material changes in demand from or loss of large corporate customers as well as changes in their buying practices, risks particular to doing business with government or government contractors, the risk of damage to our brand, our exposure to risks associated with services outside traditional staffing, including business process outsourcing, services of licensed professionals and services connecting talent to independent work, our increasing dependency on third parties for the execution of critical functions, our ability to effectively implement and manage our information technology strategy, the risks associated with past and future acquisitions, including risk of related impairment of goodwill and intangible assets, exposure to risks associated with investments in equity affiliates including PersolKelly Pte. Ltd., risks associated with conducting business in foreign countries, including foreign currency fluctuations, the exposure to potential market and currency exchange risks relating to our investment in Persol Holdings, risks associated with violations of anti-corruption, trade protection and other laws and regulations, availability of qualified full-time employees, availability of temporary workers with appropriate skills required by customers, liabilities for employment-related claims and losses, including class action lawsuits and collective actions, our ability to sustain critical business applications through our key data centers, risks arising from failure to preserve the privacy of information entrusted to us or to meet our obligations under global privacy laws, the risk of cyberattacks or other breaches of network or information technology security, our ability to realize value from our tax credit and net operating loss carryforwards, our ability to maintain specified financial covenants in our bank facilities to continue to access credit markets, and other risks, uncertainties and factors discussed in this release and in the Company’s filings with the Securities and Exchange Commission. Actual results may differ materially from any forward-looking statements contained herein, and we undertake no duty to update any forward-looking statement to conform the statement to actual results or changes in the Company’s expectations.

About Kelly®

Kelly Services, Inc. (Nasdaq: KELYA, KELYB) connects talented people to companies in need of their skills in areas including Science, Engineering, Education, Office, Contact Center, Light Industrial, and more. We’re always thinking about what’s next in the evolving world of work, and we help people ditch the script on old ways of thinking and embrace the value of all workstyles in the workplace. We directly employ nearly 370,000 people around the world, and we connect thousands more with work through our global network of talent suppliers and partners in our outsourcing and consulting practice. Revenue in 2020 was $4.5 billion. Visit kellyservices.com and let us help with what’s next for you.


MEDIA CONTACT:     ANALYST CONTACT:
Jane Stehney     James Polehna
(248) 765-6864     (248) 244-4586
stehnja@kellyservices.com     james.polehna@kellyservices.com


KELLY SERVICES, INC. AND SUBSIDIARIES
CONSOLIDATED STATEMENTS OF EARNINGS
FOR THE 13 WEEKS ENDED JULY 4, 2021 AND JUNE 28, 2020
(UNAUDITED)
(In millions of dollars except per share data)
                %   CC %  
    2021   2020   Change   Change   Change  
                       
Revenue from services $ 1,258.1   $ 975.3   $ 282.8     29.0   % 26.2   %
                       
Cost of services   1,027.1     786.1     241.0     30.7        
                       
Gross profit   231.0     189.2     41.8     22.1     19.6    
                       
Selling, general and administrative expenses   217.3     178.1     39.2     21.9     19.8    
                       
Earnings (loss) from operations   13.7     11.1     2.6     24.1        
                       
Gain (loss) on investment in Persol Holdings   6.3     29.6     (23.3 )   (78.8 )      
                       
Other income (expense), net   (0.3 )   2.6     (2.9 )   (109.0 )      
                       
Earnings (loss) before taxes and equity in net earnings (loss) of affiliate   19.7     43.3     (23.6 )   (54.4 )      
                       
Income tax expense (benefit)   (2.6 )   0.9     (3.5 )   (406.2 )      
                       
Net earnings (loss) before equity in net earnings (loss) of affiliate   22.3     42.4     (20.1 )   (47.2 )      
                       
Equity in net earnings (loss) of affiliate   1.7     (1.3 )   3.0     NM      
                       
Net earnings (loss) $ 24.0   $ 41.1   $ (17.1 )   (41.6 )      
                       
Basic earnings (loss) per share $ 0.60   $ 1.04   $ (0.44 )   (42.3 )      
Diluted earnings (loss) per share $ 0.60   $ 1.04   $ (0.44 )   (42.3 )      
                       
                       
STATISTICS:                      
                       
Permanent placement revenue (included in revenue from services) $ 18.6   $ 7.6   $ 11.0     146.1   % 139.8   %
                       
Gross profit rate   18.4   % 19.4   % (1.0 ) pts.        
                       
Conversion rate   5.9   % 5.8   % 0.1   pts.        
                       
Adjusted EBITDA $ 22.2   $ 16.9   $ 5.3            
Adjusted EBITDA margin   1.8   % 1.7   % 0.1   pts.        
                       
Effective income tax rate   (13.5 ) % 2.0   % (15.5 ) pts.        
                       
Average number of shares outstanding (millions):                      
Basic   39.4     39.3                
Diluted   39.5     39.4                


KELLY SERVICES, INC. AND SUBSIDIARIES
CONSOLIDATED STATEMENTS OF EARNINGS
FOR THE 26 WEEKS ENDED JULY 4, 2021 AND JUNE 28, 2020
(UNAUDITED)
(In millions of dollars except per share data)
                %   CC %  
    2021   2020   Change   Change   Change  
                       
Revenue from services $ 2,464.0   $ 2,236.4   $ 227.6     10.2   % 8.3   %
                       
Cost of services   2,019.7     1,823.9     195.8     10.7        
                       
Gross profit   444.3     412.5     31.8     7.7     5.9    
                       
Selling, general and administrative expenses   420.0     397.6     22.4     5.6     4.0    
                       
Goodwill impairment charge       147.7     (147.7 )   NM      
                       
Gain on sale of assets       (32.1 )   32.1     NM      
                       
Earnings (loss) from operations   24.3     (100.7 )   125.0     NM      
                       
Gain (loss) on investment in Persol Holdings   36.3     (48.2 )   84.5     NM      
                       
Other income (expense), net   (3.7 )   4.3     (8.0 )   (185.8 )      
                       
Earnings (loss) before taxes and equity in net earnings (loss) of affiliate   56.9     (144.6 )   201.5     NM      
                       
Income tax expense (benefit)   7.9     (35.3 )   43.2     122.2        
                       
Net earnings (loss) before equity in net earnings (loss) of affiliate   49.0     (109.3 )   158.3     NM      
                       
Equity in net earnings (loss) of affiliate   0.6     (2.8 )   3.4     NM      
                       
Net earnings (loss) $ 49.6   $ (112.1 ) $ 161.7     NM      
                       
Basic earnings (loss) per share $ 1.25   $ (2.86 ) $ 4.11     NM      
Diluted earnings (loss) per share $ 1.25   $ (2.86 ) $ 4.11     NM      
                       
                       
STATISTICS:                      
                       
Permanent placement revenue (included in revenue from services) $ 34.6   $ 19.8   $ 14.8     74.1   % 70.0   %
                       
Gross profit rate   18.0   % 18.4   % (0.4 ) pts.        
                       
Conversion rate   5.5   % (24.4 ) % 29.9   pts.        
                       
Adjusted EBITDA $ 39.1   $ 35.4   $ 3.7            
Adjusted EBITDA margin   1.6   % 1.6   %   pts.        
                       
Effective income tax rate   13.8   % 24.5   % (10.7 ) pts.        
                       
Average number of shares outstanding (millions):                      
Basic   39.4     39.2                
Diluted   39.5     39.2                


KELLY SERVICES, INC. AND SUBSIDIARIES
RESULTS OF OPERATIONS BY SEGMENT
(UNAUDITED)
(In millions of dollars)
                     
    Second Quarter
                     
              %   CC %  
    2021     2020   Change   Change  
Professional & Industrial                    
Revenue from services $ 466.5     $ 406.4     14.8   % 14.0   %
Gross profit   75.2       78.9     (4.7 )   (5.5 )  
SG&A expenses excluding restructuring charges   69.0       64.6     6.8     6.2    
Restructuring charges             NM   NM  
Total SG&A expenses   69.0       64.6     6.9     6.2    
Earnings (loss) from operations   6.2       14.3     (57.0 )      
Earnings (loss) from operations excluding restructuring charges   6.2       14.3     (56.9 )      
                     
Gross profit rate   16.1   %   19.4   % (3.3 ) pts.    
                     
Science, Engineering & Technology                    
Revenue from services $ 298.2     $ 247.3     20.6   % 20.1   %
Gross profit   66.5       50.6     31.5     31.1    
SG&A expenses excluding restructuring charges   46.9       31.3     49.7     49.3    
Restructuring charges             NM   NM  
Total SG&A expenses   46.9       31.3     49.7     49.3    
Earnings (loss) from operations   19.6       19.3     1.8        
Earnings (loss) from operations excluding restructuring charges   19.6       19.3     1.8        
                     
Gross profit rate   22.3   %   20.4   % 1.9   pts.    
                     
Education                    
Revenue from services $ 105.9     $ 25.1     322.1   % 322.1   %
Gross profit   16.8       4.3     291.1     291.1    
SG&A expenses excluding restructuring charges   15.3       9.6     60.0     60.0    
Restructuring charges         (0.1 )   NM   NM  
Total SG&A expenses   15.3       9.5     60.5     60.5    
Earnings (loss) from operations   1.5       (5.2 )   NM      
Earnings (loss) from operations excluding restructuring charges   1.5       (5.3 )   NM      
                     
Gross profit rate   15.8   %   17.1   % (1.3 ) pts.    
                     
Outsourcing & Consulting                    
Revenue from services $ 107.3     $ 83.6     28.2   % 26.1   %
Gross profit   34.8       29.2     19.3     15.7    
SG&A expenses excluding restructuring charges   30.1       25.1     19.8     17.0    
Restructuring charges             NM   NM  
Total SG&A expenses   30.1       25.1     19.7     17.0    
Earnings (loss) from operations   4.7       4.1     16.2        
Earnings (loss) from operations excluding restructuring charges   4.7       4.1     15.9        
                     
Gross profit rate   32.5   %   34.9   % (2.4 ) pts.    
                     
International                    
Revenue from services $ 280.4     $ 213.0     31.6   % 21.6   %
Gross profit   37.7       26.2     43.8     32.9    
SG&A expenses excluding restructuring charges   34.6       28.3     22.3     13.3    
Restructuring charges             NM   NM  
Total SG&A expenses   34.6       28.3     22.3     13.3    
Earnings (loss) from operations   3.1       (2.1 )   NM      
Earnings (loss) from operations excluding restructuring charges   3.1       (2.1 )   NM      
                     
Gross profit rate   13.4   %   12.3   % 1.1   pts.    


KELLY SERVICES, INC. AND SUBSIDIARIES
RESULTS OF OPERATIONS BY SEGMENT
(UNAUDITED)
(In millions of dollars)
                     
    June Year to Date
                     
              %   CC %  
    2021     2020   Change   Change  
Professional & Industrial                    
Revenue from services $ 934.1     $ 900.2     3.8   % 3.2   %
Gross profit   151.1       164.0     (7.9 )   (8.4 )  
SG&A expenses excluding restructuring charges   138.4       140.7     (1.7 )   (2.1 )  
Restructuring charges         4.4     NM   NM  
Total SG&A expenses   138.4       145.1     (4.6 )   (5.0 )  
Earnings (loss) from operations   12.7       18.9     (32.9 )      
Earnings (loss) from operations excluding restructuring charges   12.7       23.3     (45.4 )      
                     
Gross profit rate   16.2   %   18.2   % (2.0 ) pts.    
                     
Science, Engineering & Technology                    
Revenue from services $ 552.9     $ 517.5     6.8   % 6.5   %
Gross profit   119.7       105.3     13.7     13.4    
SG&A expenses excluding restructuring charges   82.6       67.3     22.8     22.5    
Restructuring charges         0.5     NM   NM  
Total SG&A expenses   82.6       67.8     21.8     21.5    
Earnings (loss) from operations   37.1       37.5     (1.1 )      
Earnings (loss) from operations excluding restructuring charges   37.1       38.0     (2.5 )      
                     
Gross profit rate   21.6   %   20.3   % 1.3   pts.    
                     
Education                    
Revenue from services $ 217.5     $ 167.6     29.8   % 29.8   %
Gross profit   34.0       24.7     37.6     37.6    
SG&A expenses excluding restructuring charges   29.5       25.3     16.8     16.8    
Restructuring charges         0.8     NM   NM  
Total SG&A expenses   29.5       26.1     12.9     12.9    
Earnings (loss) from operations   4.5       (1.4 )   NM      
Earnings (loss) from operations excluding restructuring charges   4.5       (0.6 )   NM      
                     
Gross profit rate   15.6   %   14.7   % 0.9   pts.    
                     
Outsourcing & Consulting                    
Revenue from services $ 206.6     $ 173.1     19.3   % 17.5   %
Gross profit   66.1       58.0     14.1     11.0    
Total SG&A expenses   58.5       53.7     8.9     6.6    
Earnings (loss) from operations   7.6       4.3     78.9        
                     
Gross profit rate   32.0   %   33.5   % (1.5 ) pts.    
                     
International                    
Revenue from services $ 553.3     $ 478.2     15.7   % 9.0   %
Gross profit   73.4       60.5     21.3     13.9    
SG&A expenses excluding restructuring charges   67.7       60.4     12.0     5.1    
Restructuring charges         1.1     NM   NM  
Total SG&A expenses   67.7       61.5     10.1     3.3    
Earnings (loss) from operations   5.7       (1.0 )   NM      
Earnings (loss) from operations excluding restructuring charges   5.7       0.1     NM      
                     
Gross profit rate   13.3   %   12.7   % 0.6   pts.    


KELLY SERVICES, INC. AND SUBSIDIARIES
CONSOLIDATED BALANCE SHEETS
(UNAUDITED)
(In millions of dollars)
               
    July 4, 2021   January 3, 2021   June 28, 2020  
Current Assets              
Cash and equivalents $ 64.4   $ 223.0   $ 216.2    
Trade accounts receivable, less allowances of              
 $12.5, $13.3, and $11.2, respectively   1,362.5     1,265.2     1,085.0    
Prepaid expenses and other current assets   82.4     61.4     76.0    
Total current assets   1,509.3     1,549.6     1,377.2    
               
Noncurrent Assets              
Property and equipment, net   37.7     41.0     41.6    
Operating lease right-of-use assets   83.2     83.2     85.8    
Deferred taxes   302.9     282.0     265.9    
Goodwill, net   114.8     3.5        
Investment in Persol Holdings   187.7     164.2     127.2    
Investment in equity affiliate   120.0     118.5     113.6    
Other assets   391.3     319.9     307.4    
Total noncurrent assets   1,237.6     1,012.3     941.5    
               
Total Assets $ 2,746.9   $ 2,561.9   $ 2,318.7    
               
Current Liabilities              
Short-term borrowings $ 0.1   $ 0.3   $ 0.3    
Accounts payable and accrued liabilities   612.6     536.8     463.6    
Operating lease liabilities   19.6     19.6     19.5    
Accrued payroll and related taxes   337.0     293.0     210.7    
Accrued workers’ compensation and other claims   22.0     22.7     25.6    
Income and other taxes   62.6     53.2     71.7    
Total current liabilities   1,053.9     925.6     791.4    
               
Noncurrent Liabilities              
Operating lease liabilities   67.1     67.5     69.9    
Accrued payroll and related taxes   58.5     58.5     38.4    
Accrued workers’ compensation and other claims   40.8     42.2     45.6    
Accrued retirement benefits   214.6     205.8     180.8    
Other long-term liabilities   68.2     59.3     47.0    
Total noncurrent liabilities   449.2     433.3     381.7    
               
Stockholders’ Equity              
Common stock   40.1     40.1     40.1    
Treasury stock   (15.3 )   (17.1 )   (17.3 )  
Paid-in capital   22.3     21.3     20.5    
Earnings invested in the business   1,212.5     1,162.9     1,122.8    
Accumulated other comprehensive income (loss)   (15.8 )   (4.2 )   (20.5 )  
Total stockholders’ equity   1,243.8     1,203.0     1,145.6    
               
Total Liabilities and Stockholders’ Equity $ 2,746.9   $ 2,561.9   $ 2,318.7    
               
STATISTICS:              
Working Capital $ 455.4   $ 624.0   $ 585.8    
Current Ratio   1.4     1.7     1.7    
Debt-to-capital %   0.0   % 0.0   % 0.0   %
Global Days Sales Outstanding   60     64     61    
Year-to-Date Free Cash Flow $ 42.7   $ 170.5   $ 170.4    


KELLY SERVICES, INC. AND SUBSIDIARIES
CONSOLIDATED STATEMENTS OF CASH FLOWS
FOR THE 26 WEEKS ENDED JULY 4, 2021 AND JUNE 28, 2020
(UNAUDITED)
(In millions of dollars)
    2021   2020
Cash flows from operating activities:        
Net earnings (loss) $ 49.6   $ (112.1 )
Adjustments to reconcile net earnings (loss) to net cash from operating activities:        
Goodwill impairment charge       147.7  
Deferred income taxes on goodwill impairment charge       (23.0 )
Depreciation and amortization   14.1     12.0  
Operating lease asset amortization   10.7     10.5  
Provision for credit losses and sales allowances       0.1  
Stock-based compensation   2.8     2.4  
(Gain) loss on investment in Persol Holdings   (36.3 )   48.2  
Gain on sale of assets       (32.1 )
Equity in net (earnings) loss of PersolKelly Pte. Ltd.   (0.6 )   2.8  
Other, net   2.2     0.8  
Changes in operating assets and liabilities, net of acquisitions   5.1     120.8  
         
Net cash from operating activities   47.6     178.1  
         
Cash flows from investing activities:        
Capital expenditures   (4.9 )   (7.7 )
Proceeds from company-owned life insurance   10.4     2.3  
Proceeds from sale of assets       55.5  
Acquisition of companies, net of cash received   (219.0 )   (36.4 )
Proceeds (payments) related to loans with equity affiliate   5.8      
Proceeds from (investment in) equity securities   5.0      
Other investing activities   1.0     (0.4 )
         
Net cash (used in) from investing activities   (201.7 )   13.3  
         
Cash flows from financing activities:        
Net change in short-term borrowings   (0.1 )   (1.4 )
Financing lease payments   (0.3 )   (0.6 )
Payments of tax withholding for stock awards   (0.6 )   (1.1 )
Dividend payments       (3.0 )
Other financing activities       (0.1 )
         
Net cash used in financing activities   (1.0 )   (6.2 )
         
Effect of exchange rates on cash, cash equivalents and restricted cash   (2.3 )   5.7  
         
Net change in cash, cash equivalents and restricted cash   (157.4 )   190.9  
Cash, cash equivalents and restricted cash at beginning of period   228.1     31.0  
         
Cash, cash equivalents and restricted cash at end of period $ 70.7   $ 221.9  


KELLY SERVICES, INC. AND SUBSIDIARIES
REVENUE FROM SERVICES BY GEOGRAPHY
(UNAUDITED)
(In millions of dollars)
                   
    Second Quarter  
                   
            %   CC %  
    2021   2020   Change   Change  
                   
Americas                  
United States $ 894.6   $ 700.1     27.8   % 27.8   %
Canada   39.5     25.6     54.4     36.8    
Mexico   33.1     22.5     47.2     26.2    
Puerto Rico   26.9     20.0     34.3     34.3    
Brazil       6.1     NM   NM  
Total Americas Region   994.1     774.3            
                   
Europe                  
France   57.5     39.9     44.2     31.7    
Switzerland   54.0     47.4     13.8     7.5    
Portugal   40.6     23.8     70.7     55.9    
Russia   33.7     29.3     15.2     17.9    
Italy   19.4     13.3     46.1     33.6    
United Kingdom   17.7     17.8     (0.6 )   (11.8 )  
Germany   8.5     7.1     20.6     10.3    
Ireland   6.3     4.1     53.5     40.2    
Other   17.0     11.5     47.7     32.9    
Total Europe Region   254.7     194.2     31.2     22.3    
                   
Total Asia-Pacific Region   9.3     6.8     34.5     20.9    
                   
Total Kelly Services, Inc. $ 1,258.1   $ 975.3     29.0   % 26.2   %


KELLY SERVICES, INC. AND SUBSIDIARIES
REVENUE FROM SERVICES BY GEOGRAPHY
(UNAUDITED)
(In millions of dollars)
                   
    June Year to Date  
                   
            %   CC %  
    2021   2020   Change   Change  
                   
Americas                  
United States $ 1,753.1   $ 1,628.6     7.6   % 7.6   %
Canada   73.6     58.4     26.0     15.1    
Mexico   67.7     51.2     32.3     25.3    
Puerto Rico   51.1     37.7     35.3     35.3    
Brazil       15.2     NM   NM  
Total Americas Region   1,945.5     1,791.1     8.6     8.1    
                   
Europe                  
France   111.8     92.4     21.0     10.7    
Switzerland   106.7     91.6     16.4     9.6    
Portugal   84.3     67.4     25.1     14.5    
Russia   66.3     61.4     8.1     15.9    
Italy   37.5     28.0     33.9     22.6    
United Kingdom   34.7     40.1     (13.4 )   (21.4 )  
Germany   15.6     15.1     3.6     (5.2 )  
Ireland   11.4     9.1     25.6     14.9    
Other   32.6     26.7     22.1     11.9    
Total Europe Region   500.9     431.8     16.0     9.2    
                   
Total Asia-Pacific Region   17.6     13.5     29.8     16.9    
                   
Total Kelly Services, Inc. $ 2,464.0   $ 2,236.4     10.2   % 8.3   %


KELLY SERVICES, INC. AND SUBSIDIARIES
RECONCILIATION OF NON-GAAP MEASURES
SECOND QUARTER
(UNAUDITED)
(In millions of dollars)
       
  2021   2020
SG&A Expenses: As Reported   Adjusted
Professional & Industrial $ 69.0     $ 64.6  
Science, Engineering & Technology 46.9     31.3  
Education 15.3     9.6  
Outsourcing & Consulting 30.1     25.1  
International 34.6     28.3  
Corporate 21.4     19.4  
Total Company $ 217.3     $ 178.3  


  2021   2020
Earnings (loss) from Operations: As Reported   Adjusted
Professional & Industrial $ 6.2     $ 14.3  
Science, Engineering & Technology 19.6     19.3  
Education 1.5     (5.3 )
Outsourcing & Consulting 4.7     4.1  
International 3.1     (2.1 )
Corporate (21.4 )   (19.4 )
Total Company $ 13.7     $ 10.9  


KELLY SERVICES, INC. AND SUBSIDIARIES
RECONCILIATION OF NON-GAAP MEASURES
SECOND QUARTER
(UNAUDITED)
(In millions of dollars)
           
  2020
SG&A Expenses: As Reported   Restructuring(4)   Adjusted
Professional & Industrial $ 64.6     $     $ 64.6  
Science, Engineering & Technology 31.3         31.3  
Education 9.5     0.1     9.6  
Outsourcing & Consulting 25.1         25.1  
International 28.3         28.3  
Corporate 19.3     0.1     19.4  
Total Company $ 178.1     $ 0.2     $ 178.3  


  2020
Earnings (loss) from Operations: As Reported   Restructuring(4)   Adjusted
Professional & Industrial $ 14.3     $     $ 14.3  
Science, Engineering & Technology 19.3         19.3  
Education (5.2 )   (0.1 )   (5.3 )
Outsourcing & Consulting 4.1         4.1  
International (2.1 )       (2.1 )
Corporate (19.3 )   (0.1 )   (19.4 )
Total Company $ 11.1     $ (0.2 )   $ 10.9  


KELLY SERVICES, INC. AND SUBSIDIARIES
RECONCILIATION OF NON-GAAP MEASURES
JUNE YEAR TO DATE
(UNAUDITED)
(In millions of dollars)
       
  2021   2020
SG&A Expenses: As Reported   Adjusted
Professional & Industrial $ 138.4     $ 140.7  
Science, Engineering & Technology 82.6     67.3  
Education 29.5     25.3  
Outsourcing & Consulting 58.5     53.7  
International 67.7     60.4  
Corporate 43.3     41.7  
Total Company $ 420.0     $ 389.1  


  2021   2020
Earnings (loss) from Operations: As Reported   Adjusted
Professional & Industrial $ 12.7     $ 23.3  
Science, Engineering & Technology 37.1     38.0  
Education 4.5     (0.6 )
Outsourcing & Consulting 7.6     4.3  
International 5.7     0.1  
Corporate (43.3 )   (41.7 )
Total Company $ 24.3     $ 23.4  


KELLY SERVICES, INC. AND SUBSIDIARIES
RECONCILIATION OF NON-GAAP MEASURES
JUNE YEAR TO DATE
(UNAUDITED)
(In millions of dollars)
           
  2020
SG&A Expenses: As Reported   Restructuring(4)   Adjusted
Professional & Industrial $ 145.1     $ (4.4 )   $ 140.7  
Science, Engineering & Technology 67.8     (0.5 )   67.3  
Education 26.1     (0.8 )   25.3  
Outsourcing & Consulting 53.7         53.7  
International 61.5     (1.1 )   60.4  
Corporate 43.4     (1.7 )   41.7  
Total Company $ 397.6     $ (8.5 )   $ 389.1  


  2020
Earnings (loss) from Operations: As Reported   Goodwill
impairment
(1)
  Gain on sale
of assets(3)
  Restructuring(4)   Adjusted
Professional & Industrial $ 18.9     $     $     $ 4.4     $ 23.3  
Science, Engineering & Technology 37.5             0.5     38.0  
Education (1.4 )           0.8     (0.6 )
Outsourcing & Consulting 4.3                 4.3  
International (1.0 )           1.1     0.1  
Corporate (159.0 )   147.7     (32.1 )   1.7     (41.7 )
Total Company $ (100.7 )   $ 147.7     $ (32.1 )   $ 8.5     $ 23.4  


KELLY SERVICES, INC. AND SUBSIDIARIES
RECONCILIATION OF NON-GAAP MEASURES (continued)
(UNAUDITED)
(In millions of dollars except per share data)
                 
                 
    Second Quarter   June Year to Date
    2021   2020   2021   2020
Income tax expense (benefit)   $ (2.6 )   $ 0.9     $ 7.9     $ (35.3 )
Taxes on goodwill impairment charge(1)               23.0  
Taxes on investment in Persol Holdings(2)   (1.9 )   (9.0 )   (11.1 )   14.8  
Taxes on gain on sale of assets(3)               (8.1 )
Taxes on restructuring charges(4)               2.2  
Adjusted income tax expense (benefit)   $ (4.5 )   $ (8.1 )   $ (3.2 )   $ (3.4 )
                 
    Second Quarter   June Year to Date
    2021   2020   2021   2020
Net earnings (loss)   $ 24.0     $ 41.1     $ 49.6     $ (112.1 )
Goodwill impairment charge, net of taxes(1)               124.7  
(Gain) loss on investment in Persol Holdings, net of taxes(2)   (4.4 )   (20.6 )   (25.2 )   33.4  
Gain on sale of assets, net of taxes(3)               (24.0 )
Restructuring charges, net of taxes(4)       (0.2 )       6.3  
Adjusted net earnings   $ 19.6     $ 20.3     $ 24.4     $ 28.3  
                 
    Second Quarter   June Year to Date
    2021   2020   2021   2020
    Per Share   Per Share
Net earnings (loss)   $ 0.60     $ 1.04     $ 1.25     $ (2.86 )
Goodwill impairment charge, net of taxes(1)               3.18  
(Gain) loss on investment in Persol Holdings, net of taxes(2)   (0.11 )   (0.52 )   (0.63 )   0.85  
Gain on sale of assets, net of taxes(3)               (0.61 )
Restructuring charges, net of taxes(4)               0.16  
Adjusted net earnings   $ 0.49     $ 0.51     $ 0.61     $ 0.72  

Note: Earnings per share amounts for each quarter are required to be computed independently and may not equal the amounts computed for the total year.


KELLY SERVICES, INC. AND SUBSIDIARIES
RECONCILIATION OF NON-GAAP MEASURES (continued)
(UNAUDITED)
(In millions of dollars)
               
  Second Quarter   June Year to Date
  2021   2020   2021   2020
Net earnings (loss) $ 24.0       $ 41.1       $ 49.6       $ (112.1 )  
Other (income) expense, net 0.3       (2.6 )     3.7       (4.3 )  
Income tax expense (benefit) (2.6 )     0.9       7.9       (35.3 )  
Depreciation and amortization 8.5       6.0       14.8       12.0    
EBITDA 30.2       45.4       76.0       (139.7 )  
Equity in net (earnings) loss of affiliate (1.7 )     1.3       (0.6 )     2.8    
Goodwill impairment charge(1)                   147.7    
(Gain) loss on investment in Persol Holdings(2) (6.3 )     (29.6 )     (36.3 )     48.2    
Gain on sale of assets(3)                   (32.1 )  
Restructuring(4)       (0.2 )           8.5    
Adjusted EBITDA $ 22.2       $ 16.9       $ 39.1       $ 35.4    
Adjusted EBITDA margin 1.8   %   1.7   %   1.6   %   1.6   %


KELLY SERVICES, INC. AND SUBSIDIARIES
RECONCILIATION OF NON-GAAP MEASURES
(UNAUDITED)

Management believes that the non-GAAP (Generally Accepted Accounting Principles) information excluding the 2020 goodwill impairment charge, the 2021 and 2020 gains and losses on the investment in Persol Holdings, the 2020 gain on sale of assets and the 2020 restructuring charges, are useful to understand the Company’s fiscal 2021 financial performance and increases comparability. Specifically, Management believes that removing the impact of these items allows for a meaningful comparison of current period operating performance with the operating results of prior periods. Management also believes that such measures are used by those analyzing performance of companies in the staffing industry to compare current performance to prior periods and to assess future performance.

Management uses Adjusted EBITDA (adjusted earnings before interest, taxes, depreciation and amortization) and Adjusted EBITDA Margin (percent of total GAAP revenue) which Management believes is useful to compare operating performance compared to prior periods and uses it in conjunction with GAAP measures to assess performance. Our calculation of Adjusted EBITDA may not be consistent with similarly titled measures of other companies and should be used in conjunction with GAAP measurements.

These non-GAAP measures may have limitations as analytical tools because they exclude items which can have a material impact on cash flow and earnings per share. As a result, Management considers these measures, along with reported results, when it reviews and evaluates the Company’s financial performance. Management believes that these measures provide greater transparency to investors and provide insight into how Management is evaluating the Company’s financial performance. Non-GAAP measures should not be considered a substitute for, or superior to, measures of financial performance prepared in accordance with GAAP.

(1) The goodwill impairment charge is the result of an interim impairment test the Company performed during the first quarter of 2020, due to a triggering event caused by a decline in the Company’s common stock price.

(2) The gains and losses on the investment in Persol Holdings represent the change in fair value of the investment during the period presented and the related tax expense and benefit.

(3) Gain on sale of assets in 2020 primarily represents the excess of the proceeds over the cost of the headquarters properties sold during the first quarter of 2020.

(4) Restructuring charges in 2020 represent severance costs and lease terminations in preparation for the new operating model adopted in the third quarter of 2020.

Kelly Reports Second-Quarter 2021 Earnings and Announces Dividend


Kelly Reports Second-Quarter 2021 Earnings and Announces Dividend


Financial Highlights

  • Q2 revenue up 29.0%; 26.2% in constant currency
  • Q2 operating earnings of $13.7 million; up 24.1% from a year ago
  • Q2 earnings per share of $0.60 down from $1.04 a year ago; adjusted EPS of $0.49 compared to $0.51

TROY, Mich., Aug. 12, 2021 (GLOBE NEWSWIRE) — Kelly (Nasdaq: KELYA) (Nasdaq: KELYB), a leading specialty talent solutions provider, today announced results for the second quarter of 2021.

Peter Quigley, president and chief executive officer, announced revenue for the second quarter of 2021 totaled $1.3 billion, a 29.0% increase compared to the corresponding quarter of 2020. Revenue improved year-over-year in the quarter reflecting increased customer demand compared to the COVID-19-impacted prior year period.

Earnings from operations in the second quarter of 2021 totaled $13.7 million, compared to earnings of $11.1 million reported in the second quarter of 2020.

Diluted earnings per share in the second quarter of 2021 were $0.60 compared to $1.04 per share in the second quarter of 2020. Included in the earnings per share is a non-cash gain per share, net of tax, on Kelly’s investment in Persol Holdings common stock of $0.11 in the second quarter of 2021 and $0.52 in the second quarter of 2020. On an adjusted basis, earnings per share were $0.49 in the second quarter of 2021 compared to $0.51 in the corresponding quarter of 2020.

“All five of our operating segments—Professional & Industrial (P&I); Science, Engineering & Technology (SET); Education; OCG; and International—delivered organic year-over-year revenue growth in the second quarter as the recovery gained momentum,” said Quigley. “OCG continues to exceed pre-COVID growth rates; Education exited the quarter on track with 2019 revenue; our International and SET segments delivered solid specialty growth; and our Softworld acquisition is already delivering top- and bottom-line results for the enterprise. Demand is strong in our P&I segment, though it will take longer to fully recover. We’re encouraged by the healthy sales pipelines and new wins we’re seeing across all of our businesses. Our reinstatement of a dividend for the quarter reflects the progress we’re making with our specialization and M&A strategies, and our confidence in the economic recovery. Kelly is well-positioned for the future and ready for what’s next.”

Kelly also reported that on August 11, its board of directors declared a dividend of $0.05 per share. The dividend is payable on September 7, 2021 to stockholders of record as of the close of business on August 25, 2021.

In conjunction with its second quarter earnings release, Kelly has published a financial presentation on the Investor Relations page of its public website and will host a conference call at 9 a.m. ET on August 12 to review the results and answer questions. The call may be accessed in one of the following ways:

Via the Internet:
Kellyservices.com

Via the Telephone
(877) 692-8955 (toll free) or (234) 720-6979 (caller paid)
Enter access code 5728672
After the prompt, please enter “#”

A recording of the conference call will be available after 2:30 p.m. ET on August 12, 2021, at (866) 207-1041 (toll-free) and (402) 970-0847 (caller-paid). The access code is 8454029#. The recording will also be available at kellyservices.com during this period.

This release contains statements that are forward looking in nature and, accordingly, are subject to risks and uncertainties. These factors include, but are not limited to, changing market and economic conditions, the recent novel coronavirus (COVID-19) outbreak, competitive market pressures including pricing and technology introductions and disruptions, disruption in the labor market and weakened demand for human capital resulting from technological advances, competition law risks, the impact of changes in laws and regulations (including federal, state and international tax laws), unexpected changes in claim trends on workers’ compensation, unemployment, disability and medical benefit plans, or the risk of additional tax liabilities in excess of our estimates, our ability to achieve our business strategy, our ability to successfully develop new service offerings, material changes in demand from or loss of large corporate customers as well as changes in their buying practices, risks particular to doing business with government or government contractors, the risk of damage to our brand, our exposure to risks associated with services outside traditional staffing, including business process outsourcing, services of licensed professionals and services connecting talent to independent work, our increasing dependency on third parties for the execution of critical functions, our ability to effectively implement and manage our information technology strategy, the risks associated with past and future acquisitions, including risk of related impairment of goodwill and intangible assets, exposure to risks associated with investments in equity affiliates including PersolKelly Pte. Ltd., risks associated with conducting business in foreign countries, including foreign currency fluctuations, the exposure to potential market and currency exchange risks relating to our investment in Persol Holdings, risks associated with violations of anti-corruption, trade protection and other laws and regulations, availability of qualified full-time employees, availability of temporary workers with appropriate skills required by customers, liabilities for employment-related claims and losses, including class action lawsuits and collective actions, our ability to sustain critical business applications through our key data centers, risks arising from failure to preserve the privacy of information entrusted to us or to meet our obligations under global privacy laws, the risk of cyberattacks or other breaches of network or information technology security, our ability to realize value from our tax credit and net operating loss carryforwards, our ability to maintain specified financial covenants in our bank facilities to continue to access credit markets, and other risks, uncertainties and factors discussed in this release and in the Company’s filings with the Securities and Exchange Commission. Actual results may differ materially from any forward-looking statements contained herein, and we undertake no duty to update any forward-looking statement to conform the statement to actual results or changes in the Company’s expectations.

About Kelly®

Kelly Services, Inc. (Nasdaq: KELYA, KELYB) connects talented people to companies in need of their skills in areas including Science, Engineering, Education, Office, Contact Center, Light Industrial, and more. We’re always thinking about what’s next in the evolving world of work, and we help people ditch the script on old ways of thinking and embrace the value of all workstyles in the workplace. We directly employ nearly 370,000 people around the world, and we connect thousands more with work through our global network of talent suppliers and partners in our outsourcing and consulting practice. Revenue in 2020 was $4.5 billion. Visit kellyservices.com and let us help with what’s next for you.


MEDIA CONTACT:     ANALYST CONTACT:
Jane Stehney     James Polehna
(248) 765-6864     (248) 244-4586
stehnja@kellyservices.com     james.polehna@kellyservices.com


KELLY SERVICES, INC. AND SUBSIDIARIES
CONSOLIDATED STATEMENTS OF EARNINGS
FOR THE 13 WEEKS ENDED JULY 4, 2021 AND JUNE 28, 2020
(UNAUDITED)
(In millions of dollars except per share data)
                %   CC %  
    2021   2020   Change   Change   Change  
                       
Revenue from services $ 1,258.1   $ 975.3   $ 282.8     29.0   % 26.2   %
                       
Cost of services   1,027.1     786.1     241.0     30.7        
                       
Gross profit   231.0     189.2     41.8     22.1     19.6    
                       
Selling, general and administrative expenses   217.3     178.1     39.2     21.9     19.8    
                       
Earnings (loss) from operations   13.7     11.1     2.6     24.1        
                       
Gain (loss) on investment in Persol Holdings   6.3     29.6     (23.3 )   (78.8 )      
                       
Other income (expense), net   (0.3 )   2.6     (2.9 )   (109.0 )      
                       
Earnings (loss) before taxes and equity in net earnings (loss) of affiliate   19.7     43.3     (23.6 )   (54.4 )      
                       
Income tax expense (benefit)   (2.6 )   0.9     (3.5 )   (406.2 )      
                       
Net earnings (loss) before equity in net earnings (loss) of affiliate   22.3     42.4     (20.1 )   (47.2 )      
                       
Equity in net earnings (loss) of affiliate   1.7     (1.3 )   3.0     NM      
                       
Net earnings (loss) $ 24.0   $ 41.1   $ (17.1 )   (41.6 )      
                       
Basic earnings (loss) per share $ 0.60   $ 1.04   $ (0.44 )   (42.3 )      
Diluted earnings (loss) per share $ 0.60   $ 1.04   $ (0.44 )   (42.3 )      
                       
                       
STATISTICS:                      
                       
Permanent placement revenue (included in revenue from services) $ 18.6   $ 7.6   $ 11.0     146.1   % 139.8   %
                       
Gross profit rate   18.4   % 19.4   % (1.0 ) pts.        
                       
Conversion rate   5.9   % 5.8   % 0.1   pts.        
                       
Adjusted EBITDA $ 22.2   $ 16.9   $ 5.3            
Adjusted EBITDA margin   1.8   % 1.7   % 0.1   pts.        
                       
Effective income tax rate   (13.5 ) % 2.0   % (15.5 ) pts.        
                       
Average number of shares outstanding (millions):                      
Basic   39.4     39.3                
Diluted   39.5     39.4                


KELLY SERVICES, INC. AND SUBSIDIARIES
CONSOLIDATED STATEMENTS OF EARNINGS
FOR THE 26 WEEKS ENDED JULY 4, 2021 AND JUNE 28, 2020
(UNAUDITED)
(In millions of dollars except per share data)
                %   CC %  
    2021   2020   Change   Change   Change  
                       
Revenue from services $ 2,464.0   $ 2,236.4   $ 227.6     10.2   % 8.3   %
                       
Cost of services   2,019.7     1,823.9     195.8     10.7        
                       
Gross profit   444.3     412.5     31.8     7.7     5.9    
                       
Selling, general and administrative expenses   420.0     397.6     22.4     5.6     4.0    
                       
Goodwill impairment charge       147.7     (147.7 )   NM      
                       
Gain on sale of assets       (32.1 )   32.1     NM      
                       
Earnings (loss) from operations   24.3     (100.7 )   125.0     NM      
                       
Gain (loss) on investment in Persol Holdings   36.3     (48.2 )   84.5     NM      
                       
Other income (expense), net   (3.7 )   4.3     (8.0 )   (185.8 )      
                       
Earnings (loss) before taxes and equity in net earnings (loss) of affiliate   56.9     (144.6 )   201.5     NM      
                       
Income tax expense (benefit)   7.9     (35.3 )   43.2     122.2        
                       
Net earnings (loss) before equity in net earnings (loss) of affiliate   49.0     (109.3 )   158.3     NM      
                       
Equity in net earnings (loss) of affiliate   0.6     (2.8 )   3.4     NM      
                       
Net earnings (loss) $ 49.6   $ (112.1 ) $ 161.7     NM      
                       
Basic earnings (loss) per share $ 1.25   $ (2.86 ) $ 4.11     NM      
Diluted earnings (loss) per share $ 1.25   $ (2.86 ) $ 4.11     NM      
                       
                       
STATISTICS:                      
                       
Permanent placement revenue (included in revenue from services) $ 34.6   $ 19.8   $ 14.8     74.1   % 70.0   %
                       
Gross profit rate   18.0   % 18.4   % (0.4 ) pts.        
                       
Conversion rate   5.5   % (24.4 ) % 29.9   pts.        
                       
Adjusted EBITDA $ 39.1   $ 35.4   $ 3.7            
Adjusted EBITDA margin   1.6   % 1.6   %   pts.        
                       
Effective income tax rate   13.8   % 24.5   % (10.7 ) pts.        
                       
Average number of shares outstanding (millions):                      
Basic   39.4     39.2                
Diluted   39.5     39.2                


KELLY SERVICES, INC. AND SUBSIDIARIES
RESULTS OF OPERATIONS BY SEGMENT
(UNAUDITED)
(In millions of dollars)
                     
    Second Quarter
                     
              %   CC %  
    2021     2020   Change   Change  
Professional & Industrial                    
Revenue from services $ 466.5     $ 406.4     14.8   % 14.0   %
Gross profit   75.2       78.9     (4.7 )   (5.5 )  
SG&A expenses excluding restructuring charges   69.0       64.6     6.8     6.2    
Restructuring charges             NM   NM  
Total SG&A expenses   69.0       64.6     6.9     6.2    
Earnings (loss) from operations   6.2       14.3     (57.0 )      
Earnings (loss) from operations excluding restructuring charges   6.2       14.3     (56.9 )      
                     
Gross profit rate   16.1   %   19.4   % (3.3 ) pts.    
                     
Science, Engineering & Technology                    
Revenue from services $ 298.2     $ 247.3     20.6   % 20.1   %
Gross profit   66.5       50.6     31.5     31.1    
SG&A expenses excluding restructuring charges   46.9       31.3     49.7     49.3    
Restructuring charges             NM   NM  
Total SG&A expenses   46.9       31.3     49.7     49.3    
Earnings (loss) from operations   19.6       19.3     1.8        
Earnings (loss) from operations excluding restructuring charges   19.6       19.3     1.8        
                     
Gross profit rate   22.3   %   20.4   % 1.9   pts.    
                     
Education                    
Revenue from services $ 105.9     $ 25.1     322.1   % 322.1   %
Gross profit   16.8       4.3     291.1     291.1    
SG&A expenses excluding restructuring charges   15.3       9.6     60.0     60.0    
Restructuring charges         (0.1 )   NM   NM  
Total SG&A expenses   15.3       9.5     60.5     60.5    
Earnings (loss) from operations   1.5       (5.2 )   NM      
Earnings (loss) from operations excluding restructuring charges   1.5       (5.3 )   NM      
                     
Gross profit rate   15.8   %   17.1   % (1.3 ) pts.    
                     
Outsourcing & Consulting                    
Revenue from services $ 107.3     $ 83.6     28.2   % 26.1   %
Gross profit   34.8       29.2     19.3     15.7    
SG&A expenses excluding restructuring charges   30.1       25.1     19.8     17.0    
Restructuring charges             NM   NM  
Total SG&A expenses   30.1       25.1     19.7     17.0    
Earnings (loss) from operations   4.7       4.1     16.2        
Earnings (loss) from operations excluding restructuring charges   4.7       4.1     15.9        
                     
Gross profit rate   32.5   %   34.9   % (2.4 ) pts.    
                     
International                    
Revenue from services $ 280.4     $ 213.0     31.6   % 21.6   %
Gross profit   37.7       26.2     43.8     32.9    
SG&A expenses excluding restructuring charges   34.6       28.3     22.3     13.3    
Restructuring charges             NM   NM  
Total SG&A expenses   34.6       28.3     22.3     13.3    
Earnings (loss) from operations   3.1       (2.1 )   NM      
Earnings (loss) from operations excluding restructuring charges   3.1       (2.1 )   NM      
                     
Gross profit rate   13.4   %   12.3   % 1.1   pts.    


KELLY SERVICES, INC. AND SUBSIDIARIES
RESULTS OF OPERATIONS BY SEGMENT
(UNAUDITED)
(In millions of dollars)
                     
    June Year to Date
                     
              %   CC %  
    2021     2020   Change   Change  
Professional & Industrial                    
Revenue from services $ 934.1     $ 900.2     3.8   % 3.2   %
Gross profit   151.1       164.0     (7.9 )   (8.4 )  
SG&A expenses excluding restructuring charges   138.4       140.7     (1.7 )   (2.1 )  
Restructuring charges         4.4     NM   NM  
Total SG&A expenses   138.4       145.1     (4.6 )   (5.0 )  
Earnings (loss) from operations   12.7       18.9     (32.9 )      
Earnings (loss) from operations excluding restructuring charges   12.7       23.3     (45.4 )      
                     
Gross profit rate   16.2   %   18.2   % (2.0 ) pts.    
                     
Science, Engineering & Technology                    
Revenue from services $ 552.9     $ 517.5     6.8   % 6.5   %
Gross profit   119.7       105.3     13.7     13.4    
SG&A expenses excluding restructuring charges   82.6       67.3     22.8     22.5    
Restructuring charges         0.5     NM   NM  
Total SG&A expenses   82.6       67.8     21.8     21.5    
Earnings (loss) from operations   37.1       37.5     (1.1 )      
Earnings (loss) from operations excluding restructuring charges   37.1       38.0     (2.5 )      
                     
Gross profit rate   21.6   %   20.3   % 1.3   pts.    
                     
Education                    
Revenue from services $ 217.5     $ 167.6     29.8   % 29.8   %
Gross profit   34.0       24.7     37.6     37.6    
SG&A expenses excluding restructuring charges   29.5       25.3     16.8     16.8    
Restructuring charges         0.8     NM   NM  
Total SG&A expenses   29.5       26.1     12.9     12.9    
Earnings (loss) from operations   4.5       (1.4 )   NM      
Earnings (loss) from operations excluding restructuring charges   4.5       (0.6 )   NM      
                     
Gross profit rate   15.6   %   14.7   % 0.9   pts.    
                     
Outsourcing & Consulting                    
Revenue from services $ 206.6     $ 173.1     19.3   % 17.5   %
Gross profit   66.1       58.0     14.1     11.0    
Total SG&A expenses   58.5       53.7     8.9     6.6    
Earnings (loss) from operations   7.6       4.3     78.9        
                     
Gross profit rate   32.0   %   33.5   % (1.5 ) pts.    
                     
International                    
Revenue from services $ 553.3     $ 478.2     15.7   % 9.0   %
Gross profit   73.4       60.5     21.3     13.9    
SG&A expenses excluding restructuring charges   67.7       60.4     12.0     5.1    
Restructuring charges         1.1     NM   NM  
Total SG&A expenses   67.7       61.5     10.1     3.3    
Earnings (loss) from operations   5.7       (1.0 )   NM      
Earnings (loss) from operations excluding restructuring charges   5.7       0.1     NM      
                     
Gross profit rate   13.3   %   12.7   % 0.6   pts.    


KELLY SERVICES, INC. AND SUBSIDIARIES
CONSOLIDATED BALANCE SHEETS
(UNAUDITED)
(In millions of dollars)
               
    July 4, 2021   January 3, 2021   June 28, 2020  
Current Assets              
Cash and equivalents $ 64.4   $ 223.0   $ 216.2    
Trade accounts receivable, less allowances of              
 $12.5, $13.3, and $11.2, respectively   1,362.5     1,265.2     1,085.0    
Prepaid expenses and other current assets   82.4     61.4     76.0    
Total current assets   1,509.3     1,549.6     1,377.2    
               
Noncurrent Assets              
Property and equipment, net   37.7     41.0     41.6    
Operating lease right-of-use assets   83.2     83.2     85.8    
Deferred taxes   302.9     282.0     265.9    
Goodwill, net   114.8     3.5        
Investment in Persol Holdings   187.7     164.2     127.2    
Investment in equity affiliate   120.0     118.5     113.6    
Other assets   391.3     319.9     307.4    
Total noncurrent assets   1,237.6     1,012.3     941.5    
               
Total Assets $ 2,746.9   $ 2,561.9   $ 2,318.7    
               
Current Liabilities              
Short-term borrowings $ 0.1   $ 0.3   $ 0.3    
Accounts payable and accrued liabilities   612.6     536.8     463.6    
Operating lease liabilities   19.6     19.6     19.5    
Accrued payroll and related taxes   337.0     293.0     210.7    
Accrued workers’ compensation and other claims   22.0     22.7     25.6    
Income and other taxes   62.6     53.2     71.7    
Total current liabilities   1,053.9     925.6     791.4    
               
Noncurrent Liabilities              
Operating lease liabilities   67.1     67.5     69.9    
Accrued payroll and related taxes   58.5     58.5     38.4    
Accrued workers’ compensation and other claims   40.8     42.2     45.6    
Accrued retirement benefits   214.6     205.8     180.8    
Other long-term liabilities   68.2     59.3     47.0    
Total noncurrent liabilities   449.2     433.3     381.7    
               
Stockholders’ Equity              
Common stock   40.1     40.1     40.1    
Treasury stock   (15.3 )   (17.1 )   (17.3 )  
Paid-in capital   22.3     21.3     20.5    
Earnings invested in the business   1,212.5     1,162.9     1,122.8    
Accumulated other comprehensive income (loss)   (15.8 )   (4.2 )   (20.5 )  
Total stockholders’ equity   1,243.8     1,203.0     1,145.6    
               
Total Liabilities and Stockholders’ Equity $ 2,746.9   $ 2,561.9   $ 2,318.7    
               
STATISTICS:              
Working Capital $ 455.4   $ 624.0   $ 585.8    
Current Ratio   1.4     1.7     1.7    
Debt-to-capital %   0.0   % 0.0   % 0.0   %
Global Days Sales Outstanding   60     64     61    
Year-to-Date Free Cash Flow $ 42.7   $ 170.5   $ 170.4    


KELLY SERVICES, INC. AND SUBSIDIARIES
CONSOLIDATED STATEMENTS OF CASH FLOWS
FOR THE 26 WEEKS ENDED JULY 4, 2021 AND JUNE 28, 2020
(UNAUDITED)
(In millions of dollars)
    2021   2020
Cash flows from operating activities:        
Net earnings (loss) $ 49.6   $ (112.1 )
Adjustments to reconcile net earnings (loss) to net cash from operating activities:        
Goodwill impairment charge       147.7  
Deferred income taxes on goodwill impairment charge       (23.0 )
Depreciation and amortization   14.1     12.0  
Operating lease asset amortization   10.7     10.5  
Provision for credit losses and sales allowances       0.1  
Stock-based compensation   2.8     2.4  
(Gain) loss on investment in Persol Holdings   (36.3 )   48.2  
Gain on sale of assets       (32.1 )
Equity in net (earnings) loss of PersolKelly Pte. Ltd.   (0.6 )   2.8  
Other, net   2.2     0.8  
Changes in operating assets and liabilities, net of acquisitions   5.1     120.8  
         
Net cash from operating activities   47.6     178.1  
         
Cash flows from investing activities:        
Capital expenditures   (4.9 )   (7.7 )
Proceeds from company-owned life insurance   10.4     2.3  
Proceeds from sale of assets       55.5  
Acquisition of companies, net of cash received   (219.0 )   (36.4 )
Proceeds (payments) related to loans with equity affiliate   5.8      
Proceeds from (investment in) equity securities   5.0      
Other investing activities   1.0     (0.4 )
         
Net cash (used in) from investing activities   (201.7 )   13.3  
         
Cash flows from financing activities:        
Net change in short-term borrowings   (0.1 )   (1.4 )
Financing lease payments   (0.3 )   (0.6 )
Payments of tax withholding for stock awards   (0.6 )   (1.1 )
Dividend payments       (3.0 )
Other financing activities       (0.1 )
         
Net cash used in financing activities   (1.0 )   (6.2 )
         
Effect of exchange rates on cash, cash equivalents and restricted cash   (2.3 )   5.7  
         
Net change in cash, cash equivalents and restricted cash   (157.4 )   190.9  
Cash, cash equivalents and restricted cash at beginning of period   228.1     31.0  
         
Cash, cash equivalents and restricted cash at end of period $ 70.7   $ 221.9  


KELLY SERVICES, INC. AND SUBSIDIARIES
REVENUE FROM SERVICES BY GEOGRAPHY
(UNAUDITED)
(In millions of dollars)
                   
    Second Quarter  
                   
            %   CC %  
    2021   2020   Change   Change  
                   
Americas                  
United States $ 894.6   $ 700.1     27.8   % 27.8   %
Canada   39.5     25.6     54.4     36.8    
Mexico   33.1     22.5     47.2     26.2    
Puerto Rico   26.9     20.0     34.3     34.3    
Brazil       6.1     NM   NM  
Total Americas Region   994.1     774.3            
                   
Europe                  
France   57.5     39.9     44.2     31.7    
Switzerland   54.0     47.4     13.8     7.5    
Portugal   40.6     23.8     70.7     55.9    
Russia   33.7     29.3     15.2     17.9    
Italy   19.4     13.3     46.1     33.6    
United Kingdom   17.7     17.8     (0.6 )   (11.8 )  
Germany   8.5     7.1     20.6     10.3    
Ireland   6.3     4.1     53.5     40.2    
Other   17.0     11.5     47.7     32.9    
Total Europe Region   254.7     194.2     31.2     22.3    
                   
Total Asia-Pacific Region   9.3     6.8     34.5     20.9    
                   
Total Kelly Services, Inc. $ 1,258.1   $ 975.3     29.0   % 26.2   %


KELLY SERVICES, INC. AND SUBSIDIARIES
REVENUE FROM SERVICES BY GEOGRAPHY
(UNAUDITED)
(In millions of dollars)
                   
    June Year to Date  
                   
            %   CC %  
    2021   2020   Change   Change  
                   
Americas                  
United States $ 1,753.1   $ 1,628.6     7.6   % 7.6   %
Canada   73.6     58.4     26.0     15.1    
Mexico   67.7     51.2     32.3     25.3    
Puerto Rico   51.1     37.7     35.3     35.3    
Brazil       15.2     NM   NM  
Total Americas Region   1,945.5     1,791.1     8.6     8.1    
                   
Europe                  
France   111.8     92.4     21.0     10.7    
Switzerland   106.7     91.6     16.4     9.6    
Portugal   84.3     67.4     25.1     14.5    
Russia   66.3     61.4     8.1     15.9    
Italy   37.5     28.0     33.9     22.6    
United Kingdom   34.7     40.1     (13.4 )   (21.4 )  
Germany   15.6     15.1     3.6     (5.2 )  
Ireland   11.4     9.1     25.6     14.9    
Other   32.6     26.7     22.1     11.9    
Total Europe Region   500.9     431.8     16.0     9.2    
                   
Total Asia-Pacific Region   17.6     13.5     29.8     16.9    
                   
Total Kelly Services, Inc. $ 2,464.0   $ 2,236.4     10.2   % 8.3   %


KELLY SERVICES, INC. AND SUBSIDIARIES
RECONCILIATION OF NON-GAAP MEASURES
SECOND QUARTER
(UNAUDITED)
(In millions of dollars)
       
  2021   2020
SG&A Expenses: As Reported   Adjusted
Professional & Industrial $ 69.0     $ 64.6  
Science, Engineering & Technology 46.9     31.3  
Education 15.3     9.6  
Outsourcing & Consulting 30.1     25.1  
International 34.6     28.3  
Corporate 21.4     19.4  
Total Company $ 217.3     $ 178.3  


  2021   2020
Earnings (loss) from Operations: As Reported   Adjusted
Professional & Industrial $ 6.2     $ 14.3  
Science, Engineering & Technology 19.6     19.3  
Education 1.5     (5.3 )
Outsourcing & Consulting 4.7     4.1  
International 3.1     (2.1 )
Corporate (21.4 )   (19.4 )
Total Company $ 13.7     $ 10.9  


KELLY SERVICES, INC. AND SUBSIDIARIES
RECONCILIATION OF NON-GAAP MEASURES
SECOND QUARTER
(UNAUDITED)
(In millions of dollars)
           
  2020
SG&A Expenses: As Reported   Restructuring(4)   Adjusted
Professional & Industrial $ 64.6     $     $ 64.6  
Science, Engineering & Technology 31.3         31.3  
Education 9.5     0.1     9.6  
Outsourcing & Consulting 25.1         25.1  
International 28.3         28.3  
Corporate 19.3     0.1     19.4  
Total Company $ 178.1     $ 0.2     $ 178.3  


  2020
Earnings (loss) from Operations: As Reported   Restructuring(4)   Adjusted
Professional & Industrial $ 14.3     $     $ 14.3  
Science, Engineering & Technology 19.3         19.3  
Education (5.2 )   (0.1 )   (5.3 )
Outsourcing & Consulting 4.1         4.1  
International (2.1 )       (2.1 )
Corporate (19.3 )   (0.1 )   (19.4 )
Total Company $ 11.1     $ (0.2 )   $ 10.9  


KELLY SERVICES, INC. AND SUBSIDIARIES
RECONCILIATION OF NON-GAAP MEASURES
JUNE YEAR TO DATE
(UNAUDITED)
(In millions of dollars)
       
  2021   2020
SG&A Expenses: As Reported   Adjusted
Professional & Industrial $ 138.4     $ 140.7  
Science, Engineering & Technology 82.6     67.3  
Education 29.5     25.3  
Outsourcing & Consulting 58.5     53.7  
International 67.7     60.4  
Corporate 43.3     41.7  
Total Company $ 420.0     $ 389.1  


  2021   2020
Earnings (loss) from Operations: As Reported   Adjusted
Professional & Industrial $ 12.7     $ 23.3  
Science, Engineering & Technology 37.1     38.0  
Education 4.5     (0.6 )
Outsourcing & Consulting 7.6     4.3  
International 5.7     0.1  
Corporate (43.3 )   (41.7 )
Total Company $ 24.3     $ 23.4  


KELLY SERVICES, INC. AND SUBSIDIARIES
RECONCILIATION OF NON-GAAP MEASURES
JUNE YEAR TO DATE
(UNAUDITED)
(In millions of dollars)
           
  2020
SG&A Expenses: As Reported   Restructuring(4)   Adjusted
Professional & Industrial $ 145.1     $ (4.4 )   $ 140.7  
Science, Engineering & Technology 67.8     (0.5 )   67.3  
Education 26.1     (0.8 )   25.3  
Outsourcing & Consulting 53.7         53.7  
International 61.5     (1.1 )   60.4  
Corporate 43.4     (1.7 )   41.7  
Total Company $ 397.6     $ (8.5 )   $ 389.1  


  2020
Earnings (loss) from Operations: As Reported   Goodwill
impairment
(1)
  Gain on sale
of assets(3)
  Restructuring(4)   Adjusted
Professional & Industrial $ 18.9     $     $     $ 4.4     $ 23.3  
Science, Engineering & Technology 37.5             0.5     38.0  
Education (1.4 )           0.8     (0.6 )
Outsourcing & Consulting 4.3                 4.3  
International (1.0 )           1.1     0.1  
Corporate (159.0 )   147.7     (32.1 )   1.7     (41.7 )
Total Company $ (100.7 )   $ 147.7     $ (32.1 )   $ 8.5     $ 23.4  


KELLY SERVICES, INC. AND SUBSIDIARIES
RECONCILIATION OF NON-GAAP MEASURES (continued)
(UNAUDITED)
(In millions of dollars except per share data)
                 
                 
    Second Quarter   June Year to Date
    2021   2020   2021   2020
Income tax expense (benefit)   $ (2.6 )   $ 0.9     $ 7.9     $ (35.3 )
Taxes on goodwill impairment charge(1)               23.0  
Taxes on investment in Persol Holdings(2)   (1.9 )   (9.0 )   (11.1 )   14.8  
Taxes on gain on sale of assets(3)               (8.1 )
Taxes on restructuring charges(4)               2.2  
Adjusted income tax expense (benefit)   $ (4.5 )   $ (8.1 )   $ (3.2 )   $ (3.4 )
                 
    Second Quarter   June Year to Date
    2021   2020   2021   2020
Net earnings (loss)   $ 24.0     $ 41.1     $ 49.6     $ (112.1 )
Goodwill impairment charge, net of taxes(1)               124.7  
(Gain) loss on investment in Persol Holdings, net of taxes(2)   (4.4 )   (20.6 )   (25.2 )   33.4  
Gain on sale of assets, net of taxes(3)               (24.0 )
Restructuring charges, net of taxes(4)       (0.2 )       6.3  
Adjusted net earnings   $ 19.6     $ 20.3     $ 24.4     $ 28.3  
                 
    Second Quarter   June Year to Date
    2021   2020   2021   2020
    Per Share   Per Share
Net earnings (loss)   $ 0.60     $ 1.04     $ 1.25     $ (2.86 )
Goodwill impairment charge, net of taxes(1)               3.18  
(Gain) loss on investment in Persol Holdings, net of taxes(2)   (0.11 )   (0.52 )   (0.63 )   0.85  
Gain on sale of assets, net of taxes(3)               (0.61 )
Restructuring charges, net of taxes(4)               0.16  
Adjusted net earnings   $ 0.49     $ 0.51     $ 0.61     $ 0.72  

Note: Earnings per share amounts for each quarter are required to be computed independently and may not equal the amounts computed for the total year.


KELLY SERVICES, INC. AND SUBSIDIARIES
RECONCILIATION OF NON-GAAP MEASURES (continued)
(UNAUDITED)
(In millions of dollars)
               
  Second Quarter   June Year to Date
  2021   2020   2021   2020
Net earnings (loss) $ 24.0       $ 41.1       $ 49.6       $ (112.1 )  
Other (income) expense, net 0.3       (2.6 )     3.7       (4.3 )  
Income tax expense (benefit) (2.6 )     0.9       7.9       (35.3 )  
Depreciation and amortization 8.5       6.0       14.8       12.0    
EBITDA 30.2       45.4       76.0       (139.7 )  
Equity in net (earnings) loss of affiliate (1.7 )     1.3       (0.6 )     2.8    
Goodwill impairment charge(1)                   147.7    
(Gain) loss on investment in Persol Holdings(2) (6.3 )     (29.6 )     (36.3 )     48.2    
Gain on sale of assets(3)                   (32.1 )  
Restructuring(4)       (0.2 )           8.5    
Adjusted EBITDA $ 22.2       $ 16.9       $ 39.1       $ 35.4    
Adjusted EBITDA margin 1.8   %   1.7   %   1.6   %   1.6   %


KELLY SERVICES, INC. AND SUBSIDIARIES
RECONCILIATION OF NON-GAAP MEASURES
(UNAUDITED)

Management believes that the non-GAAP (Generally Accepted Accounting Principles) information excluding the 2020 goodwill impairment charge, the 2021 and 2020 gains and losses on the investment in Persol Holdings, the 2020 gain on sale of assets and the 2020 restructuring charges, are useful to understand the Company’s fiscal 2021 financial performance and increases comparability. Specifically, Management believes that removing the impact of these items allows for a meaningful comparison of current period operating performance with the operating results of prior periods. Management also believes that such measures are used by those analyzing performance of companies in the staffing industry to compare current performance to prior periods and to assess future performance.

Management uses Adjusted EBITDA (adjusted earnings before interest, taxes, depreciation and amortization) and Adjusted EBITDA Margin (percent of total GAAP revenue) which Management believes is useful to compare operating performance compared to prior periods and uses it in conjunction with GAAP measures to assess performance. Our calculation of Adjusted EBITDA may not be consistent with similarly titled measures of other companies and should be used in conjunction with GAAP measurements.

These non-GAAP measures may have limitations as analytical tools because they exclude items which can have a material impact on cash flow and earnings per share. As a result, Management considers these measures, along with reported results, when it reviews and evaluates the Company’s financial performance. Management believes that these measures provide greater transparency to investors and provide insight into how Management is evaluating the Company’s financial performance. Non-GAAP measures should not be considered a substitute for, or superior to, measures of financial performance prepared in accordance with GAAP.

(1) The goodwill impairment charge is the result of an interim impairment test the Company performed during the first quarter of 2020, due to a triggering event caused by a decline in the Company’s common stock price.

(2) The gains and losses on the investment in Persol Holdings represent the change in fair value of the investment during the period presented and the related tax expense and benefit.

(3) Gain on sale of assets in 2020 primarily represents the excess of the proceeds over the cost of the headquarters properties sold during the first quarter of 2020.

(4) Restructuring charges in 2020 represent severance costs and lease terminations in preparation for the new operating model adopted in the third quarter of 2020.

CoreCivic Inc. (CXW) – Post Call Follow Up and Updated Models

Wednesday, August 11, 2021

CoreCivic, Inc. (CXW)
Post Call Follow Up and Updated Models

CoreCivic is a diversified government solutions company with the scale and experience needed to solve tough government challenges in flexible, cost-effective ways. We provide a broad range of solutions to government partners that serve the public good through corrections and detention management, a growing network of residential reentry centers to help address America’s recidivism crisis, and government real estate solutions. We are a publicly traded real estate investment trust and the nation’s largest owner of partnership correctional, detention and residential reentry facilities. We also believe we are the largest private owner of real estate used by U.S. government agencies. The Company has been a flexible and dependable partner for government for more than 35 years. Our employees are driven by a deep sense of service, high standards of professionalism and a responsibility to help government better the public good.

Joe Gomes, Senior Research Analyst, Noble Capital Markets, Inc.

Refer to the full report for the price target, fundamental analysis, and rating.

    ICE Populations and Revenue Climbing. ICE populations at CoreCivic have roughly doubled since the beginning of the year. We would note that revenue derived from ICE in the second quarter was $139.6 million, up from $135.7 million in the same period last year, and up from $131.5 million in the first quarter. Management stated that ICE populations overall remained about 2,200 below the contract minimums, although this is down from 3,200 at the end of the first quarter.

    Safety Segment Improving.  Safety segment revenue declined modestly to $419.9 million from $424.1 million. Safety’s facility net operating income, however, increased to $112.6 million from $100.4 million during the second quarter of 2020. Increased per diem rates and lower COVID related operating expenses drove the improvement. Revenue per compensated man day rose to $90.88 in the quarter, up from …


This Company Sponsored Research is provided by Noble Capital Markets, Inc., a FINRA and S.E.C. registered broker-dealer (B/D).

*Analyst certification and important disclosures included in the full report. NOTE: investment decisions should not be based upon the content of this research summary.  Proper due diligence is required before making any investment decision. 

CoreCivic, Inc. (CXW) – Post Call Follow Up and Updated Models

Wednesday, August 11, 2021

CoreCivic, Inc. (CXW)
Post Call Follow Up and Updated Models

CoreCivic is a diversified government solutions company with the scale and experience needed to solve tough government challenges in flexible, cost-effective ways. We provide a broad range of solutions to government partners that serve the public good through corrections and detention management, a growing network of residential reentry centers to help address America’s recidivism crisis, and government real estate solutions. We are a publicly traded real estate investment trust and the nation’s largest owner of partnership correctional, detention and residential reentry facilities. We also believe we are the largest private owner of real estate used by U.S. government agencies. The Company has been a flexible and dependable partner for government for more than 35 years. Our employees are driven by a deep sense of service, high standards of professionalism and a responsibility to help government better the public good.

Joe Gomes, Senior Research Analyst, Noble Capital Markets, Inc.

Refer to the full report for the price target, fundamental analysis, and rating.

    ICE Populations and Revenue Climbing. ICE populations at CoreCivic have roughly doubled since the beginning of the year. We would note that revenue derived from ICE in the second quarter was $139.6 million, up from $135.7 million in the same period last year, and up from $131.5 million in the first quarter. Management stated that ICE populations overall remained about 2,200 below the contract minimums, although this is down from 3,200 at the end of the first quarter.

    Safety Segment Improving.  Safety segment revenue declined modestly to $419.9 million from $424.1 million. Safety’s facility net operating income, however, increased to $112.6 million from $100.4 million during the second quarter of 2020. Increased per diem rates and lower COVID related operating expenses drove the improvement. Revenue per compensated man day rose to $90.88 in the quarter, up from …


This Company Sponsored Research is provided by Noble Capital Markets, Inc., a FINRA and S.E.C. registered broker-dealer (B/D).

*Analyst certification and important disclosures included in the full report. NOTE: investment decisions should not be based upon the content of this research summary.  Proper due diligence is required before making any investment decision.