Image: MichaelGoodin (Flickr)

Fannie Mae’s Latest Survey Highlights Pessimism in the Real Estate Market
Good time to buy? Good time to sell? Unlike the stock or even bond market, the real estate market can’t always be avoided. None of us “need” an investment account, but we all could use shelter from the rain and a safe place to sleep. Having said that, all markets are related. When the values of homes go up, households feel wealthier and more confident in their spending. This drives economic growth and stock valuations. When valuations go down, people are less likely to make improvements and have less equity to borrow from for purchases. So real estate is an important market for stock market investors to pay attention to.
The Federal National Mortgage Association, Fannie Mae (FNMA) just released two survey results on housing optimism/pessimism that are of value to anyone who has investments. The surveys measure attitudes and expectations. The results highlight the highest reading ever recorded in a couple of categories.
The surveys are the National Housing Survey and the Home Purchaser Sentiment Survey Index.
What Fannie Mae’s National Housing Survey Tells Us
Consumer attitudes are measured in the NHS through a telephone poll of approximately 1,000 households to assess their attitudes toward owning and renting a home, home and rental price changes, homeownership distress, the economy, household finances, and overall consumer confidence. Homeowners and renters are asked more than 100 questions designed to track attitude changes
The most recent survey answers were collected between March 1 and March 24, 2022.
What Fannie Mae’s Home Purchase Sentiment Index Tells Us
The HPSI creates a single number using information about consumers’ home purchase sentiment from Fannie Mae’s National Housing Survey which it weights. The number reflects consumers’ current views and forward-looking expectations of housing market conditions. It is distilled from six questions that answer consumers’ overall thoughts on, do they think that it is a good or bad time to buy or sell a house, what direction they expect home prices and mortgage interest rates to move, how concerned they are about losing their jobs, and whether their incomes are higher than they were a year earlier.
What Fannie Mae Learned
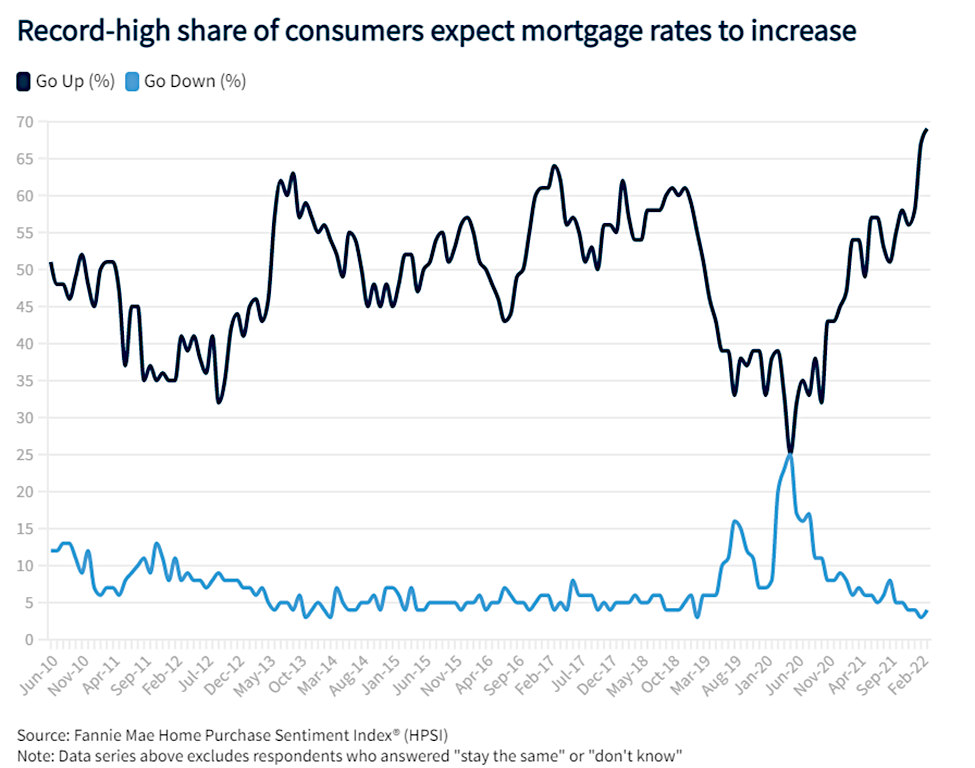
69% of respondents expect mortgage rates to go up in the next 12 months
The Home Purchase Sentiment Index decreased by 2.1 points to 73.2 in March, as consumers continue to be pessimistic regarding the direction of mortgage rates and the homebuying climate. Overall, four of the index’s six components decreased month over month, including the components asking consumers whether they expect mortgage rates to go up and whether they believe it’s a good time to buy a home. On the whole, the “Good Time to Buy” component set a new survey low, with 73% of respondents reporting that it’s a bad time to buy a home.
Year over year, the HPSI index is down 8.5 points.
Only 24% of consumers believe it’s a good time to buy a home, with similar levels of pessimism expressed by nearly all of the demographic groups surveyed.
In March the survey also broke a new high of consumers expecting their financial situations to worsen over the next year; this was especially true among current homeowners. These concerns, together with the run-up in mortgage rates since the end of 2021, will likely lower mortgage demand from move-up buyers – and fewer move-up buyers mean fewer available entry-level homes. This adds to the rising-rate hurdles for potential first-time homebuyers. If consumer pessimism toward homebuying conditions continues and the recent mortgage rate increases are sustained, then there can be an accelerated cooling of the housing market.
Granular Details
Good/Bad Time to Buy: The percentage of those surveyed who said it’s a good time to buy a home decreased from 29% to 24%, while the percentage who said it is a bad time to buy increased from 67% to 73%. As a result, the net of those who say it is a good time to buy decreased 11 percentage points month over month.
Good/Bad Time to Sell: The percentage of respondents who say it is a good time to sell a home increased from 72% to 74%, while the percentage who say it’s a bad time to sell decreased from 22% to 21%. As a result, the net share of those who say it is a good time to sell increased 3 percentage points month over month.
Home Price Expectations: The percentage of respondents who say home prices will go up in the next 12 months increased from 46% to 48%, while the percentage who say home prices will go down increased from 16% to 20%. The share who think home prices will stay the same decreased from 32% to 28%. As a result, the net share of Americans who say home prices will go up decreased 2 percentage points month over month.
Mortgage Rate Expectations: The percentage of respondents who say mortgage rates will go down in the next 12 months increased from 3% to 4%, while the percentage who expect mortgage rates to go up increased from 67% to 69%. The share who think mortgage rates will stay the same increased from 22% to 23%. As a result, the net share of Americans who say mortgage rates will go down over the next 12 months decreased 1 percentage point month over month.
Job Concerns: The percentage of respondents who say they are not concerned about losing their job in the next 12 months decreased from 87% to 86%, while the percentage who say they are concerned increased from 9% to 11%. As a result, the net share of Americans who say they are not concerned about losing their job decreased 3 percentage points month over month.
Household Income: The percentage of respondents who say their household income is significantly higher than it was 12 months ago increased from 27% to 29%, while the percentage who say their household income is significantly lower increased from 12% to 13%. The percentage who say their household income is about the same decreased from 56% to 53%. As a result, the net share of those who say their household income is significantly higher than it was 12 months ago increased 1 percentage point month over month.
Take-Away
Economic activity impacts stock prices. Stock prices impact households’ views on their wealth and whether they should open their pocketbooks and stimulate the economy or retrench. Consumers’ views on their home values or ability to buy or rent impact spending patterns and economic activity as well. Real Estate investors are right to watch the bond market for clues related to interest rates that impact mortgage lending. For the same reason, stock market investors should keep aware of what is going on in both the fixed income sector and housing market.
Managing Editor, Channelchek
Suggested Reading
 Understanding Family Offices
|
 Morningstar Analyst Peeks Behind AARK Curtain and Calls Fund Wretched
|
 Is Company Sponsored Research the Future for Small-Cap Stock Investors?
|
 Are Small-Cap Stocks Smart Investments?
|
Sources
https://www.fanniemae.com/media/43251/display
Stay up to date. Follow us:

|