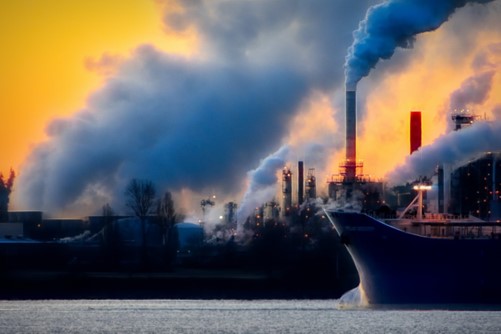
Image Credit: Chris LeBoutillier (Pexels)
SEC’s Climate Disclosure Plan Could be in Trouble After a Recent Supreme Court Ruling – The Bigger Question – Does Disclosure Work?
The U.S. Securities and Exchange Commission is considering requiring publicly traded U.S. companies to disclose the climate-related risks they face. Republican state officials, emboldened by a recent Supreme Court
ruling, are already threatening to sue, claiming regulators don’t have the authority.
While the debate heats up, what’s surprisingly missing is a discussion about whether disclosures actually influence corporate behavior.
An underlying premise of financial disclosures is that what gets measured is more likely to be managed. But do corporations that disclose climate change information actually reduce their carbon footprints?
| This article was republished with permission from The Conversation, a news site dedicated to sharing ideas from academic experts. It was written by and represents the research-based opinions of Lily Hsueh, Associate Professor of Economics and Public Policy, Arizona State University. |
I’m a professor of economics and public policy, and my research shows that while carbon disclosure encourages some improvement, it is not enough by itself to ensure that companies’ greenhouse gas emissions fall. Worse still, some companies use it to obfuscate and enable greenwashing – false or misleading advertising claiming a company is more environmentally or socially responsible than it really is.
I believe the SEC has an unprecedented opportunity to design a program that is greenwashing-resistant.
Disclosure Doesn’t Always Mean Less Carbon
Although carbon disclosure is often held up as an indicator of corporate social responsibility, the data tells a more nuanced story.
I investigated the carbon disclosures made by nearly 600 companies that were listed in the S&P 500 index at least once between 2011 and 2016. The disclosures were made to CDP, formerly the Carbon Disclosure Project, a nonprofit organization that surveys companies and governments about their carbon emissions and management. More than half of all S&P 500 firms respond to its requests for information.
At first glance, one might think that a mandated, unified framework for reporting companies’ climate management and risk data and their greenhouse gas emissions, such as the one proposed by the SEC, is likely to lead to more efficient use of fossil fuels, lowering emissions as the economy grows.
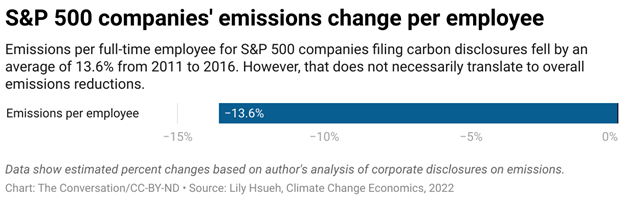
I did find that companies that have proactively disclosed their emissions to CDP on average reduced their entitywide carbon emissions intensity by at least one measure: carbon emissions per capita of full-time employees. This means that as a company increases in size, it is estimated to reduce its carbon footprint on a per-employee basis. This does not, however, necessarily translate to a reduction in a company’s overall carbon emissions. Much of the decline involved large emissions-intensive companies, such as utilities, that were trying to get ahead of expected climate regulations.
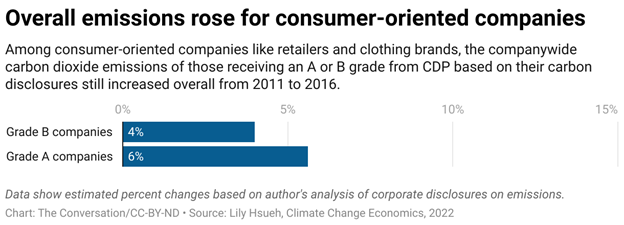
Companies that received a “B” grade from CDP increased their entitywide carbon emissions on average over that time. Notably, those in the financial, health care and other consumer-oriented sectors that did not experience the same level of regulatory pressure as greenhouse gas-intensive firms led the increase.
About a quarter of the S&P 500 companies that completed CDP’s annual climate change survey undertook assessments of their business impacts on the environment and integrated climate risk management into their business strategy. Yet entitywide emissions still increased.
Earlier research found similar results in the first decade of the U.S. Department of Energy’s Voluntary Greenhouse Gas Registry. Overall, it found that participating in the registry had no significant effect on the companies’ carbon emissions intensity, but that many of the companies, by being selective in what they reported, reported emissions reductions.
Another study, which focused on the power sector’s participation in CDP’s surveys, found an increase in carbon intensity.
‘A-List’ May Not be Exempt from Greenwashing
Even companies that made CDP’s coveted “A-List” of climate leaders may not necessarily be free of greenwashing.
A company earns an “A” grade when it has met criteria of disclosure, awareness, management and leadership, including adopting global best practices, such as a science-based emissions target, regardless of whether these practices translate into improved environmental performance.
Because CDP grades companies based on sustainability outputs rather than outcomes, an “A-list” company could be “carbon neutral” when it counts only the facilities it owns and not the factories that make its products. Moreover, a company that has earned an “A” could commit to removing all emitted carbon but maintain partnerships with oil and gas companies to “generate new exploration opportunities”.
Retail and apparel giants Walmart, Target and Nike – all in the “B” to “A-minus” range in recent years – offer an example of the challenge.
They regularly disclose their carbon management plans and emissions to CDP. But they are also part of the industry-led Sustainable Apparel Coalition, which has controversially portrayed petroleum-based synthetics as the most sustainable choice above natural fibers in the Higgs Index, a supply chain measurement tool that some clothing companies use to show a social and environmental footprint to consumers. Walmart has been sued by the Federal Trade Commission over products described as bamboo and “eco-friendly and sustainable” that were made from rayon, a semi-synthetic fiber made using toxic chemicals.
Designing a Greenwashing-Resistant Disclosure Program
I see three key ways for the SEC to design a climate disclosure program that is greenwashing-resistant.
First, misinformation or disinformation about ESG – environmental, social and governance factors – can be minimized if companies are given clear guidelines on what constitutes a low-carbon initiative.
Second, companies can be required to benchmark their emission targets based on historical emissions, undergo independent audits and report concrete changes.
It’s important to clearly define “carbon footprint” so these metrics are comparable among companies and over time. For example, there are different types of emissions: Scope 1 emissions are the direct emissions coming out of a firm’s chimneys and tailpipes. Scope 2 emissions are associated with the power a company consumes. Scope 3 is harder to measure – it includes emissions in a company’s supply chain and through the use of its products, such as gasoline used in cars. It reflects the complexity of the modern supply chain.
Finally, companies could be asked to disclose a fixed deadline for phasing out fossil fuel assets. This will better ensure that pledges translate into concrete actions in a timely and transparent manner.
Ultimately, investors and financial markets need accurate and verifiable information to assess their investments’ future risk and determine for themselves whether net-zero pledges made by companies are credible.
There is now momentum across the globe to hold companies accountable for their emissions and climate pledges. Disclosure rules have been introduced in the United Kingdom, European Union and New Zealand, and in Asian business hubs like Singapore and Hong Kong. When countries have similar policies, allowing for consistency, comparability and verifiability, there will be fewer opportunities for loopholes and exploitation, and I believe our climate and economy will be better for it.
Suggested Content
 Supreme Court Reels in Federal Agencies Overstepping Delegated Power
|
 ESG Growing Pains Include Greenwashing
|
 The Rising Cost of Servicing the Same Debt for the U.S. Treasury
|
 Can Mining be Geen and Sustainable?
|
Stay up to date. Follow us:

|