TROY, Mich., Feb. 2, 2023 /PRNewswire/ — Kelly (Nasdaq: KELYA, KELYB), a leading specialty talent solutions provider, will release its fourth-quarter and full-year earnings before the market opens on Thursday, February 16, 2023. In conjunction with its fourth-quarter and full-year earnings release, Kelly will publish a financial presentation on the Investor Relations page of its public website and will host a conference call at 9 a.m. ET.
The call may be accessed in one of the following ways:
Via the Telephone (877) 692-8955 (toll free) or (234) 720-6979 (caller paid) Enter access code 5728672 After the prompt, please enter ”#”
A recording of the conference call will be available after 2:30 p.m. ET on February 16, 2023, at (866) 207-1041 (toll-free) and (402) 970-0847 (caller-paid). The access code is 1472042#. The recording will also be available at kellyservices.com during this period.
About Kelly®
Kelly Services, Inc. (Nasdaq: KELYA, KELYB) connects talented people to companies in need of their skills in areas including Science, Engineering, Education, Office, Contact Center, Light Industrial, and more. We’re always thinking about what’s next in the evolving world of work, and we help people ditch the script on old ways of thinking and embrace the value of all workstyles in the workplace. We directly employ more than 350,000 people around the world, and we connect thousands more with work through our global network of talent suppliers and partners in our outsourcing and consulting practice. Revenue in 2021 was $4.9 billion. Visit kellyservices.com and let us help with what’s next for you.
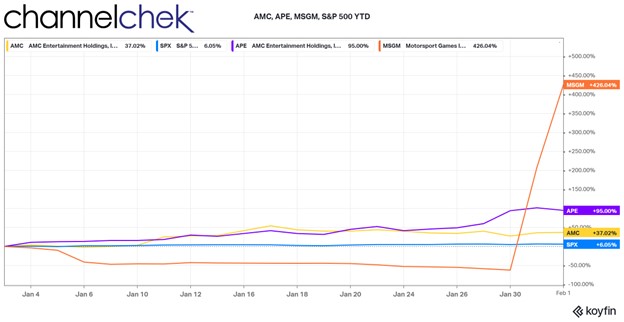
Corporate Debt for Equity Swap Announcements Can Have an Immediate Impact on Share Price
AMC Theatres (AMC, APE) announced plans to hold a meeting in mid-March on capital restructuring. One of the expected outcomes is a plan to swap equity for some outstanding debt. APE shares jumped after the announcement. Another company this week, Motorsports Games (MSGM), shares skyrocketed triple-digits after its announcement to shore up company finances with a debt-for-equity swap. What is a debt/equity swap, and does it always lead to strengthening share prices?
Debt for Equity Swap Basics
Two methods by which companies finance their operations, growth, or other investment is by issuing stock (equity), or borrowing (debt). Both have advantages and disadvantages. One reason a company may swap equity for debt is to restructure and reduce borrowings with a creditor. Perhaps cash flow is tight and restrictive, yet the entity is still viable. Cutting interest costs frees capital and may even help the lender avoid problems receiving timely payments.
The company may also use the method to strengthen its balance sheet by altering the proportion of debt to equity.
Motorsports Games Swap
In the case of Motorsports Games (MSGM), the company had fallen out of compliance with the rules required to maintain a listing on the Nasdaq exchange. MSGMs change in corporate financing allowed it to move back into full compliance with Nasdaq, while repaying $1 million in debt with 338,983 shares of stock. The move has the added benefit of increasing liquidity and reducing interest expense.
According to a research note by Mike Kupinski, Director of Research at Noble Capital Markets, “Following the swap, the parent company increased its ownership from 700,000 shares to 1,038,983 shares, representing 62.1% of the votes outstanding.” Kupinski said, “The move significantly improves the company’s liquidity and reduces its interest expense. Notably, the move adds confidence that Motorsport Network has confidence in Motorsport Games.”
The CEO of AMC, Adam Aron, has proven to be very creative with financing. The company managed to cash in on a windfall after its share price soared during periods when shorts in the company had been severely squeezed by retail traders. This has left the company with enviable options. The company is planning a capital restructuring, including swapping equity for its debt. Details of this won’t be released until next month after AMC Theatres holds a special meeting on March 14 to discuss the deal.
If past history is any indication, there will be a lot of chatter and trading activity in AMC and APE before and after the meeting.
Take Away
The primary reason for a company to contemplate a debt-to-equity swap is to adjust its financing to improve financial conditions. In some cases, the company finds itself being hurt by the cost of servicing its debt, this offers relief. Avoiding any negative news surrounding missing a payment or even bankruptcy is often an underlying reason.
But there can be as many reasons as there are corporate situations. Motorsports Games seem to have hit a home run for their shareholders and their holding company as its share price is now trading over 700% above where it had been before the announced plans.
The massive increase in share price of MSGM is unusual, gains this large are situation dependent. Maintaining a position on a major exchange certainly fed into the rally in its shares.
BRENTWOOD, Tenn., Jan. 24, 2023 (GLOBE NEWSWIRE) — CoreCivic, Inc. (NYSE: CXW) (the Company) announced today that it will release its 2022 fourth quarter financial results after the market closes on Wednesday, February 8, 2023. A live broadcast of CoreCivic’s conference call will begin at 10:00 a.m. central time (11:00 a.m. eastern time) on Thursday, February 9, 2023.
To participate via telephone and join the call live, please register in advance here https://register.vevent.com/register/BId87fe936f05a41fa8057f46bf4310550. Upon registration, telephone participants will receive a confirmation email detailing how to join the conference call, including the dial-in number and a unique passcode.
Participants may access the audio-only webcast of the conference call from the Company’s website at www.corecivic.com under the “Events & Presentations” section of the “Investors” page. A replay of the webcast will be available for seven days.
About CoreCivic
CoreCivic is a diversified, government-solutions company with the scale and experience needed to solve tough government challenges in flexible, cost-effective ways. We provide a broad range of solutions to government partners that serve the public good through high-quality corrections and detention management, a network of residential and non-residential alternatives to incarceration to help address America’s recidivism crisis, and government real estate solutions. We are the nation’s largest owner of partnership correctional, detention and residential reentry facilities, and believe we are the largest private owner of real estate used by government agencies in the United States. We have been a flexible and dependable partner for government for 40 years. Our employees are driven by a deep sense of service, high standards of professionalism and a responsibility to help government better the public good. Learn more at www.corecivic.com.
Tokens.com Corp is a publicly traded company that invests in Web3 assets and businesses focused on the Metaverse, NFTs, DeFi, and gaming based digital assets. Tokens.com is the majority owner of Metaverse Group, one of the world’s first virtual real estate companies. Hulk Labs, a wholly-owned Tokens.com subsidiary, focuses on investing in play-to-earn revenue generating gaming tokens and NFTs. Additionally, Tokens.com owns and stakes crypto assets to earn additional tokens. Through its growing digital assets and NFTs, Tokens.com provides public market investors with a simple and secure way to gain exposure to Web3.
Joe Gomes, Managing Director – Generalist Analyst, Noble Capital Markets, Inc.
Joshua Zoepfel, Research Associate, Noble Capital Markets, Inc.
Refer to the full report for the price target, fundamental analysis, and rating.
Genesis Global. In a recurring theme in the crypto space lately, last week Genesis Global Holdco LLC, the holding company of troubled cryptocurrency lender Genesis Global Capital, filed for Chapter 11 bankruptcy protection. Notably, in its filing, Genesis Global Capital said it expects that through the restructuring process, there will be money left over to pay unsecured creditors.
Tokens.com Impact. Tokens.com has an open loan facility with Genesis, for which the Company is required to post collateral in token assets. Based on the closing price on January 19, 2023, this collateral was worth US$749,000. Tokens.com has a loan outstanding against this collateral of US$138,000. The difference between the collateral and the loan value represents approximately 3.1% of Tokens.com’s total assets of US$20.0 million as at September 30, 2022. Tokens.com has requested to have its collateral returned and repay the loan outstanding in full.
Equity Research is available at no cost to Registered users of Channelchek. Not a Member? Click ‘Join’ to join the Channelchek Community. There is no cost to register, and we never collect credit card information.
This Company Sponsored Research is provided by Noble Capital Markets, Inc., a FINRA and S.E.C. registered broker-dealer (B/D).
*Analyst certification and important disclosures included in the full report. NOTE: investment decisions should not be based upon the content of this research summary. Proper due diligence is required before making any investment decision.
With a Light Week Ahead for Economic Reports, Investors Eye Big-Tech Earnings
In contrast to recent weeks, which began quietly as investors waited on late-week releases (i.e.: inflation, Beige Book, Fed announcements, etc.) before getting involved, this week is relatively quiet for economic reports. With less to be concerned about undermining any new positions, early week activity, without a holiday, may help increase volume. The scarcity of economic numbers could also cause more attention to be paid to earnings reports. This coming week we’ll receive a slew of big tech companies reporting. Disappointment may cause tech, which is showing signs of life early in 2023, to fall behind again. Whereas surprises on the upside could help unwind some of last year’s dismal big tech performance. Small Cap stocks, for their part, are keeping pace with the Nasdaq 100 mega stocks.
Earnings of both small-caps and mega-caps this week may produce a clear front-running segment based on capitalization.
There’s a Fed meeting next week. While the consensus seems to be for a 25 bp hike, Fed governors have been clear in recent addresses that the tightening cycle is not over. The PCE number late this week is considered the Fed’s favorite inflation gauge. There are no scheduled addresses by Fed regional presidents leading up to the two-day meeting that concludes on February 1.
Monday 1/23
8:30 AM ET The index of leading economic indicators, which has been in steep decline (dropped a full 1.0 percent in November), is expected to have fallen a further 0.7 percent in December. The index of leading economic indicators is a composite of 10 forward-looking components, including building permits, new factory orders, stock market performance, and unemployment claims. As such, estimates pre-report tend to be very close to the actual number. The report attempts to predict general economic conditions six months out.
Tuesday 1/24
9:45 AM ET, The Purchasing Managers Index (PMI) has been drifting down further into contraction – no relief is expected for January. Manufacturing is seen at 46.5 with services at 45.5.
Wednesday 1/25
7:00 AM ET, the Mortgage Bankers’ Association (MBA) compiles various mortgage loan indexes. The purchase applications index measures applications at mortgage lenders. This is a leading indicator for single-family home sales and housing construction. The composite index is expected to come in at 27.9%, while the Purchase applications are expected to show a reading of 24.7%. The data provides a gauge of not only the demand for housing but economic momentum.
Thursday 1/26
8:30 AM ET, Forecasters see Durable Goods Orders rebounding 2.8 percent in December, which would more than reverse November’s steep 2.1 percent decline. Yet the gain is seen concentrated in aircraft as both ex-transportation and core capital goods orders are seen falling 0.2 percent.
8:30 AM ET, Gross Domestic Product, or GDP for the fourth quarter is expected to have slowed to a 2.7% annualized growth versus third-quarter growth of 3.2%. Positive growth would indicate that the economy is not in a recession.
8:30 AM ET, Jobless Claims are a weekly report. For the January 21 week, it is expected to come in at 202,000 versus a very low 190,000 in the prior week. The Fed focuses on jobs; the very strong numbers (low) suggest the Fed has room to tighten without being overly disruptive to job creation. Also, a tight labor market can be viewed as inflationary.
10:00 AM ET, New Home Sales in December are expected to revert to the downward trend at a 614,000 annualized rate versus November’s 640,000. Higher home sales reverberate throughout the economy in terms of spending and growth.
Friday 1/27
• 8:30 AM ET, Personal Income is expected to have increased a monthly 0.2 percent higher in December, with consumption expenditures expected to have decreased 0.1 percent. These would compare with respective November gains of 0.4 and 0.1 percent.
The PCE inflation readings for December, which are part of the PI numbers, are expected to show no change overall and up 0.3 percent for the core (versus respective gains of 0.1 and 0.2 percent) for annual rates of 5.0 and 4.4 percent (versus November’s 5.5 and 4.7 percent).
What Else
The Federal Reserve is very likely through most of its overnight Fed Funds tightening cycle. Japan, which had gone through decades of having a deflation problem, is now experiencing the highest inflation in 41 years. The Bank of Japan has not adopted the aggressively hawkish monetary policy that the US has. The US central bank, chaired by Jerome Powell, must be looking on and holding his stated opinion that he’d rather do too much tightening than too little.
The so-called Beige Book is receiving much more attention from market participants than it has in years as they seek insight into the near- and long-term economic direction. The report is published eight times yearly and released about two weeks before the FOMC scheduled meetings. It contains anecdotal trends and moods from each of the 12 Federal Reserve districts. The information is collected and summarized and is relied on as part of the discussion topics at the Fed policy meetings.
The report released on January 18th was collected on or before January 9th. While each Federal Reserve district may have different economic experiences, for example, manufacturing regions may have a very different perspective than agricultural areas or districts where service jobs are more prevalent.
30,000 Foot View
The first Beige Book of 2023 shows the US economy is holding steady. However, there are only small amounts of growth experienced in some regions, while others expect small pockets of expansion. This overall summary would be difficult to use as an argument for the Fed to alter course from its stated intention of additional tightening, including Fed Funds rate hikes. The next meeting will be held on January 31st and February 1st.
“On balance, contacts across districts said they expected future price growth to moderate further in the year ahead,” the survey said.
The report doesn’t contain many surprises and confirms current expectations that residential real estate activity is sluggish, the labor market is strong, and that inflation is running at a slower pace of growth.
There is very little in January’s Beige Book that would alter analysts’ expectations of what the next monetary policy adjustment might be. Those that are expecting a 0.50% increase are not likely to shift their thinking from the summaries, and those expecting a 0.25% hike are similarly not inclined to shift their thinking. Most analysts fall into one of these two categories.
A Sign the Markets Wanted
In a recent interview, Cleveland Fed President Loretta Mester said the slowdown in inflation shows the Fed’s work raising rates is having the desired effect; she also suggested that further increases are still needed. “We’re beginning to see the kind of actions that we need to see,” Mester stated; these are “good signs that things are moving in the right direction. That’s important input into how we’re thinking about where policy needs to go.” This is heartening for those hoping for fewer rate hikes as Mester is considered one of the US central bank’s more hawkish members.
Take Away
The markets got a mixed bag with no clear change of direction from the summary of Federal reserve districts, otherwise known as the Beige Book. This could mean there will be few surprises at the close of the FOMC meeting on February 1st.
At least one Fed hawk is softening her rhetoric going into the meeting. If the trend continues, the prospect of fewer rate hikes should be viewed as positive for stocks and positive for bonds.
Cathie Wood Reveals 2022’s Most Disruptive and Innovative Technologies
ARK Invest’s Cathie Wood penned a lookback-themed article about the innovations and disruptive companies of 2022. The purpose seemed to be to remind followers that although during the year, investors may have become disheartened with innovation, ‘look at the amazing opportunities that occurred.’ The innovations and companies highlighted were somewhat overlooked; following the path we are accustomed to from many breakthroughs, they fly under the radar. Then, suddenly they’re widely adopted. Below are many of her picks for innovation and companies she may now wish her funds held large positions in.
The Future of Internet
Suddenly everyone is talking about ChatGPT. According to Wood, artificial intelligence (AI), specifically, ChatGPT is advancing at a pace that is surprising even by standards set by earlier versions. This version of GPT-3, optimized for conversation, signed up one million users in just five days. By comparison, this onboarding of users is incredibly fast benchmarked against the original GPT-3, which took 24 months to reach the same level.
In 2022, TV advertising in the US underwent significant changes. Traditional, non-addressable, non-interactive TV ad spending dropped by 2% to $70 billion, according to Wood. Connected TV (CTV) ad spending on the same terms increased by 14% to ~$21 billion. Pure-play CTV operator Roku’s advertising platform revenue increased 15% year-over-year in the third quarter, the latest report available, while traditional TV scatter markets plummeted 38% year-over-year in the US. Roku maintained its position in the CTV market as the leading smart TV vendor in the US, accounting for 32% of the market.
Digital Wallets are replacing both credit cards and cash. In the category of offline commerce. They overtook cash as the top transaction method in 2020 and accounted for 50% of global online commerce volume in 2021. As an example of the growth, Square’s payment volume soared 193%, six times faster than the 30% increase in total retail spending 2019-2022 (relative to pre-COVID levels).
While overall e-commerce spending increased by 99% over the last three years, social commerce merchandise volume grew even faster. Shopify’s gross merchandise volume grew by 312%, almost four times faster than overall e-commerce and taking a significant share from other retail.
Underlying public blockchains continue to process transactions despite what may be going on surrounding the connected industries. Wood says it highlights that “their transparent, decentralized, and auditable ledgers could be a solution to the fraud and mismanagement associated with centralized, opaque institutions.” She explains, “After the FTX collapse, the share of trading volume on decentralized exchanges, which allow for trading without a central intermediary, rose 37% from 8.35% to 11.44%.
Genomic Revolution
Base editing and multiplexing have the potential to provide more effective CAR-T treatments for patients with otherwise incurable cancers. Cathie Wood provided an example from 2022 about a young girl in the UK with leukemia that went from hopeless in May to Canver-free in November.
In 2022 Dutch scientists at the Hubrecht Institute, UMC Utrecht, and the Oncode Institute used another form of gene editing called prime editing to correct the mutation that causes cystic fibrosis in human stem cells. Another example of how it is being adopted comes from Korean researchers at Yonsei University that used prime editing successfully to treat liver and eye diseases in adult mice.
CRISPR gene editing in Cathie’s words, “has delivered functional cures for beta-thalassemia and sickle cell disease.” She gives examples: CRISPR Therapeutics and Vertex Pharmaceuticals which together have treated more than 75 patients, resulting in some well-publicized “functional cures”. They are expecting FDA approval for Exa-Cel, the treatment for sickle cell and beta thalassemia, in early 2023.
In the category the Ark Invest founder referred to as other cell and gene therapies, she says in 2022, regulators approved several landmark cell and gene therapies. The examples she used to highlight this are Hemgenix for the treatment of Haemophilia B, Zyntelgo for beta thalassemia, Skysona for cerebral adrenoleukodystrophy, Yescarta and Breyanzi for Non-Hodgkin lymphoma, Tecartus for mantle cell lymphoma, and Carvykti and Abecma for multiple myeloma.
Liquid biopsies, blood tests via molecular diagnostic testing are enabling the early detection of colorectal cancer which, if discovered at or before stage 1, have a five-year survival rate greater than 90%. Late-stage or metastatic cancers account for more than 55% of deaths over a five-year period, but only 17% of new diagnoses.
Autonomous Technology & Robotics
During 2022 electric vehicle maker Tesla sales increased by 49% even as automobile sales declined by 8%. Tesla’s share of total auto sales in the US has increased to 3.8% from 1.4% in three years.
During 2022, GM expanded its autonomous driving taxi service to most of San Francisco in the first large-scale rollout in a major US city. Then it launched in both Phoenix and Austin late in the year. The automaker with a stodgy reputation, managed to compress the time to commercialization from nine years in San Francisco to just 90 days in Austin. Tesla, for its part, expanded access to its FSD (full self-driving) beta software to all owners in North America who had requested access.
By January 4, 2023, both Amazon and Walmart had begun deliveries using drones in select US cities. Autonomous logistics technology is no longer futuristic and is likely to continue being adopted and expanded.
Across the top 50 medical device companies, 90% rely on 3D printing for prototyping, testing, and even in some cases printing medical devices.
In 2022, SpaceX nearly doubled the number of rockets it launched to 61. It reused the same rocket in as few as 21 days, a dramatic improvement over the 356 days required for its first rocket reuse. Private Space Exploration is a reality. 61 rockets is an average of more than one per week.
Take Away
Hedge fund manager Cathie Wood took the new year as an opportunity to communicate examples of game-changing innovation that the equity market largely ignored in 2022. She finds these as confidence building that the premise of many of her managed funds is with merit. More importantly, in the face of market headwinds and media criticism, she wants these examples to help boost investor confidence “that ARK’s strategies are on the right side of change.” She tells readers, “innovation solves problems and has historically gained share during turbulent times.”
The GEO Group, Inc. (NYSE: GEO) is a leading diversified government service provider, specializing in design, financing, development, and support services for secure facilities, processing centers, and community reentry centers in the United States, Australia, South Africa, and the United Kingdom. GEO’s diversified services include enhanced in-custody rehabilitation and post-release support through the award-winning GEO Continuum of Care®, secure transportation, electronic monitoring, community-based programs, and correctional health and mental health care. GEO’s worldwide operations include the ownership and/or delivery of support services for 103 facilities totaling approximately 83,000 beds, including idle facilities and projects under development, with a workforce of up to approximately 18,000 employees.
Joe Gomes, Senior Research Analyst, Noble Capital Markets, Inc.
Joshua Zoepfel, Research Associate, Noble Capital Markets, Inc.
Refer to the full report for the price target, fundamental analysis, and rating.
New Contract. The GEO Group was awarded a contract from the Department of Justice and Community Safety in the State of Victoria for the delivery of primary health services across 13 public prisons. The contract will commence on July 1, 2023 and is expected to generate approximately $33 million in incremental annualized revenue for GEO. We view the new contract as a nice compliment to the existing operations.
A New (Old) Business. This is a return of GEO to a business previously conducted by the Company. The Company held this contract before being forced to spin off the unit once becoming a REIT. GEO already provides these services in the facilities it manages and the new contract is just an expansion to other non-managed facilities. There should not be any “learning curve,” in our view.
Equity Research is available at no cost to Registered users of Channelchek. Not a Member? Click ‘Join’ to join the Channelchek Community. There is no cost to register, and we never collect credit card information.
This Company Sponsored Research is provided by Noble Capital Markets, Inc., a FINRA and S.E.C. registered broker-dealer (B/D).
*Analyst certification and important disclosures included in the full report. NOTE: investment decisions should not be based upon the content of this research summary. Proper due diligence is required before making any investment decision.
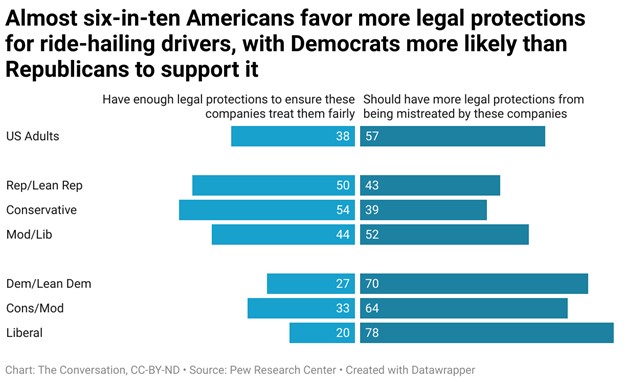
What’s a ‘Gig’ Job? How it’s Legally Defined Affects Workers’ Rights and Protections
The “gig” economy has captured the attention of technology futurists, journalists, academics and policymakers.
“Future of work” discussions tend toward two extremes: breathless excitement at the brave new world that provides greater flexibility, mobility and entrepreneurial energy, or dire accounts of its immiserating impacts on the workers who labor beneath the gig economy’s yoke.
This article was republished with permission from The Conversation, a news site dedicated to sharing ideas from academic experts. It represents the research-based findings and thoughts of David Weil, Visiting Senior Faculty Fellow, Ash Center for Democracy Harvard Kennedy School / Professor, Heller School for Social Policy and Management, Brandeis University.
These widely diverging views may be partly due to the many definitions of what constitutes “gig work” and the resulting difficulties in measuring its prevalence. As an academic who has studied workplace laws for decades and ran the federal agency that enforces workplace protections during the Obama administration, I know the way we define, measure and treat gig workers under the law has significant consequences for workers. That’s particularly true for those lacking leverage in the labor market.
While there are benefits for workers for this emerging model of employment, there are pitfalls as well. Confusion over the meaning and size of the gig workforce – at times the intentional work of companies with a vested economic interest – can obscure the problems gig status can have on workers’ earnings, workplace conditions and opportunities.
Defining Gig Work
Many trace the phrase “gig economy” to a 2009 essay in which editor and author Tina Brown proclaimed: “No one I know has a job anymore. They’ve got Gigs.”
Although Brown focused on professional and semiprofessional workers chasing short-term work, the term soon applied to a variety of jobs in low-paid occupations and industries. Several years later, the rapid ascent of Uber, Lyft and DoorDash led the term gig to be associated with platform and digital business models. More recently, the pandemic linked gig work to a broader set of jobs associated with high turnover, limited career prospects, volatile wages and exposure to COVID-19 uncertainties.
The imprecision of gig, therefore, connotes different things: Some uses focus on the temporary or “contingent” nature of the work, such as jobs that may be terminated at any time, usually at the discretion of the employer. Other definitions focus on the unpredictability of work in terms of earnings, scheduling, hours provided in a workweek or location. Still other depictions focus on the business structure through which work is engaged – a staffing agency, digital platform, contractor or other intermediary. Further complicating the definition of gig is whether the focus is on a worker’s primary source of income or on side work meant to supplement income.
Measuring Gig Work
These differing definitions of gig work have led to widely varying estimates of its prevalence.
A conservative estimate from the Bureau of Labor Statistics household-based survey of “alternative work arrangements” suggests that gig workers “in non-standard categories” account for about 10% of employment. Alternatively, other researchers estimate the prevalence as three times as common, or 32.5%, using a Federal Reserve survey that broadly defines gig work to include any work that is temporary and variable in nature as either a primary or secondary source of earnings. And when freelancing platform Upworks and consulting firm McKinsey & Co. use a broader concept of “independent work,” they report rates as high as 36% of employed respondents.
No consensus definition or measurement approach has emerged, despite many attempts, including a 2020 panel report by the National Academies of Sciences, Engineering, and Medicine. Various estimates do suggest several common themes, however: Gig work is sizable, present in both traditional and digital workplaces, and draws upon workers across the age, education, demographic and skill spectrum.
Why it Matters
As the above indicates, gig workers can range from high-paid professionals working on a project-to-project basis to low-wage workers whose earnings are highly variable, who work in nonprofessional or semiprofessional occupations and who accept – by choice or necessity – volatile hours and a short-term time commitment from the organization paying for that work.
Regardless of their professional status, many workers operating in gig arrangements are classified as independent contractors rather than employees. As independent contractors, workers lose rights to a minimum wage, overtime and a safe and healthy work environment as well as protections against discrimination and harassment. Independent contractors also lose access to unemployment insurance, workers’ compensation and paid sick leave now required in many states.
Federal and state laws differ in the factors they draw on to make that call. A key concept underlying that determination is how “economically dependent” the worker is on the employer or contracting party. Greater economic independence – for example, the ability to determine price of service, how and where tasks are done and opportunities for expanding or contracting that work based on the individual’s own skills, abilities and enterprise – suggest a role as an independent contractor.
In contrast, if the hiring party basically calls the shots – for example, controlling what the individual does, how they do their work and when they do it, what they are permitted to do and not do, and what performance is deemed acceptable – this suggests employee status. That’s because workplace laws are generally geared toward employees and seek to protect workers who have unequal bargaining leverage in the labor market, a concept based on long-standing Supreme Court precedent.
Making Work More Precarious
Over the past few decades, a growing number of low-wage workers find themselves in gig work situations – everything from platform drivers and delivery personnel to construction laborers, distribution workers, short-haul truck drivers and home health aides. Taken together, the grouping could easily exceed 20 million workers.
Many companies have incentives to classify these workers as independent contractors in order to reduce costs and risks, not because of a truly transformed nature of work where those so classified are real entrepreneurs or self-standing businesses.
Since gig work tends to be volatile and contingent, losing employment protections amplifies the precariousness of work. A business using misclassified workers can gain cost advantages over competitors who treat their workers as employees as required by the law. This competitive dynamic can spread misclassification to new companies, industries and occupations – a problem we addressed directly, for example, in construction cases when I led the Wage and Hour Division and more recently in several health care cases.
The future of work is not governed by immutable technological forces but involves volitional private and public choices. Navigating to that future requires weighing the benefits gig work can provide some workers with greater economic independence against the continuing need to protect and bestow rights for the many workers who will continue to play on a very uneven playing field in the labor market.
Tokens.com Corp is a publicly traded company that invests in Web3 assets and businesses focused on the Metaverse, NFTs, DeFi, and gaming based digital assets. Tokens.com is the majority owner of Metaverse Group, one of the world’s first virtual real estate companies. Hulk Labs, a wholly-owned Tokens.com subsidiary, focuses on investing in play-to-earn revenue generating gaming tokens and NFTs. Additionally, Tokens.com owns and stakes crypto assets to earn additional tokens. Through its growing digital assets and NFTs, Tokens.com provides public market investors with a simple and secure way to gain exposure to Web3.
Joe Gomes, Senior Research Analyst, Noble Capital Markets, Inc.
Joshua Zoepfel, Research Associate, Noble Capital Markets, Inc.
Refer to the full report for the price target, fundamental analysis, and rating.
A New Acquisition. Yesterday, Tokens.com’s subsidiary Metaverse Group announced the acquisition of CocoNFT. As part of the acquisition, Coco’s co-founders Mark Allen and Brody Berson will be joining the Metaverse Group as Chief Technology Officer and Chief Product Officer respectively and will be focused with building further tools and products for both NFT and virtual world applications. No financial details were given for the transaction.
Detail on CocoNFT. CocoNFT is a software platform that allows users to connect their Instagram to mint NFTs, leveraging the blockchain and a web3 wallet. In acquiring the company, Metaverse Group will work to advance Coco’s technology offering and integrate the products with its virtual world B2B offerings. The acquisition will leverage Coco’s strategic partnerships in Opensea and Rarible and online communities with over 45,000 followers across TikTok and Twitter.
Equity Research is available at no cost to Registered users of Channelchek. Not a Member? Click ‘Join’ to join the Channelchek Community. There is no cost to register, and we never collect credit card information.
This Company Sponsored Research is provided by Noble Capital Markets, Inc., a FINRA and S.E.C. registered broker-dealer (B/D).
*Analyst certification and important disclosures included in the full report. NOTE: investment decisions should not be based upon the content of this research summary. Proper due diligence is required before making any investment decision.
Tokens.com Corp is a publicly traded company that invests in Web3 assets and businesses focused on the Metaverse, NFTs, DeFi, and gaming based digital assets. Tokens.com is the majority owner of Metaverse Group, one of the world’s first virtual real estate companies. Hulk Labs, a wholly-owned Tokens.com subsidiary, focuses on investing in play-to-earn revenue generating gaming tokens and NFTs. Additionally, Tokens.com owns and stakes crypto assets to earn additional tokens. Through its growing digital assets and NFTs, Tokens.com provides public market investors with a simple and secure way to gain exposure to Web3.
Joe Gomes, Senior Research Analyst, Noble Capital Markets, Inc.
Joshua Zoepfel, Research Associate, Noble Capital Markets, Inc.
Refer to the full report for the price target, fundamental analysis, and rating.
Third Quarter Results. Third quarter revenue totaled $101,235, down from $448,976 in the same period last year, as staking revenue dropped to $53,972 from $417,572 last year. On the positive side, Tokens.com reported two new revenue streams-leasing and gaming. Leasing revenue totaled $49,871 while gaming contributed $4,892. Operating loss was at $879.430 versus last year’s $167,331. Net loss for the Company was $1.8 million, or a loss of $0.02 per share versus net income of $4.1 million, or $0.05 per share.
Truncated Full Year Results. As the Company has switched its year-end to September 30 from December 31, Tokens also reported truncated full year results. For the nine months, revenue totaled $678,269 compared to $1.08 million in the same period last year. Operating loss was $2.0 million compared to $5.2 million. Net loss was $5.9 million, or a loss of $0.06 per share, compared to a net loss of $8.3 million, or a net loss of $0.12 per share last year.
Equity Research is available at no cost to Registered users of Channelchek. Not a Member? Click ‘Join’ to join the Channelchek Community. There is no cost to register, and we never collect credit card information.
This Company Sponsored Research is provided by Noble Capital Markets, Inc., a FINRA and S.E.C. registered broker-dealer (B/D).
*Analyst certification and important disclosures included in the full report. NOTE: investment decisions should not be based upon the content of this research summary. Proper due diligence is required before making any investment decision.
Caroline Ellison Now Enters a New Stage of Her Young Life
Caroline Ellison, the 28-year-old former CEO of Alameda Research, pleaded guilty to seven criminal charges, including wire fraud and conspiracy to commit securities fraud, according to her plea agreement, signed Monday. Caroline, the former chief executive of Alameda Research, a trading firm with close ties to FTX, is said to face up to 115 years in prison. Her admitted role in allowing customer funds to flow through an electronic “backdoor” to be used by Sam Bankman Fried (SBF) of FTX tells us a little bit about her recent past, but who is Ms. Ellison, and how did she get to be CEO of Alameda?
What is Alameda Research?
SBF’s portfolio of crypto companies started with his founding of Alameda research in 2017. Alameda Research was, until very recently, a cryptocurrency trading firm known to specialize in quantitative research and providing liquidity to cryptocurrency and digital assets markets.
Ellison joined the Alameda team as a trader in 2018 and became its co-CEO in 2021.
Bankman-Fried had started Alameda Research as a high-risk, high-reward crypto trading firm using high-risk tactics. He has admitted he included “research” in the name to give it a better vibe. In an NPR podcast in 2017, he was shown to be aggressively taking advantage of the “wild west” crypto playing field. SBF grew his crypto-related business into more complex cryptocurrency trading, accessible to the masses, with his founding of FTX, a crypto exchange, in 2019. He did this by leveraging his image as highly experienced in crypto, which helped him to raise money from firms like BlackRock.
Who Is Caroline Ellison?
In a now-removed YouTube video and podcast, Caroline discussed her background and upbringing in an FTX public relations-type interview dated July 2020.
The 28-year-old Ellison grew up outside of Boston in a town called Newton. Her parents are professors, Glenn Ellison, her father, is a professor of economics at the Massachusetts Institute of Technology (MIT), and Sara Fischer Ellison lectures at the prestigious school.
Ellison said in the podcast that she inherited a natural aptitude for math and entered math competitions at a young age. She further would demonstrate that she was some kind of prodigy by telling people that by age five, she read a Harry Potter book by herself. “I refused to wait for my parents to read it [to me],” she said.
She went on to major in math at Stanford. After applying for trading internships, a field that is very competitive for new graduates, she landed at Jane Street Capital, a well-respected firm on Wall Street. After her internship, she worked there for a year and a half.
Is Caroline Elliman or was Caroline Elliman Sam Bankman Fried’s girlfriend? There are sources that say that Ellison met Bankman-Fried at Jane Street. He worked there from June 2014 to September 2017, according to his LinkedIn, which is still live and has 28,250 followers.
Ellison said she learned about Alameda over coffee with then-CEO Bankman-Fried while visiting the Bay Area and decided “it seemed like too cool of an opportunity to pass up.” She joined the company in 2018.
Bankman-Fried would then resign as CEO of Alameda but retained his role as CEO of FTX. In October 2021, Ellison became co-CEO with Sam Trabucco, a former trader at Susquehanna International Group.
Trabucco resigned in August 2022 to “spend a lot of time traveling,” according to one of his tweets, saying he “bought a boat.”
Was There Romance Between Ellison and SBF?
When a book about this is written, and the movie is out, it will include sex.
There have been rumors of polyamory. This is a relationship behavior that involves connections with more than one person. According to a Coindesk article from November, among the FTX executives, in the Bahamas, “All 10 are, or used to be, paired up in romantic relationships with each other.” There have also been suggestions that FTX employees and Bankman-Fried spent lavishly on the island, from yachts to thousands of dollars a day on catering.
Take Away
Financial fraud comes in many forms. Often it starts out innocently when a bad trade happens, someone tries to cover it up, and the markets don’t cooperate to bail out the bad trade, then more illegal actions are taken to cover that up. There have also been situations where unqualified, not experienced persons are in charge and either unaware of the magnitude of their deceptive actions or are following orders, perhaps just going along because others are doing it too. Then there are those that enjoy the attention they get by being out front and sharing wealth and buying fame. Another more common deceit is someone who is just plain old greedy. All are criminal.
I am not sure what the driver was in the Alameda/FTX, SBF Caroline Ellison (and others) case, but I am sure we will hear much more about this. As we do, remember the importance of trusting those you conduct business with and questioning them anyway.
Kandi Technologies Group, Inc. (KNDI), headquartered in Jinhua Economic Development Zone, Zhejiang Province, is engaged in the research, development, manufacturing, and sales of various vehicular products. Kandi conducts its primary business operations through its wholly-owned subsidiary, Zhejiang Kandi Technologies Group Co., Ltd. (“Zhejiang Kandi Technologies”), formerly, Zhejiang Kandi Vehicles Co., Ltd.) and its subsidiaries including Zhejiang Kandi Smart Battery Swap Technology Co., Ltd, and SC Autosports, LLC (d/b/a Kandi America), the wholly-owned subsidiary of Kandi in the United States, and its wholly-owned subsidiary, Kandi America Investment, LLC. Zhejiang Kandi Technologies has established itself as one of China’s leading manufacturers of pure electric vehicle parts and off-road vehicles.
Michael Heim, CFA, Senior Research Analyst, Noble Capital Markets, Inc.
Refer to the full report for the price target, fundamental analysis, and rating.
Kandi received a letter of intent from Coleman Powersports to purchase 4,800 electric golf carts for a value of $27.6 million. Coleman Powersports, a division of Newell Brands (a distributor of various camping and outdoor living gear) began purchasing the Kandi golf carts in April for sales through Lowes stores and has increased the order volume steadily up to a rate of 1,000 in September. The sales to Coleman are expected to occur in the 2023 first quarter and thus represent an 60% increase in orders for Coleman over September sales.
What does this mean for Kandi? The Off-road vehicle segment is the fastest growing division of Kandi growing more than 400% year over year in the September quarter. What’s more, it is the most profitable division for the company with operating margins in excess of 25%. The company has shifted attention away from electric cars and towards off-road vehicles and the shift has clearly paid off. The fact that the sales are going to established brand names such as Coleman and Lowes is significant and lends credence of future sales growth.
Equity Research is available at no cost to Registered users of Channelchek. Not a Member? Click ‘Join’ to join the Channelchek Community. There is no cost to register, and we never collect credit card information.
This Company Sponsored Research is provided by Noble Capital Markets, Inc., a FINRA and S.E.C. registered broker-dealer (B/D).
*Analyst certification and important disclosures included in the full report. NOTE: investment decisions should not be based upon the content of this research summary. Proper due diligence is required before making any investment decision.