ACCO Brands (ACCO) – Post Call Thoughts and Updated Models

Thursday, April 28, 2022

ACCO Brands (ACCO)
Post Call Thoughts and Updated Models

ACCO Brands Corporation designs, manufactures, sources, markets, and sells office products, academic supplies, and calendar products primarily in the United States, Canada, Northern Europe, Brazil, Australia, and Mexico. It operates through three segments: ACCO Brands North America, ACCO Brands EMEA, and ACCO Brands International. The company offers office products, such as stapling, binding and laminating equipment, and related consumable supplies, as well as shredders and whiteboards; and academic products, including notebooks, folders, decorative calendars, and stationery products. It also provides private label products, as well as business machine maintenance and repair services. The company offers its business, academic, and calendar product lines under the Artline, AT-A-GLANCE, Derwent, Esselte, Five Star, GBC, Hilroy, Leitz, Marbig, Mead, NOBO, Quartet, Rapid, Rexel, Swingline, Tilibra, Wilson Jones, and other brand names. In addition, it designs, sources, distributes, markets, and sells accessories for laptop and desktop computers, and tablets comprising security products; input devices, such as presenters, mice, and trackballs; ergonomic aids, including foot and wrist rests; docking stations; and other personal computers and tablet accessories under the Kensington, Microsaver, and ClickSafe brand names. The company sells its products to consumers and commercial end-users primarily through resellers, including traditional office supply resellers, wholesalers, mass merchandisers, and retailers, as well as directly to consumers through on-line and direct mail. ACCO Brands Corporation is headquartered in Lake Zurich, Illinois.

Joe Gomes, Senior Research Analyst, Noble Capital Markets, Inc.

Joshua Zoepfel, Research Associate, Noble Capital Markets, Inc.

Refer to the full report for the price target, fundamental analysis, and rating.

    Back-to-School. The Back-to-School season is off to a strong start. The North American market should see a strong season, while the improvement in Mexico and Brazil, neither of which are back to pre-COVID levels, should add to demand. With in-country manufacturing, we believe ACCO is well positioned to benefit if supply chain issues persist.

    Price Hikes.  Overall, ACCO still has yet to recover inflationary cost increases and we anticipate additional targeted price increases throughout all markets during the year. ACCO took a sizable price increase in EMEA on April 1 and another price increase will be taken on July 1. Hopefully, these will offset cumulative inflationary pressures in that market …


This Company Sponsored Research is provided by Noble Capital Markets, Inc., a FINRA and S.E.C. registered broker-dealer (B/D).

*Analyst certification and important disclosures included in the full report. NOTE: investment decisions should not be based upon the content of this research summary. Proper due diligence is required before making any investment decision. 


Release – electroCore to Announce First Quarter 2022 Financial Results on May 5


electroCore to Announce First Quarter 2022 Financial Results on May 5

News and Market Data on electroCore


ROCKAWAY, N.J.
April 28, 2022 (GLOBE NEWSWIRE) — 
electroCore, Inc. (Nasdaq: ECOR), a commercial-stage bioelectronic medicine company, announced today that it will report financial results for the first quarter ended 
March 31, 2022, after the close of the market on 
Thursday, May 5, 2022. Management will host a conference call and webcast at 
4:30 PM EDT to discuss the financial results and answer questions.

Thursday, May 5, 2022, 4:30 PM EDT
Domestic: 877-269-7756
International: 201-689-7817
Conference ID: 13728177
Webcast: electroCore Earnings Webcast

About electroCore, Inc.
electroCore, Inc. is a commercial stage bioelectronic medicine company dedicated to improving patient outcomes through its non-invasive vagus nerve stimulation therapy platform, initially focused on the treatment of multiple conditions in neurology. The company’s current indications are the preventive treatment of cluster headache and migraine, the acute treatment of migraine and episodic cluster headache, the acute and preventive treatment of migraines in adolescents, and paroxysmal hemicrania and hemicrania continua in adults.

For more information, visit www.electrocore.com.

Contact:
Rich Cockrell

CG Capital
404-736-3838
ecor@cg.capital

Alliance Resource Partners (ARLP) – ARLP Raises 2022 Expectations Increases Cash Distribution 40

Wednesday, April 27, 2022

Alliance Resource Partners (ARLP)
ARLP Raises 2022 Expectations; Increases Cash Distribution 40%

Alliance Resource Partners LP operates as a coal mining company based in the United States. It functions through threesegments; Illinois Basin, Appalachia, and and Minerals. The Illinois Basin activity comprises of underground mining complexes in Illinois, Indiana, Kentucky, Maryland and West Virginia and it makes up for most of the company’s revenue-generating operations. The Appalachia segment, on the other hand, consists of multiple operating segments, including the Mettiki mining complex, the Tunnel Ridge mining complex and the MC Mining mining complex. The Minerals segment includes oil & gas mineral interests held by AR Midland and AllDale I & II.

Mark Reichman, Senior Research Analyst of Natural Resources, Noble Capital Markets, Inc.

Refer to the full report for the price target, fundamental analysis, and rating.

    Full year 2022 guidance. While Alliance tempered first quarter expectations due to coal shipment delays and a one-time conversion of its oil & gas business to a corporate taxable entity, Alliance now expects full year 2022 coal sales tonnage in the range of 35.5 to 37.0 million short tons compared to prior expectations of 35.2 to 36.7 million tons. Coal sales price per ton sold is expected to be in the range of $54.00 to $63.00 versus prior guidance of $49.05 to $51.25. While expectations for coal royalty tons sold is unchanged, pricing expectations have increased. Alliance also raised expectations for oil & gas royalty volumes.

    Updating estimates.  While we have lowered our adjusted first quarter EPS to $0.60 from $0.62 due to lower coal shipments which will be delivered later in the year, we have increased our full year estimate to $3.25 from $2.75. We have increased our 2022 EBITDA estimate to $716.1 million from $650.8 million. While the company expects to report GAAP first quarter net income of $35.0 to $37.0 million …


This Company Sponsored Research is provided by Noble Capital Markets, Inc., a FINRA and S.E.C. registered broker-dealer (B/D).

*Analyst certification and important disclosures included in the full report. NOTE: investment decisions should not be based upon the content of this research summary. Proper due diligence is required before making any investment decision. 


Release – ACCO Brands Posts Strong First Quarter


ACCO Brands Posts Strong First Quarter

Research, News, and Market Data on ACCO Brands


LAKE ZURICH, Ill.–(BUSINESS WIRE)– ACCO Brands Corporation (NYSE: ACCO) today announced its first quarter results for the period ended March 31, 2022.

  • Net sales were $441.6 million, up 7.6 percent; comparable sales were up 11.2 percent with all segments posting increases
  • EPS was $(0.03) versus $(0.21) in 2021; adjusted EPS was $0.11, up 10.0 percent
  • Strong recovery in International segment, especially in Brazil and Mexico
  • Continued sales momentum in North America and EMEA

“We had an excellent first quarter, with sales and profits above our expectations. Our performance is a result of the strategic transformation of our Company towards sustainable comparable sales growth and demonstrates the benefits of our geographic diversity and balance, the strength of our brands, and skillful execution by our employees. All segments delivered meaningful comparable sales growth. These results give us strong momentum going into our very important back-to-school season and reinforce our outlook for a record year,” said Boris Elisman, Chairman and Chief Executive Officer of ACCO Brands.

First Quarter Results

Net sales increased 7.6 percent to $441.6 million from $410.5 million in 2021. Comparable sales increased 11.2 percent. Both reported and comparable sales were driven by higher sales prices and increased volume, primarily from strong demand for school products, computer accessories, and business products. Adverse foreign exchange reduced net sales $14.9 million, or 3.6 percent.

Operating income was $6.8 million versus an operating loss of $1.1 million in 2021. The increase was a result of $6.5 million of lower charges for the contingent consideration and inventory step-up related to the PowerA acquisition, as well as $3.6 million of lower restructuring costs. Adjusted operating income was $22.6 million compared with $24.6 million in the prior year as inflation was not sufficiently offset with price increases, especially in EMEA. Foreign exchange reduced operating income $1.2 million.

The Company reported a net loss of $2.7 million, or $(0.03) per share, compared with a net loss of $20.4 million, or $(0.21) per share, last year. The improvement was due to higher operating income, $3.5 million of lower interest expense, and non-recurrence of $12.0 million of other expense related to the debt refinancing in 2021. Adjusted net income was $10.4 million compared with $10.0 million in 2021. Adjusted earnings per share were $0.11 compared with $0.10 in 2021.

Business Segment Results

ACCO Brands North America – Sales and comparable sales of $208.5 million increased 10.4 percent from $188.8 million in 2021, primarily due to higher prices and volume increases in school products, computer accessories, and business products.

Operating income was $13.9 million versus an operating loss of $0.7 million in 2021. Adjusted operating income of $19.8 million increased from $11.2 million in 2021. Both increases primarily were due to higher sales.

ACCO Brands EMEA – Sales of $156.1 million decreased 0.5 percent from $156.9 million in 2021, primarily due to adverse foreign exchange of $12.4 million, or 7.9 percent. Comparable sales of $168.5 million increased 7.4 percent mainly due to price increases and higher volume, primarily from computer accessories and business products.

Operating income of $5.6 million decreased from $16.8 million in 2021 due to inflation that exceeded the benefit of price increases and $0.8 million from unfavorable foreign exchange. Adjusted operating income decreased to $9.1 million from $21.2 million in 2021 for the same reasons.

ACCO Brands International – Sales of $77.0 million increased 18.8 percent from $64.8 million in 2021 due to increased volume, particularly in Brazil and Mexico from a return to in-person education, and price increases. Adverse foreign exchange was $2.5 million. Comparable sales were $79.5 million, up 22.7 percent, for the same reasons.

Operating income of $4.2 million increased from $0.6 million in 2021 due to higher sales, lower bad debt reserves, the benefit of long-term cost reductions, and price increases, partially offset by inflation. Adjusted operating income of $6.2 million increased from $3.1 million due to those same factors. Foreign exchange reduced operating income $0.4 million.

Capital Allocation and Dividend

For the quarter, the Company had $104.2 million of net cash outflow from operating activities and used $107.6 million of free cash flow, including capital expenditures of $3.4 million. The Company paid $7.3 million in dividends.

On April 25, 2022, ACCO Brands’ board of directors declared a regular quarterly cash dividend of $0.075 per share. The dividend will be paid on June 22, 2022, to stockholders of record as of the close of business on May 27, 2022.

Full Year 2022 Outlook

“Our momentum from 2021 carried through the first quarter. We expect a strong back-to-school sell-in in the second quarter and continued good execution as we deal with ongoing inflation and supply chain issues. We expect to have another year of record sales, record adjusted earnings per share, and significant free cash flow growth,” concluded Elisman.

The Company is adjusting its full year outlook to reflect first quarter results, improved business expectations, and a more negative foreign exchange impact.


Current


Prior


Comparable Net Sales Growth


3.5% to 8.5%


2.0% to 7.0%


FX Impact on Net Sales (1)


(2.5)%


(1.0)%


Reported Net Sales Growth


1.0% to 6.0%


1.0% to 6.0%


Comparable Adjusted EPS


$1.52 to $1.62


$1.50 to $1.60


FX impact on Adjusted EPS (1)


$(0.04)


$(0.02)


Adjusted EPS


$1.48 to $1.58


$1.48 to $1.58


Free Cash Flow (2)


$165M


$165M


Adjusted Tax Rate


Approximately 29%


Approximately 29%


Bank Net Leverage


Less than 3.0x


Less than 3.0x


(1) Based on spot rates as of 4/15/2022

(2) FCF approximately $165M (approximately $190M cash from operations minus $25M capex)

Webcast

At 8:30 a.m. EDT on April 27, 2022, ACCO Brands Corporation will host a conference call to discuss the Company’s first quarter 2022 results. The call will be broadcast live via webcast. The webcast can be accessed through the Investor Relations section of www.accobrands.com. The webcast will be in listen-only mode and will be available for replay following the event.

About ACCO Brands Corporation

ACCO Brands Corporation is one of the world’s largest designers, marketers and manufacturers of branded academic, consumer and business products. Our widely recognized brands include AT-A-GLANCE®, Esselte®, Five Star®, GBC®, Kensington®, Leitz®, Mead®, PowerA®, Quartet®, Rapid®, Rexel®, Swingline®, Tilibra®, and many others. Our products are sold in more than 100 countries around the world. More information about ACCO Brands, the Home of Great Brands Built by Great People, can be found at www.accobrands.com.

Non-GAAP Financial Measures

In addition to financial results reported in accordance with generally accepted accounting principles (GAAP), we have provided certain non-GAAP financial information in this earnings release to aid investors in understanding the Company’s performance. Each non-GAAP financial measure is defined and reconciled to its most closely related GAAP financial measure in the “About Non-GAAP Financial Measures” section of this earnings release.

Forward-Looking Statements

Statements contained in this earnings release, other than statements of historical fact, particularly those anticipating future financial performance, business prospects, growth, strategies, business operations and similar matters, results of operations, liquidity and financial condition, are “forward-looking statements” within the meaning of the Private Securities Litigation Reform Act of 1995. These statements are based on the beliefs and assumptions of management based on information available to us at the time such statements are made. These statements, which are generally identifiable by the use of the words “will,” “believe,” “expect,” “intend,” “anticipate,” “estimate,” “forecast,” “project,” “plan,” and similar expressions, are subject to certain risks and uncertainties, are made as of the date hereof, and we undertake no duty or obligation to update them. Because actual results may differ materially from those suggested or implied by such forward-looking statements, you should not place undue reliance on them when deciding whether to buy, sell or hold the company’s securities.

Our outlook is based on certain assumptions, which we believe to be reasonable under the circumstances. These include, without limitation, assumptions regarding both the near-term and long-term impact of the COVID-19 pandemic; changes in the competitive landscape, including ongoing uncertainties in the traditional office products channels; as well as the impact of fluctuations in foreign currency and acquisitions and the other factors described below.

Among the factors that could cause our actual results to differ materially from our forward-looking statements are: the ongoing impact of the COVID-19 pandemic; a relatively limited number of large customers account for a significant percentage of our sales; issues that influence customer and consumer discretionary spending during periods of economic uncertainty or weakness; risks associated with foreign currency fluctuations; challenges related to the highly competitive business environment in which we operate; our ability to develop and market innovative products that meet consumer demands and to expand into new and adjacent product categories that are experiencing higher growth rates; our ability to successfully expand our business in emerging markets and the exposure to greater financial, operational, regulatory, compliance and other risks in such markets; the continued decline in the use of certain of our products; risks associated with seasonality; the sufficiency of investment returns on pension assets, risks related to actuarial assumptions, changes in government regulations and changes in the unfunded liabilities of a multi-employer pension plan; any impairment of our intangible assets; our ability to secure, protect and maintain our intellectual property rights, and our ability to license rights from major gaming console makers and video game publishers to support our gaming business; continued disruptions in the global supply chain; risks associated with changes in the cost or availability of raw materials, transportation, labor, and other necessary supplies and services and the cost of finished goods; the continued global shortage of microchips which are needed in our gaming and computer accessories businesses; risks associated with outsourcing production of certain of our products, information technology systems and other administrative functions; the failure, inadequacy or interruption of our information technology systems or its supporting infrastructure; risks associated with a cybersecurity incident or information security breach, including that related to a disclosure of personally identifiable information; our ability to grow profitably through acquisitions; our ability to successfully integrate acquisitions and achieve the financial and other results anticipated at the time of acquisition, including planned synergies; risks associated with our indebtedness, including limitations imposed by restrictive covenants, our debt service obligations, and our ability to comply with financial ratios and tests; a change in or discontinuance of our stock repurchase program or the payment of dividends; product liability claims, recalls or regulatory actions; the impact of litigation or other legal proceedings; our failure to comply with applicable laws, rules and regulations and self-regulatory requirements, the costs of compliance and the impact of changes in such laws; our ability to attract and retain qualified personnel; the volatility of our stock price; risks associated with circumstances outside our control, including those caused by public health crises, such as the occurrence of contagious diseases like COVID-19, severe weather events, war, terrorism and other geopolitical incidents; and other risks and uncertainties described in “Part I, Item 1A. Risk Factors” in our Annual Report on Form 10-K for the year ended December 31, 2021, and in other reports we file with the Securities and Exchange Commission (“SEC”).

ACCO Brands Corporation and Subsidiaries

Condensed Consolidated Balance Sheets


March 31,
2022


December 31,
2021


(in millions)


(unaudited)


Assets


Current assets:


Cash and cash equivalents

$


91.3


$


41.2


Accounts receivable, net


341.7


416.1


Inventories


471.4


428.0


Other current assets


50.6


39.6


Total current assets


955.0


924.9


Total property, plant and equipment


612.3


656.4


Less: accumulated depreciation


(401.7

)


(441.8

)

Property, plant and equipment, net


210.6


214.6


Right of use asset, leases


104.3


105.2


Deferred income taxes


113.0


115.9


Goodwill


798.9


802.5


Identifiable intangibles, net


896.1


902.2


Other non-current assets


22.6


26.0


Total assets

$


3,100.5


$


3,091.3


Liabilities and Stockholders’ Equity


Current liabilities:


Notes payable

$


4.0


$


9.4


Current portion of long-term debt


40.8


33.6


Accounts payable


223.2


308.2


Accrued compensation


36.9


56.9


Accrued customer program liabilities


75.8


101.4


Lease liabilities


24.1


24.4


Current portion of contingent consideration


38.9


24.8


Other current liabilities


125.2


149.9


Total current liabilities


568.9


708.6


Long-term debt, net


1,109.2


954.1


Long-term lease liabilities


88.4


89.0


Deferred income taxes


142.9


145.2


Pension and post-retirement benefit obligations


211.2


222.3


Contingent consideration


0.5


12.0


Other non-current liabilities


97.9


95.3


Total liabilities


2,219.0


2,226.5


Stockholders’ equity:


Common stock


1.0


1.0


Treasury stock


(42.1

)


(40.9

)

Paid-in capital


1,911.5


1,902.2


Accumulated other comprehensive loss


(516.8

)


(535.5

)

Accumulated deficit


(472.1

)


(462.0

)

Total stockholders’ equity


881.5


864.8


Total liabilities and stockholders’ equity

$

3,100.5

$

3,091.3


ACCO Brands Corporation and Subsidiaries

Consolidated Statements of Operations (Unaudited)

(In millions, except per share data)


Three Months Ended
March 31,


2022


2021


% Change

Net sales

$

441.6


$

410.5


7.6%

Cost of products sold


322.0


295.0


9.2%

Gross profit


119.6


115.5


3.5%

Operating costs and expenses:


Selling, general and administrative expenses


98.8


94.0


5.1%

Amortization of intangibles


11.1


12.0


(7.5)%

Restructuring charges


0.3


3.9


(92.3)%

Change in fair value of contingent consideration


2.6


6.7


NM

Total operating costs and expenses


112.8


116.6


(3.3)%

Operating income (loss)


6.8


(1.1

)


NM

Non-operating expense (income):


Interest expense


9.7


13.2


(26.5)%

Interest income


(1.4

)


(0.1

)


NM

Non-operating pension income


(1.4

)


(0.8

)


75.0%

Other expense, net


0.9


12.9


(93.0)%

Loss before income tax


(1.0

)


(26.3

)


96.2%

Income tax expense (benefit)


1.7


(5.9

)


NM

Net loss

$

(2.7

)

$

(20.4

)


86.8%


Per share:


Basic income per share

$

(0.03

)

$

(0.21

)


85.7%

Diluted income per share

$

(0.03

)

$

(0.21

)


85.7%


Weighted average number of shares outstanding:


Basic


96.2


95.1


Diluted


96.2


95.1


Cash dividends declared per common share

$

0.075


$

0.065


Statistics (as a % of Net sales, except Income tax rate)


Three Months Ended
March 31,


2022


2021


Gross profit (Net sales, less Cost of products sold)


27.1

%


28.1

%


Selling, general and administrative expenses


22.4

%


22.9

%


Operating income (loss)


1.5

%


(0.3

)%


Loss before income tax


(0.2

)%


(6.4

)%


Net loss


(0.6

)%


(5.0

)%


Income tax rate

(170.0

)%


22.4

%

ACCO Brands Corporation and Subsidiaries

Condensed Consolidated Statements of Cash Flows (Unaudited)


Three Months Ended March 31,

(in millions)


2022


2021

Operating activities


Net loss

$


(2.7

)

$


(20.4

)

Amortization of inventory step-up


2.4


Change in fair value of contingent liability


2.6


6.7


Depreciation


9.9


9.6


Amortization of debt issuance costs


0.7


0.8


Amortization of intangibles


11.1


12.0


Stock-based compensation


4.9


4.8


Loss on debt extinguishment


3.7


Changes in balance sheet items:


Accounts receivable


84.1


34.4


Inventories


(37.3

)


(54.4

)

Other assets


(7.6

)


(13.3

)

Accounts payable


(87.5

)


11.3


Accrued expenses and other liabilities


(76.5

)


(27.9

)

Accrued income taxes


(5.9

)


(12.1

)

Net cash used by operating activities


(104.2

)


(42.4

)

Investing activities


Additions to property, plant and equipment


(3.4

)


(3.8

)

Cost of acquisitions, net of cash acquired


18.2


Net cash (used) provided by investing activities


(3.4

)


14.4


Financing activities


Proceeds from long-term borrowings


168.0


595.8


Repayments of long-term debt


(5.0

)


(509.0

)

(Repayments) proceeds of notes payable, net


(5.3

)


6.2


Payment for debt premium


(9.8

)

Payments for debt issuance costs


(9.7

)

Dividends paid


(7.3

)


(6.2

)

Payments related to tax withholding for stock-based compensation


(1.2

)


(0.9

)

Proceeds from the exercise of stock options


4.3


1.9


Net cash provided by financing activities


153.5


68.3


Effect of foreign exchange rate changes on cash and cash equivalents


4.2


(1.8

)

Net increase in cash and cash equivalents


50.1


38.5


Cash and cash equivalents


Beginning of the period


41.2


36.6


End of the period

$


91.3


$


75.1

About Non-GAAP Financial Measures

This earnings release contains non-GAAP financial measures. We explain below how we calculate and use each of these non-GAAP financial measures and a reconciliation of our current period and historical non-GAAP financial measures to the most directly comparable GAAP financial measures follows.

We use our non-GAAP financial measures both to explain our results to stockholders and the investment community and in the internal evaluation and management of our business. We believe our non-GAAP financial measures provide management and investors with a more complete understanding of our underlying operational results and trends, facilitate meaningful period-to-period comparisons and enhance an overall understanding of our past and future financial performance.

Our non-GAAP financial measures exclude certain items that may have a material impact upon our reported financial results such as restructuring charges, transaction and integration expenses associated with material acquisitions, the impact of foreign currency fluctuation and acquisitions, unusual tax items and other non-recurring items that we consider to be outside of our core operations. These measures should not be considered in isolation or as a substitute for, or superior to, the directly comparable GAAP financial measures and should be read in connection with the Company’s financial statements presented in accordance with GAAP.

Our non-GAAP financial measures include the following:

Comparable Net Sales : Represents net sales excluding the impact of material acquisitions with current-period foreign operation sales translated at prior-year currency rates. We believe comparable net sales are useful to investors and management because they reflect underlying sales and sales trends without the effect of acquisitions and fluctuations in foreign exchange rates and facilitate meaningful period-to-period comparisons. We sometimes refer to comparable net sales as comparable sales.

Adjusted Gross Profit : Represents gross profit excluding the effect of the amortization of the step-up in inventory from material acquisitions. We believe adjusted gross profit is useful to investors and management because it reflects underlying gross profit without the effect of inventory adjustments resulting from acquisitions that we consider to be outside our core operations and facilitates meaningful period-to-period comparisons.

Adjusted Selling, General and Administrative (SG&A) Expenses : Represents selling, general and administrative expenses excluding transaction and integration expenses related to our material acquisitions. We believe adjusted SG&A expenses are useful to investors and management because they reflect underlying SG&A expenses without the effect of expenses related to acquiring and integrating acquisitions that we consider to be outside our core operations and facilitate meaningful period-to-period comparisons.

Adjusted Operating Income/Adjusted Income Before Taxes/Adjusted Net Income/Adjusted Net Income Per Diluted Share: Represents operating income, income before taxes, net income, and net income per diluted share excluding restructuring charges, the amortization of intangibles, the amortization of the step-up in value of inventory, the change in fair value of contingent consideration, transaction and integration expenses associated with material acquisitions, non-recurring items in interest expense or other income/expense such as expenses associated with debt refinancing, a bond redemption, or a pension curtailment, and other non-recurring items as well as all unusual and discrete income tax adjustments, including income tax related to the foregoing. We believe these adjusted non-GAAP financial measures are useful to investors and management because they reflect our underlying operating performance before items that we consider to be outside our core operations and facilitate meaningful period-to-period comparisons. Senior management’s incentive compensation is derived, in part, using adjusted operating income and adjusted net income per diluted share, which is derived from adjusted net income. We sometimes refer to adjusted net income per diluted share as adjusted earnings per share.

Comparable Adjusted Net Income Per Diluted Share: Represents adjusted net income per diluted share excluding the incremental current year impact of foreign exchange. We sometimes refer to comparable adjusted net income per diluted share as comparable adjusted earnings per share.

Adjusted Income Tax Expense/Rate: Represents income tax expense/rate excluding the tax effect of the items that have been excluded from adjusted income before taxes, unusual income tax items such as the impact of tax audits and changes in laws, significant reserves for cash repatriation, excess tax benefits/losses, and other discrete tax items. We believe our adjusted income tax expense/rate is useful to investors because it reflects our baseline income tax expense/rate before benefits/losses and other discrete items that we consider to be outside our core operations and facilitates meaningful period-to-period comparisons.

Adjusted EBITDA: Represents net income excluding the effects of depreciation, stock-based compensation expense, amortization of intangibles, the change in fair value of contingent consideration, interest expense, net, other (income) expense, net, and income tax expense, the amortization of the step-up in value of inventory, transaction and integration expenses associated with material acquisitions, restructuring charges, non-recurring items in interest expense or other income/expense such as expenses associated with debt refinancing, a bond redemption, or a pension curtailment and other non-recurring items. We believe adjusted EBITDA is useful to investors because it reflects our underlying cash profitability and adjusts for certain non-cash charges, and items that we consider to be outside our core operations and facilitates meaningful period-to-period comparisons.

Free Cash Flow: Represents cash flow from operating activities less cash used for additions to property, plant and equipment, plus cash proceeds from the disposition of assets. We believe free cash flow is useful to investors because it measures our available cash flow for paying dividends, funding strategic material acquisitions, reducing debt, and repurchasing shares.

Net Leverage Ratio: Represents balance sheet debt, plus debt origination costs and less any cash and cash equivalents divided by adjusted EBITDA. We believe that net leverage ratio is useful to investors since the company has the ability to, and may decide to use a portion of its cash and cash equivalents to retire debt.

This earnings release also provides forward-looking non-GAAP comparable net sales, adjusted earnings per share, comparable adjusted earnings per share, free cash flow, adjusted EBITDA, net leverage ratio and adjusted tax rate. We do not provide a reconciliation of forward-looking comparable net sales, adjusted earnings per share, comparable adjusted earnings per share, free cash flow, adjusted EBITDA, net leverage ratio or adjusted tax rate to GAAP because the GAAP financial measure is not accessible on a forward-looking basis and reconciling information is not available without unreasonable effort due to the inherent difficulty of forecasting and quantifying certain amounts that are necessary for such a reconciliation, including adjustments that could be made for restructuring, integration and acquisition-related expenses, the variability of our tax rate and the impact of foreign currency fluctuation and material acquisitions, and other charges reflected in our historical numbers. The probable significance of each of these items is high and, based on historical experience, could be material.

ACCO Brands Corporation and Subsidiaries

Reconciliation of GAAP to Adjusted Non-GAAP Information (Unaudited)

(In millions, except per share data)


The following tables set forth a reconciliation of certain Consolidated Statements of Income information reported in accordance with GAAP to adjusted Non-GAAP Information for the three months ended March 31, 2022 and 2021.


Three Months Ended March 31, 2022


SG&A


% of
Sales


Operating
Income


% of
Sales


(Loss) Income
before Tax


% of
Sales


Income Tax
Expense (E)


Tax
Rate


Net (Loss)
Income


% of
Sales


Reported GAAP


$


98.8


22.4

%


$


6.8


1.5

%


$


(1.0

)


(0.2

)%


$


1.7


(170.0

)%


$


(2.7

)


(0.6

)%

Reported GAAP diluted income per share (EPS)


$


(0.03

)


Charge for Russia business

(A)


(1.8

)


1.8


1.8


0.4


1.4


Restructuring charges


0.3


0.3


0.1


0.2


Amortization of intangibles


11.1


11.1


3.0


8.1


Change in fair value of contingent consideration

(B)


2.6


2.6


0.7


1.9


Operating tax gains

(H)


(0.1

)


(0.1

)


Other discrete tax items

(I)


(1.6

)


1.6


Adjusted Non-GAAP


$


97.0


22.0

%


$


22.6


5.1

%


$


14.7


3.3

%


$


4.3


29.0

%


$


10.4


2.4

%

Adjusted diluted income per share (Adjusted EPS)


$


0.11


Three Months Ended March 31, 2021


Gross Profit


% of
Sales


SG&A


% of
Sales


Operating
(Loss)
Income


% of
Sales


Income
before Tax


% of
Sales


Income Tax
(Benefit)
Expense (E)


Tax
Rate


Net (Loss)
Income


% of
Sales


Reported GAAP


$

115.5


28.1

%


$

94.0


22.9

%


$

(1.1

)


(0.3

)%


$

(26.3

)


(6.4

)%


$

(5.9

)


22.4

%


$


(20.4

)


(5.0

)%

Reported GAAP diluted income per share (EPS)


$


(0.21

)


Inventory step-up amortization

(C)


2.4


2.4


2.4


0.6


1.8


Transaction and integration expenses

(D)


(0.7

)


0.7


0.7


0.2


0.5


Restructuring charges


3.9


3.9


1.0


2.9


Amortization of intangibles


12.0


12.0


3.2


8.8


Change in fair value of contingent consideration

(B)


6.7


6.7


1.7


5.0


Refinancing costs

(E)


3.7


1.0


2.7


Bond redemption

(F)


9.8


2.6


7.2


Pension curtailment

(G)


1.4


0.4


1.0


Operating tax gain

(H)


(0.2

)


(0.2

)


Other discrete tax items

(I)


(0.7

)


0.7


Adjusted Non-GAAP


$

117.9


28.7

%


$

93.3


22.7

%


$

24.6


6.0

%


$

14.1


3.4

%


$

4.1


29.1

%


$


10.0


2.4

%

Adjusted diluted income per share (Adjusted EPS)


$


0.10


See “Notes to Reconciliations of GAAP to Adjusted Non-GAAP Information and Net Income to Adjusted EBITDA (Unaudited)” for further information regarding adjusted items.

ACCO Brands Corporation and Subsidiaries

Reconciliation of Net Income to Adjusted EBITDA (Unaudited)

(In millions)


The following table sets forth a reconciliation of net income reported in accordance with GAAP to Adjusted EBITDA.


Three Months Ended
March 31,


2022


2021


% Change

Net loss


$


(2.7

)

$


(20.4

)


86.8

%

Inventory step-up amortization

(C)


2.4


(100.0

)%

Transaction and integration expenses

(D)


0.7


(100.0

)%

Stock-based compensation


4.9


4.8


2.1

%

Depreciation


9.9


9.6


3.1

%

Charge for Russia business

(A)


1.8


NM


Amortization of intangibles


11.1


12.0


(7.5

)%

Restructuring charges


0.3


3.9


(92.3

)%

Change in fair value of contingent consideration

(B)


2.6


6.7


(61.2

)%

Pension curtailment

(G)


1.4


(100.0

)%

Interest expense, net


8.3


13.1


(36.6

)%

Other expense, net


0.9


12.9


(93.0

)%

Income tax expense (benefit)


1.7


(5.9

)


NM


Adjusted EBITDA (non-GAAP)


$


38.8


$


41.2


(5.8

)%

Adjusted EBITDA as a % of Net Sales


8.8

%


10.0

%


See “Notes to Reconciliations of GAAP to Adjusted Non-GAAP Information and Net Income to Adjusted EBITDA (Unaudited)” for further information regarding adjusted items.

Reconciliation of Net Cash Used by Operating Activities to Free Cash Flow (Unaudited)

(In millions)


The following table sets forth a reconciliation of net cash provided by operating activities reported in accordance with GAAP to Free Cash Flow.


Three Months Ended
March 31, 2022


Three Months Ended
March 31, 2021

Net cash used by operating activities

$

(104.2)

$

(42.4)

Net cash used by:


Additions to property, plant and equipment


(3.4)


(3.8)

Free cash flow (non-GAAP)

$

(107.6)

$

(46.2)

Notes to Reconciliations of GAAP to Adjusted Non-GAAP Information and Net Income to Adjusted EBITDA (Unaudited)


A.

Represents charge to operating expense related to our Russia business.

B.

Represents the change in fair value of the contingent consideration for the PowerA acquisition. The change in fair value of the contingent consideration is assessed every quarter and is included as an expense in the consolidated statements of income.

C.

Represents the amortization of step-up in the value of inventory associated with the PowerA acquisition.

D.

Represents transaction and integration expenses associated with our acquisitions.

E.

Represents the write-off of debt issuance costs and other costs associated with the Company’s 2021 debt refinancing and discharge of its obligations on the senior unsecured notes due in 2024.

F.

Represents a call premium on the 2021 redemption of the senior unsecured notes due in 2024.

G.

Represents a pension curtailment related to a restructuring projects.

H.

Represents gain related to the release of unneeded reserves for certain operating taxes.

I.

The adjustments to income tax expense include the effects of the adjustments outlined above and discrete tax adjustments.

ACCO Brands Corporation and Subsidiaries

Supplemental Business Segment Information and Reconciliation (Unaudited)

(In millions)


2022


2021


Changes


Adjusted


Adjusted


Reported


Adjusted


Operating


Reported


Adjusted


Operating


Adjusted


Adjusted


Operating


Operating


Income


Operating


Operating


Income


Operating


Operating


Reported


Income


Adjusted


Income


(Loss)


Reported


Income


Adjusted


Income


(Loss)


Net Sales


Net Sales


Income


Income


Margin


Net Sales


(Loss)


Items


(Loss)


Margin


Net Sales


(Loss)


Items


(Loss)


Margin


$


%


(Loss) $


(Loss) %


Points


Q1:


ACCO Brands North America

$


208.5


$


13.9


$


5.9


$


19.8


9.5%

$


188.8


$


(0.7

)

$


11.9


$


11.2


5.9%

$


19.7


10.4%

$


8.6


76.8%


360


ACCO Brands EMEA


156.1


5.6


3.5


9.1


5.8%


156.9


16.8


4.4


21.2


13.5%


(0.8

)


(0.5)%


(12.1

)


(57.1)%


(770

)

ACCO Brands International


77.0


4.2


2.0


6.2


8.1%


64.8


0.6


2.5


3.1


4.8%


12.2


18.8%


3.1


100.0%


330


Corporate


(16.9

)


4.4


(12.5

)


(17.8

)


6.9


(10.9

)


(1.6

)


Total

$


441.6


$


6.8


$


15.8


$


22.6


5.1%

$


410.5


$


(1.1

)

$


25.7


$


24.6


6.0%

$


31.1


7.6%

$


(2.0

)


(8.1)%


(90

)


Q2:


ACCO Brands North America


$


295.1


$


53.8


$


6.1


$


59.9


20.3%


ACCO Brands EMEA


157.0


9.9


3.9


13.8


8.8%


ACCO Brands International


65.7


2.8


2.0


4.8


7.3%


Corporate


(16.6

)


5.3


(11.3

)


Total


$


517.8


$


49.9


$


17.3


$


67.2


13.0%


Q3:


ACCO Brands North America


$


287.5


$


34.6


$


7.0


$


41.6


14.5%


ACCO Brands EMEA


161.1


13.4


3.9


17.3


10.7%


ACCO Brands International


78.1


7.3


2.5


9.8


12.5%


Corporate


(16.7

)


5.0


(11.7

)


Total


$


526.7


$


38.6


$


18.4


$


57.0


10.8%


Q4:


ACCO Brands North America


$


271.0


$


34.2


$


7.7


$


41.9


15.5%


ACCO Brands EMEA


187.9


21.6


3.3


24.9


13.3%


ACCO Brands International


111.4


20.9


2.0


22.9


20.6%


Corporate


(13.1

)


2.5


(10.6

)


Total


$


570.3


$


63.6


$


15.5


$


79.1


13.9%


YTD:


ACCO Brands North America

$


208.5


$


13.9


$


5.9


$


19.8


9.5%

$


1,042.4


$


121.9


$


32.7


$


154.6


14.8%


ACCO Brands EMEA


156.1


5.6


3.5


9.1


5.8%


662.9


61.7


15.5


77.2


11.6%


ACCO Brands International


77.0


4.2


2.0


6.2


8.1%


320.0


31.6


9.0


40.6


12.7%


Corporate


(16.9

)


4.4


(12.5

)


(64.2

)


19.7


(44.5

)


Total

$


441.6


$


6.8


$


15.8


$


22.6


5.1%

$


2,025.3


$


151.0


$


76.9


$


227.9


11.3%


See “Notes to Reconciliations of GAAP to Adjusted Non-GAAP Information and Net Income to Adjusted EBITDA (Unaudited)” for further information regarding adjusted items.

ACCO Brands Corporation and Subsidiaries

Supplemental Net Sales Change Analysis (Unaudited)


% Change – Net Sales


$ Change – Net Sales (in millions)


GAAP

Non-GAAP


GAAP

Non-GAAP


Comparable


Comparable


Net Sales


Currency


Net Sales


Net Sales


Currency


Net Sales


Comparable


Change


Translation


Change


Change


Translation


Change


Net Sales

Q1 2022:


ACCO Brands North America


10.4 %


— %


10.4 %


$

19.7

$

$

19.7

$

208.5

ACCO Brands EMEA


(0.5)%


(7.9)%


7.4 %


(0.8)


(12.4)


11.6


168.5

ACCO Brands International


18.8 %


(3.9)%


22.7 %


12.2


(2.5)


14.7


79.5

Total


7.6 %


(3.6)%


11.2 %


$

31.1

$

(14.9)

$

46.0

$

456.5


Christine Hanneman
Investor Relations
(847) 796-4320

Julie McEwan
Media Relations
(937) 974-8162

Source: ACCO Brands Corporation

Release – Ayala Pharmaceuticals Announces Poster Presentation on AL101


Ayala Pharmaceuticals Announces Poster Presentation on AL101 at the 2022 American Society of Clinical Oncology (ASCO) Annual Meeting

Research, News, and Market Data on Ayala Pharmaceuticals


REHOVOT, Israel and WILMINGTON, Del., April 27, 2022 (GLOBE NEWSWIRE) — Ayala Pharmaceuticals, Inc. (Nasdaq: AYLA), a clinical-stage oncology company focused on developing and commercializing small molecule therapeutics for patients suffering from rare and aggressive cancers, primarily in genetically defined patient populations, today announced that it will present a poster featuring data on AL101 in adenoid cystic carcinoma (ACC) at the 2022 American Society of Clinical Oncology (ASCO) Annual Meeting, to take place June 3-7, 2022 in Chicago, Illinois.

Details of the poster presentation are as follows:
 
Abstract Title: Results of ACCURACY: A phase 2 trial of AL101, a selective gamma
secretase inhibitor, in subjects with recurrent/metastatic (R/M) adenoid
cystic carcinoma (ACC) harboring Notch activating mutations (Notchmut)
Abstract Number: 6046
Session Title: Head and Neck Cancer
Session Date and Time: Monday, June 6, 2022, 1:15 PM-4:15 PM CDT

The ongoing Phase 2 ACCURACY clinical trial is an open-label, single-arm, multi-center study to assess the clinical activity of AL101 using radiographic assessments of patients with R/M ACC demonstrating disease progression within 6 months prior to dosing. The company will present safety, efficacy, PK and PD data from the 4mg and 6mg AL101 cohorts in the trial.

About Adenoid Cystic Carcinoma (ACC)

ACC is a rare malignancy of the secretory glands including salivary glands, accounting for about 10% of all salivary gland tumors with an annual incidence of 3,400 in the U.S. There is currently no approved standard of care for patients with recurrent/metastatic ACC. Patients with locoregional disease undergo surgery and radiation therapy, with recurring disease treated by chemotherapy. ACC is an immunologically “cold” tumor that is refractory to chemotherapy, with a recurrence rate of about 60% after initial surgery. The Notch pathway has been determined to be an oncogenic driver of ACC and its dysregulation plays a key role in tumorigenesis and correlates with a distinct pattern of metastasis and a poor prognosis.

About AL101

AL101 is an investigational small molecule Gamma Secretase Inhibitor (GSI) that is designed to potently and selectively inhibit Notch 1, 2, 3 and 4, and is currently being evaluated in the Phase 2 ACCURACY clinical studies in patients with adenoid cystic carcinoma (ACC). AL101 is designed to inhibit the expression of Notch gene targets by blocking the final cleavage step by the gamma secretase required for Notch activation. Ayala obtained an exclusive, worldwide license to develop and commercialize AL101 from Bristol-Myers Squibb Company in November 2017. AL101 was granted U.S. FDA Fast Track Designation and Orphan Drug Designation for the treatment of ACC.

About Ayala Pharmaceuticals
Ayala Pharmaceuticals, Inc. is a clinical-stage oncology company focused on developing and commercializing small molecule therapeutics for patients suffering from rare and aggressive cancers, primarily in genetically defined patient populations. Ayala’s approach is focused on predicating, identifying and addressing tumorigenic drivers of cancer through a combination of its bioinformatics platform and next-generation sequencing to deliver targeted therapies to underserved patient populations. The company has two product candidates under development, AL101 and AL102, targeting the aberrant activation of the Notch pathway with gamma secretase inhibitors to treat a variety of tumors including Adenoid Cystic Carcinoma, Triple Negative Breast Cancer (TNBC), T-cell Acute Lymphoblastic Leukemia (T-ALL), Desmoid Tumors and Multiple Myeloma (MM) (in collaboration with Novartis). AL101, has received Fast Track Designation and Orphan Drug Designation from the U.S. FDA and is currently in a Phase 2 clinical trial for patients with ACC (ACCURACY) bearing Notch activating mutations. AL102 is currently in a Pivotal Phase 2/3 clinical trials for patients with desmoid tumors (RINGSIDE) and is being evaluated in a Phase 1 clinical trial in combination with Novartis’ BMCA targeting agent, WVT078, in Patients with relapsed/refractory Multiple Myeloma. For more information, visit www.ayalapharma.com.
Contacts:

Investors:
Joyce Allaire
LifeSci Advisors LLC
+1-617-435-6602
jallaire@lifesciadvisors.com

Ayala Pharmaceuticals:
+1-857-444-0553
info@ayalapharma.com

Forward-Looking Statements
This press release contains forward-looking statements within the meaning of the Private Securities Litigation Reform Act of 1995. All statements contained in this press release that do not relate to matters of historical fact should be considered forward-looking statements, including statements relating to our development of AL101 and AL102, the promise and potential impact of our preclinical or clinical trial data, the timing of and plans to initiate additional clinical trials of AL101 and AL102, the timing and results of any clinical trials or readouts, the sufficiency of cash to fund operations, and the anticipated impact of COVID-19, on our business. These forward-looking statements are based on management’s current expectations. The words ”may,” “will,” “should,” “expect,” “plan,” “anticipate,” “could,” “intend,” “target,” “project,” “estimate,” “believe,” “predict,” “potential” or “continue” or the negative of these terms or other similar expressions are intended to identify forward-looking statements, although not all forward-looking statements contain these identifying words.

These statements are neither promises nor guarantees, but involve known and unknown risks, uncertainties and other important factors that may cause our actual results, performance or achievements to be materially different from any future results, performance or achievements expressed or implied by the forward-looking statements, including, but not limited to, the following: we have incurred significant losses since inception and anticipate that we will continue to incur losses for the foreseeable future. We are not currently profitable, and we may never achieve or sustain profitability; we will require additional capital to fund our operations, and if we fail to obtain necessary financing, we may not be able to complete the development and commercialization of AL101 and AL102; we have a limited operating history and no history of commercializing pharmaceutical products, which may make it difficult to evaluate the prospects for our future viability; we are heavily dependent on the success of AL101 and AL102, our most advanced product candidates, which are still under clinical development, and if either AL101 or AL102 does not receive regulatory approval or is not successfully commercialized, our business may be harmed; due to our limited resources and access to capital, we must prioritize development of certain programs and product candidates; these decisions may prove to be wrong and may adversely affect our business; the outbreak of COVID-19, may adversely affect our business, including our clinical trials; our ability to use our net operating loss carry forwards to offset future taxable income may be subject to certain limitations; our product candidates are designed for patients with genetically defined cancers, which is a rapidly evolving area of science, and the approach we are taking to discover and develop product candidates is novel and may never lead to marketable products; we were not involved in the early development of our lead product candidates; therefore, we are dependent on third parties having accurately generated, collected and interpreted data from certain preclinical studies and clinical trials for our product candidates; enrollment and retention of patients in clinical trials is an expensive and time-consuming process and could be made more difficult or rendered impossible by multiple factors outside our control; if we do not achieve our projected development and commercialization goals in the timeframes we announce and expect, the commercialization of our product candidates may be delayed and our business will be harmed; our product candidates may cause serious adverse events or undesirable side effects, which may delay or prevent marketing approval, or, if approved, require them to be taken off the market, require them to include safety warnings or otherwise limit their sales; the market opportunities for AL101 and AL102, if approved, may be smaller than we anticipate; we may not be successful in developing, or collaborating with others to develop, diagnostic tests to identify patients with Notch-activating mutations; we have never obtained marketing approval for a product candidate and we may be unable to obtain, or may be delayed in obtaining, marketing approval for any of our product candidates; even if we obtain FDA approval for our product candidates in the United States, we may never obtain approval for or commercialize them in any other jurisdiction, which would limit our ability to realize their full market potential; we have been granted Orphan Drug Designation for AL101 for the treatment of ACC and may seek Orphan Drug Designation for other indications or product candidates, and we may be unable to maintain the benefits associated with Orphan Drug Designation, including the potential for market exclusivity, and may not receive Orphan Drug Designation for other indications or for our other product candidates; although we have received Fast Track designation for AL101, and may seek Fast Track designation for our other product candidates, such designations may not actually lead to a faster development timeline, regulatory review or approval process; we face significant competition from other biotechnology and pharmaceutical companies and our operating results will suffer if we fail to compete effectively; we are dependent on a small number of suppliers for some of the materials used to manufacture our product candidates, and on one company for the manufacture of the active pharmaceutical ingredient for each of our product candidates; our existing collaboration with Novartis is, and any future collaborations will be, important to our business. If we are unable to maintain our existing collaboration or enter into new collaborations, or if these collaborations are not successful, our business could be adversely affected; enacted and future healthcare legislation may increase the difficulty and cost for us to obtain marketing approval of and commercialize our product candidates, if approved, and may affect the prices we may set; if we are unable to obtain, maintain, protect and enforce patent and other intellectual property protection for our technology and products or if the scope of the patent or other intellectual property protection obtained is not sufficiently broad, our competitors could develop and commercialize products and technology similar or identical to ours, and we may not be able to compete effectively in our markets; we may engage in acquisitions or in-licensing transactions that could disrupt our business, cause dilution to our stockholders or reduce our financial resources; and risks related to our operations in Israel could materially adversely impact our business, financial condition and results of operations.
These and other important factors discussed under the caption “Risk Factors” in our Annual Report on Form 10-K for the year ended December 31, 2020 filed with the U.S. Securities and Exchange Commission (SEC) on March 24, 2021 and our other filings with the SEC, could cause actual results to differ materially from those indicated by the forward-looking statements made in this press release. Any such forward-looking statements represent management’s estimates as of the date of this press release. New risk factors and uncertainties may emerge from time to time, and it is not possible to predict all risk factors and uncertainties. While we may elect to update such forward-looking statements at some point in the future, except as required by law, we disclaim any obligation to do so, even if subsequent events cause our views to change. Although we believe the expectations reflected in such forward-looking statements are reasonable, we can give no assurance that such expectations will prove to be correct. These forward-looking statements should not be relied upon as representing our views as of any date subsequent to the date of this press release.

Townsquare Media (TSQ) – A Mispriced Stock?

Wednesday, April 27, 2022

Townsquare Media (TSQ)
A Mispriced Stock?

Townsquare Media Inc is an entertainment and media company offering digital marketing solutions in the United States and Canada. It owns and operates radio stations, social media properties focusing the small and mid-cap companies. Services offered to the clients include live events, local advertising, digital advertising, e-commerce offerings, few others. The segments through which the company operates its businesses are classified into Local marketing solutions and Entertainment segments. Revenues are generated from commercials through broadcasts and sale of internet based advertisements.

Michael Kupinski, Director of Research, Noble Capital Markets, Inc.

Patrick McCann, Research Associate, Noble Capital Markets, Inc.

Refer to the full report for the price target, fundamental analysis, and rating.

    Noblecon 18 highlights. Townsquare CFO, Bill Wilson, presented at Noblecon18, speaking on a range of topics such as, the company’s evolution from a pure-play broadcaster to a digital-first company, the competitive advantages to bringing a scaled operation to small markets, and the organic nature of digital revenue growth. The full replay of the presentation can be found here.

    Fast-growing digital.  Mr. Wilson highlighted the robust growth of the company’s Digital businesses, noting that digital advertising is the fastest growing segment of the business, growing 20.5% in 2021. The company’s digital marketing solutions business has also experienced impressive growth with record net subscriber additions in both 2020 and 2021 …


This Company Sponsored Research is provided by Noble Capital Markets, Inc., a FINRA and S.E.C. registered broker-dealer (B/D).

*Analyst certification and important disclosures included in the full report. NOTE: investment decisions should not be based upon the content of this research summary. Proper due diligence is required before making any investment decision. 


Travelzoo (TZOO) – Flies By Expectations

Wednesday, April 27, 2022

Travelzoo (TZOO)
Flies By Expectations

Travelzoo is a US-based company which acts as a publisher of travel and entertainment offers. The company informs a varied number of members in Asia Pacific, Europe, and North America, as well as millions of website users, about the best travel, entertainment and local deals available from various companies. It provides travel, entertainment, and local businesses in a flexible manner to the various customer. The company operates in three geographic segments namely Asia Pacific, Europe, and North America. Travelzoo derives its revenue through advertising fees including listing fees paid by travel, entertainment, and local businesses to advertise their offers on company’s media properties. Most of the company’s revenue is derived from the North America.

Michael Kupinski, Director of Research, Noble Capital Markets, Inc.

Refer to the full report for the price target, fundamental analysis, and rating.

    Exceeds Q1 estimates. Q1 revenues of $18.4 million was better than our $16.8 million estimate, with better than expected revenue growth in Europe and a nice rebound in North America. With costs slightly below estimates, adj. EBITDA was significantly better, $3.0 million versus our $0.6 million estimate.

    Operating on all cylinders.  Both Europe and North America contributed to the strong revenue. Europe increased 66% to $5.9 million and North America was up 19% to $11.7 million from the year earlier quarter. The company benefited from two acquisitions in the quarter, (not detailed), but enhanced European revenues and saved costs, expanding margins …


This Company Sponsored Research is provided by Noble Capital Markets, Inc., a FINRA and S.E.C. registered broker-dealer (B/D).

*Analyst certification and important disclosures included in the full report. NOTE: investment decisions should not be based upon the content of this research summary. Proper due diligence is required before making any investment decision. 


Salem Media (SALM) – Highlights Its Significant Digital Businesses

Wednesday, April 27, 2022

Salem Media (SALM)
Highlights Its Significant Digital Businesses

Salem Media Group is America’s leading radio broadcaster, Internet content provider, and magazine and book publisher targeting audiences interested in Christian and family-themed content and conservative values. In addition to its radio properties, Salem owns Salem Radio Network, which syndicates talk, news and music programming to approximately 2700 affiliates; Salem Radio Representatives, a national radio advertising sales force; Salem Web Network, a leading Internet provider of Christian content and online streaming; and Salem Publishing, a leading publisher of Christian themed magazines. Salem owns and operates 115 radio stations, with 73 stations in the nation’s top 25 top markets – and 25 in the top 10. Each of our radio properties has a full portfolio of broadcast and digital marketing opportunities.

Michael Kupinski, Director of Research, Noble Capital Markets, Inc.

Patrick McCann, Research Associate, Noble Capital Markets, Inc.

Refer to the full report for the price target, fundamental analysis, and rating.

    NobleCon18 highlights. Evan Masyr, CFO, updated the company’s presentation to highlight its compelling digital businesses, which represent a solid 29% of total company revenues. These businesses have grown revenues at a 17% compound annual growth rate over the past 3 years. To watch a full replay of the presentation, please click here.

    A durable broadcast business.  Block programming, in which non-profits purchase ad-free air time and fund it through contributions from their audiences, is the largest component of the Radio segment, at 47% of Radio revenue and 28% of total company revenue. There are very high renewal rates of over 95% annually for the format, which tends to be very recession resilient. In 2022, the Block …


This Company Sponsored Research is provided by Noble Capital Markets, Inc., a FINRA and S.E.C. registered broker-dealer (B/D).

*Analyst certification and important disclosures included in the full report. NOTE: investment decisions should not be based upon the content of this research summary. Proper due diligence is required before making any investment decision. 


One Stop Systems (OSS) – Two Autonomous Truck Program Wins

Wednesday, April 27, 2022

One Stop Systems (OSS)
Two Autonomous Truck Program Wins

One Stop Systems Inc is US-based company which is principally engaged in designing, manufacturing, marketing high-end systems for high performance computing (HPC) applications. The company offers custom servers, compute accelerators, solid-state storage arrays and system expansion systems. The product line of the company includes GPU Appliances, GPU Expansion, GPUs and co-processors, Flash storage arrays, Flash storage expansion, Servers, Disk Arrays, Desktop computing appliances, accessories and parts. The company delivers high-end technology to customers through the sale of equipment and software for use on their premises or through remote cloud access to secure data centres housing technology.

Joe Gomes, Senior Research Analyst, Noble Capital Markets, Inc.

Joshua Zoepfel, Research Associate, Noble Capital Markets, Inc.

Refer to the full report for the price target, fundamental analysis, and rating.

    Program Wins. OSS announced two new autonomous truck program wins with a pioneer in self-driving technology and a subsidiary of one of the world’s largest commercial vehicle manufacturers using Level 4 driving automation. Although details about award size, length, and customer were not provided, we believe the awards are a testament to the Company’s leadership position in the fast growing autonomous truck market.

    Centauri.  Along with the awards announcement, One Stop unveiled its new Centauri Rugged Storage and Server Platforms system. Centauri is a PCIe Gen 4 NVMe rugged storage product offering high capacity in a compact hot-swappable canister that slides into the Centauri chassis. Product shipments are expected to begin in June 2022 against confirmed purchase orders …


This Company Sponsored Research is provided by Noble Capital Markets, Inc., a FINRA and S.E.C. registered broker-dealer (B/D).

*Analyst certification and important disclosures included in the full report. NOTE: investment decisions should not be based upon the content of this research summary. Proper due diligence is required before making any investment decision. 


Exploration and Production Review and Outlook – Noble Capital Markets Energy Sector Review – Q1 2022

Energy: First Quarter 2022 Review and Outlook

Noble Capital Markets Energy Sector Newsletter

Source: Capital IQ as of 03/31/2022

Energy Fundamental Data

Source: Energy Information Administration as of 12/31/2021

ENERGY INDUSTRY OUTLOOK

Energy Stocks Remain On A Tear

Energy Stocks Performance

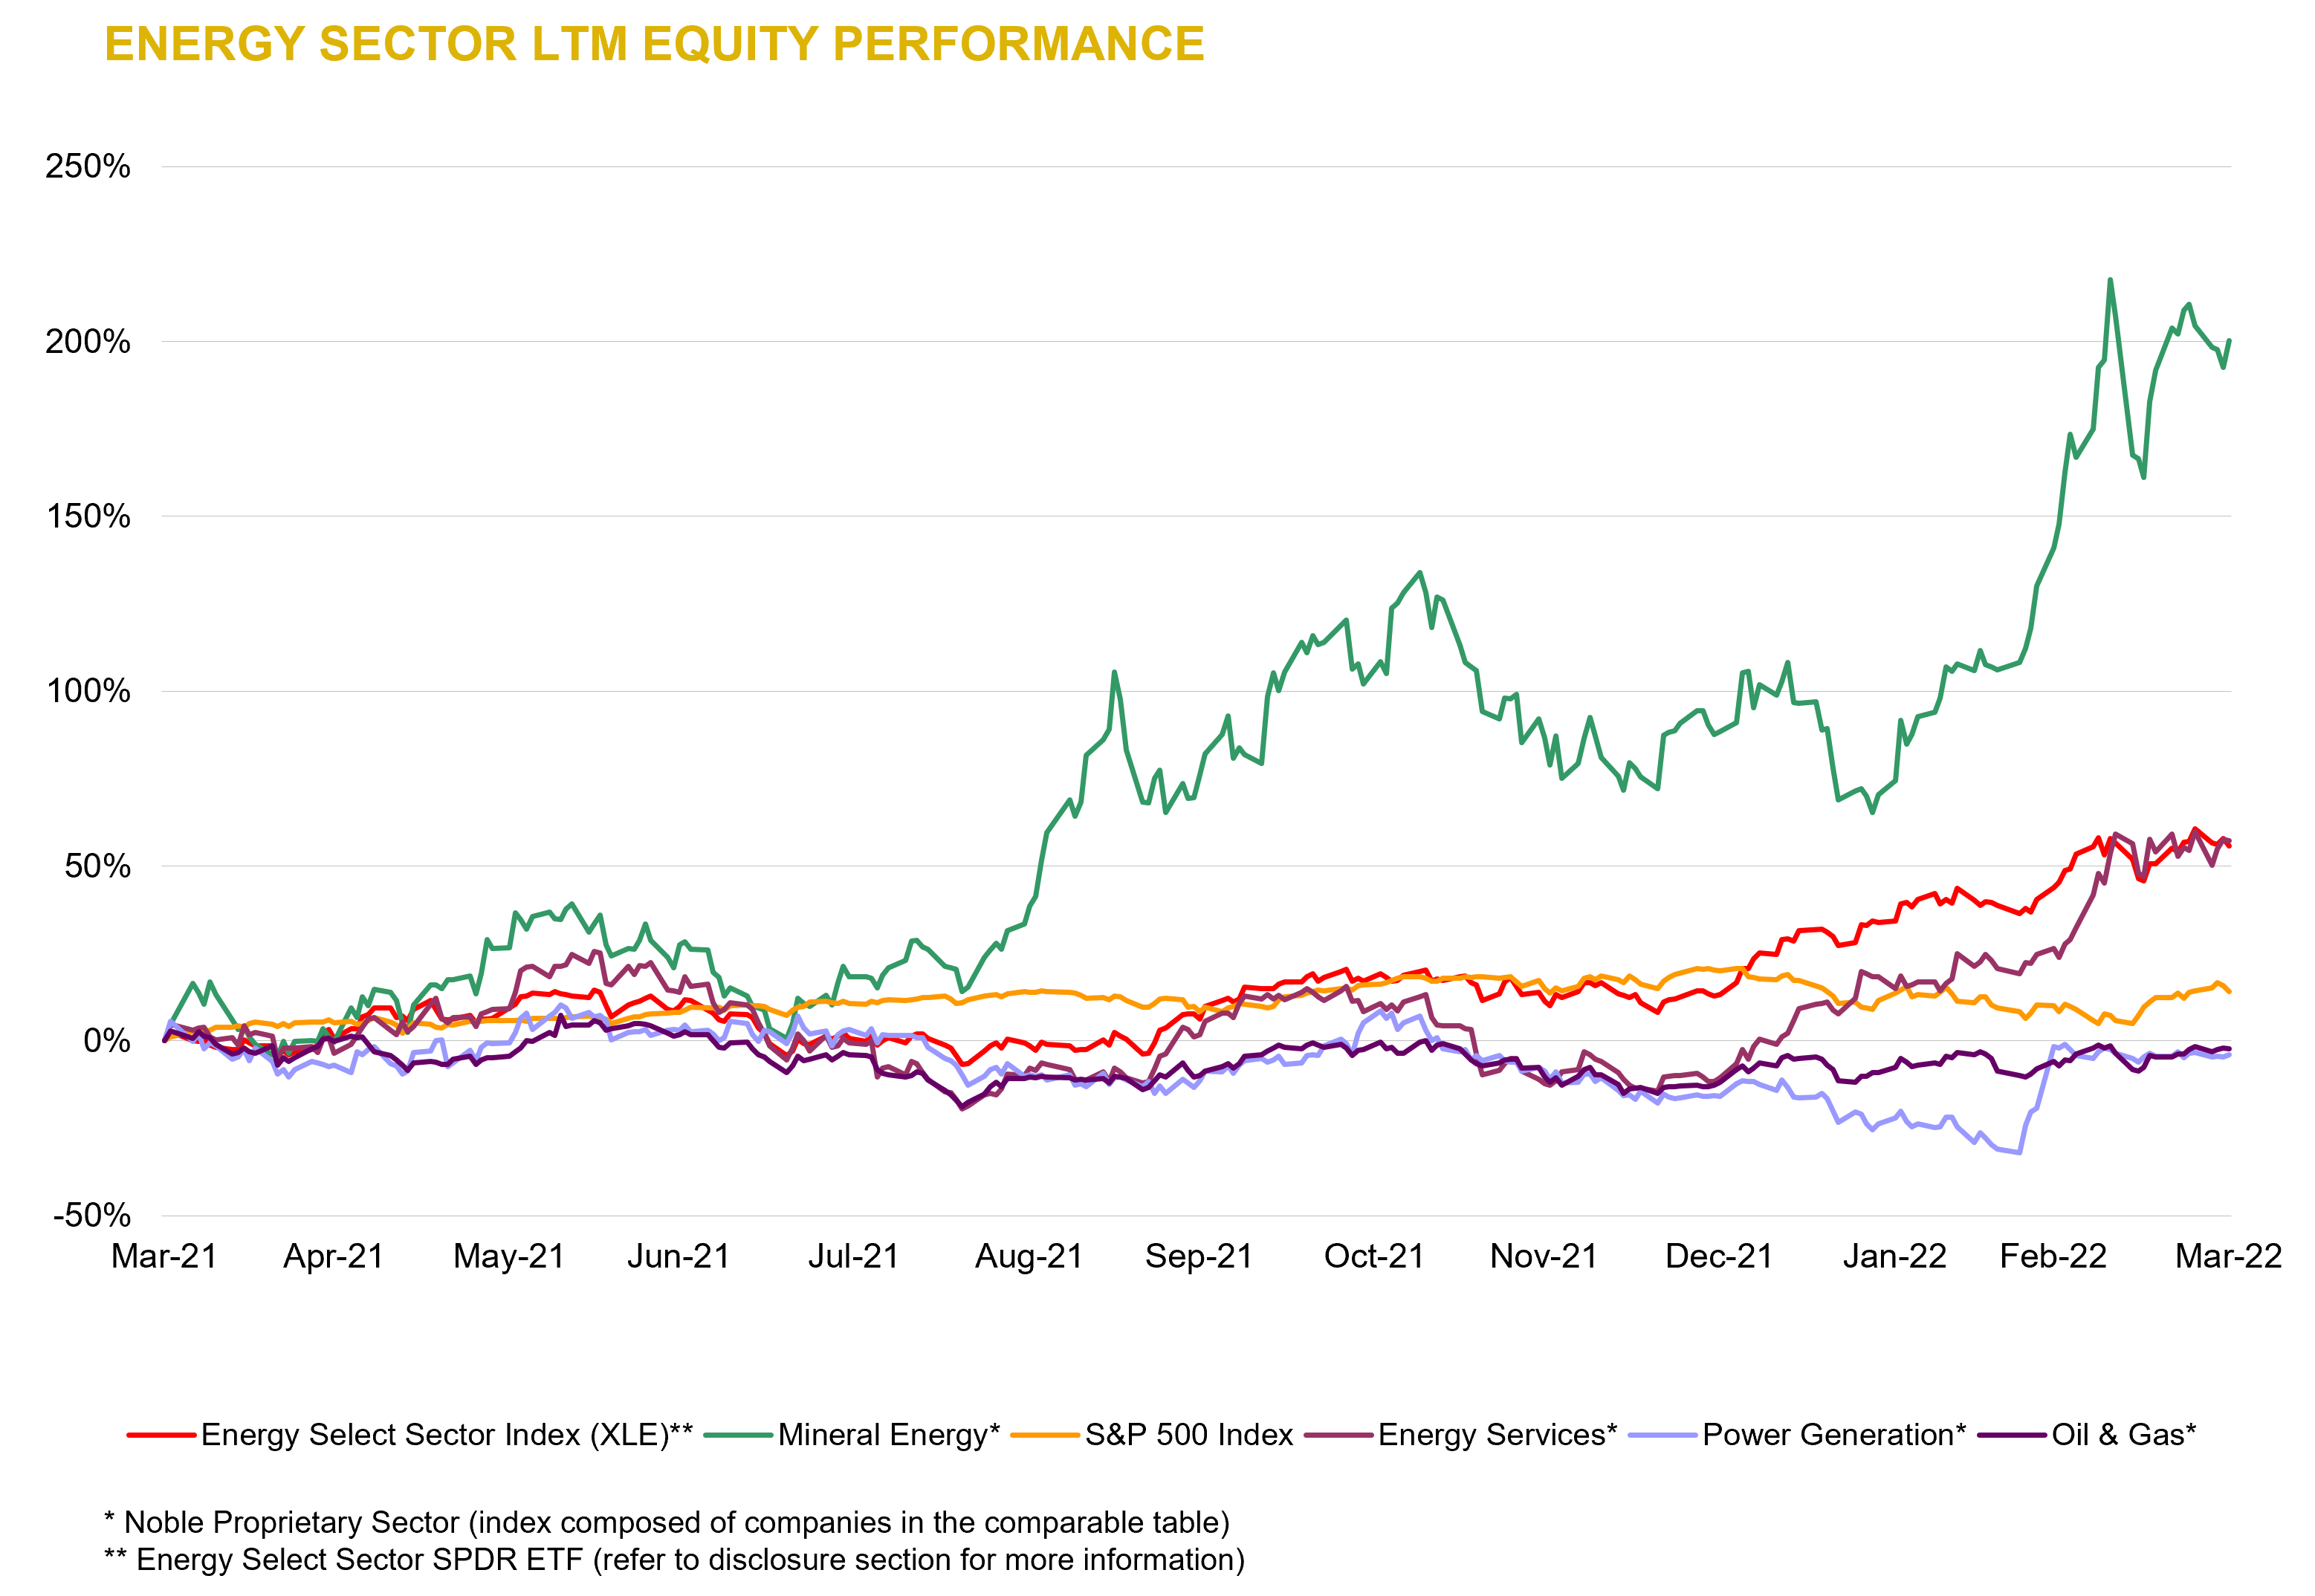
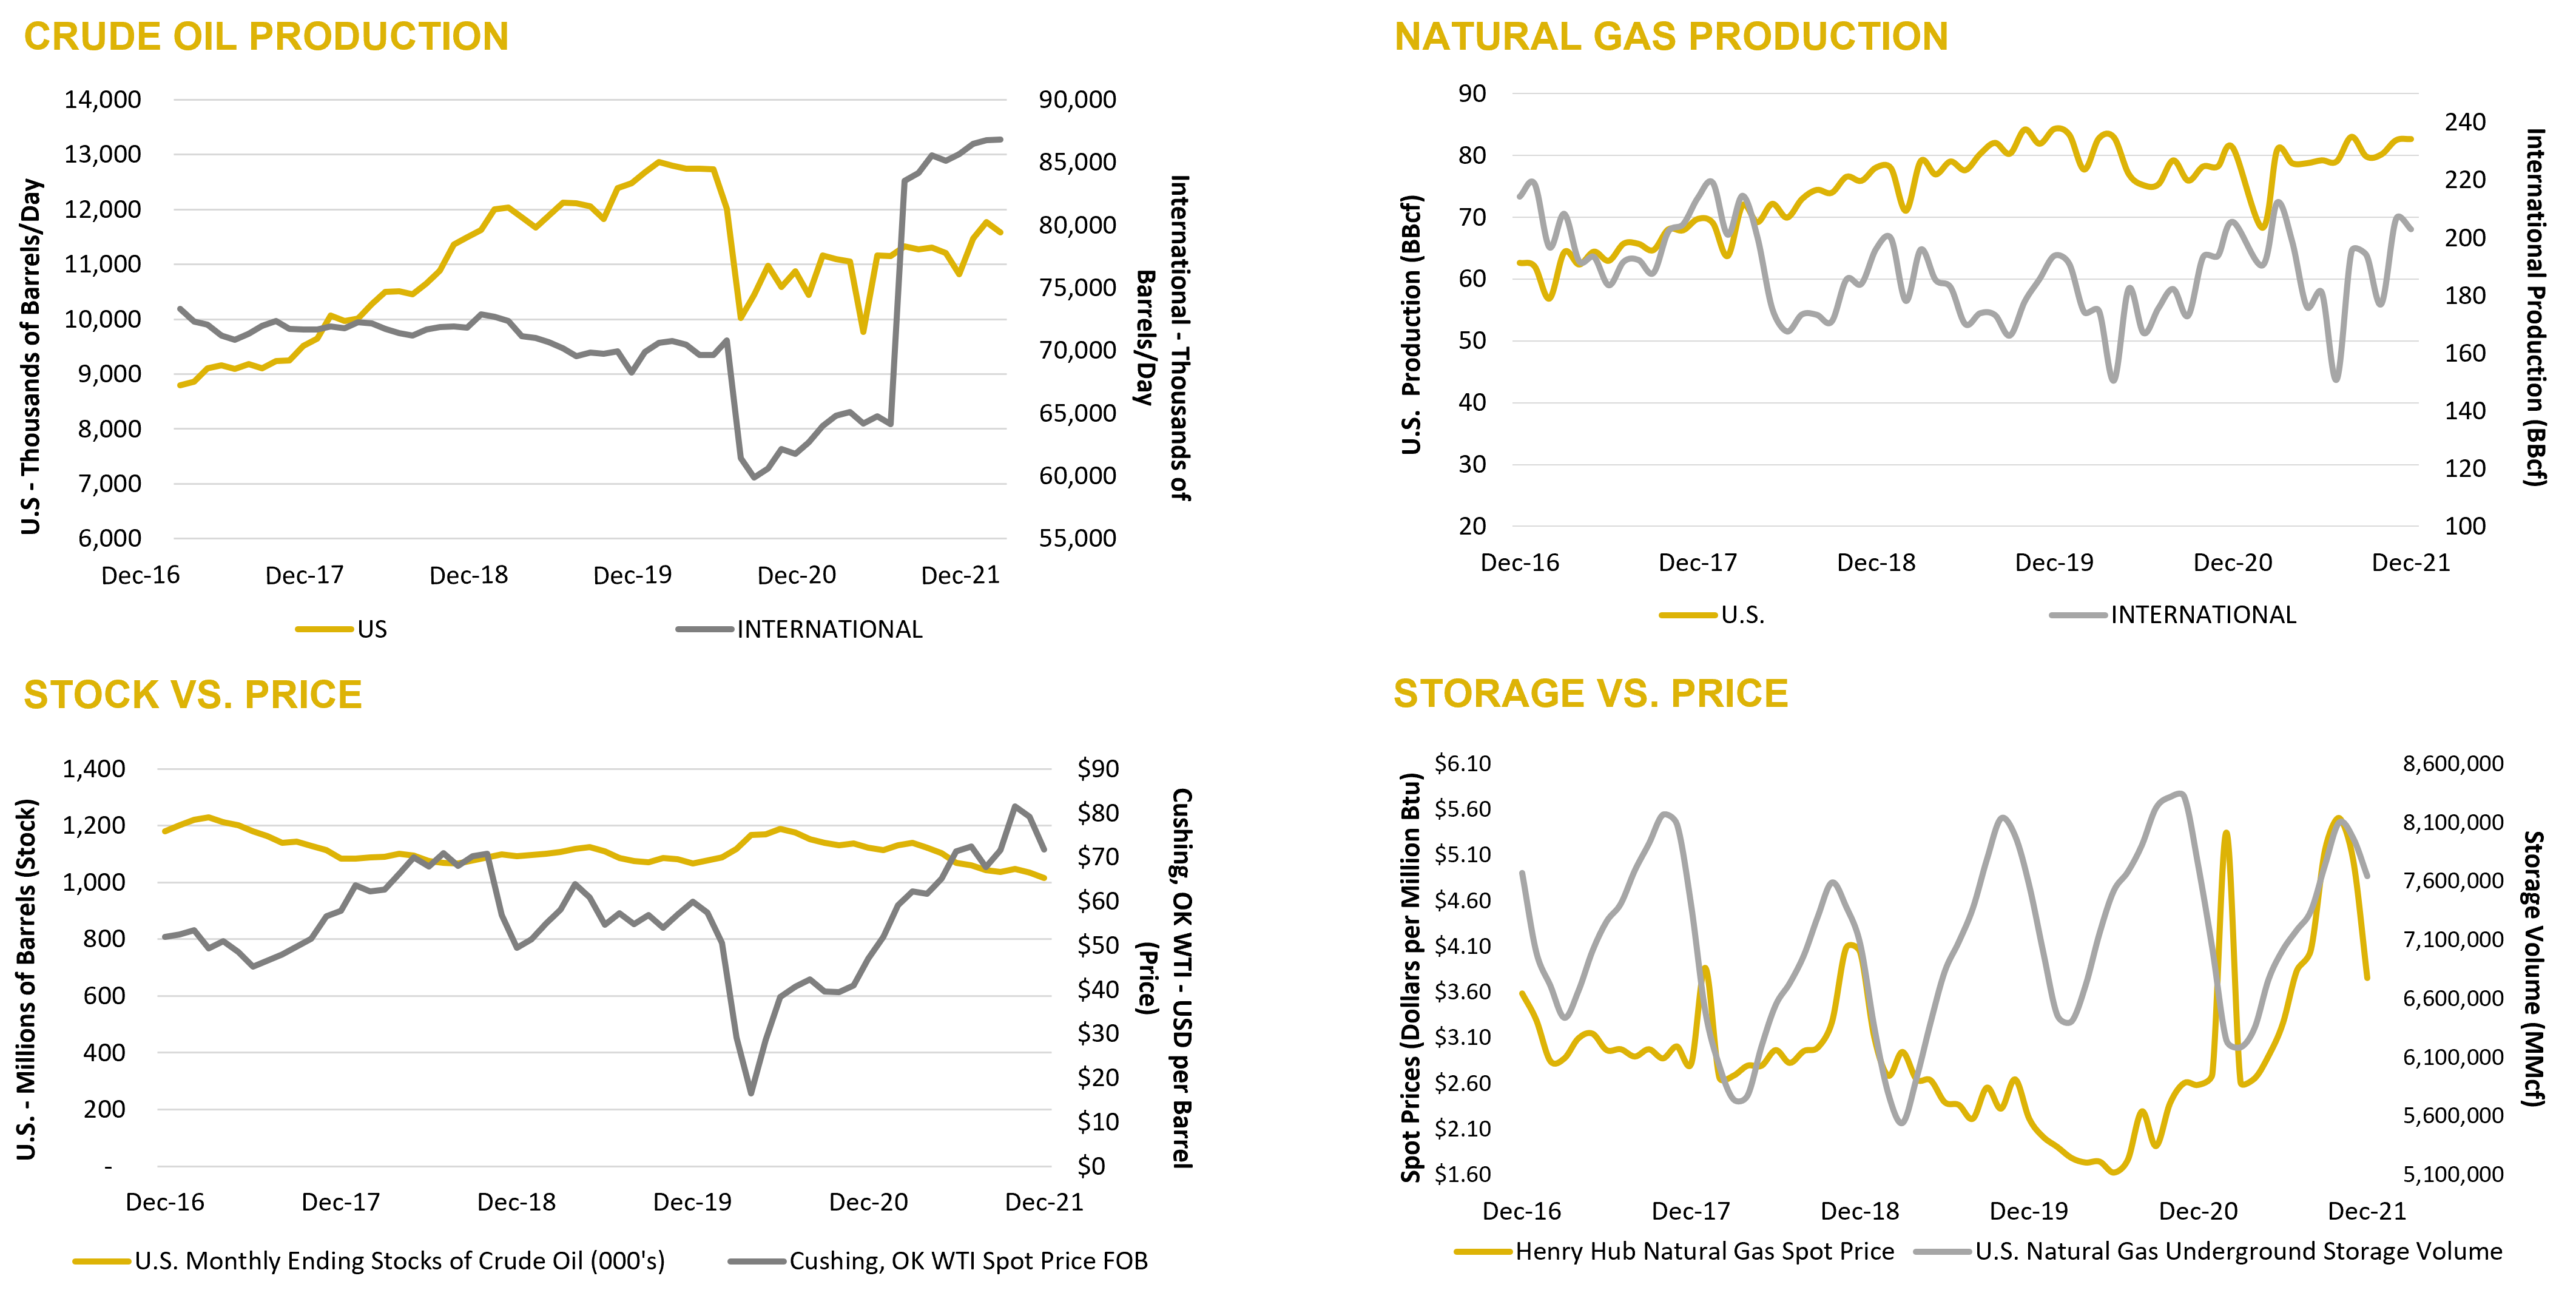
Energy stocks, as measured by the XLE Energy Index, continued their torrid pace rising 41% in the quarter and far outpacing the overall market. The increase reflects higher oil and gas prices during the quarter, much of which can be attributed to the conflict between Russia and Ukraine. That said, investors are growingly accepting the fact that higher prices are not merely related to temporary factors such as Ukraine, supply chain issues, a post-covid economic rebound, or OPEC supply tightening. Instead, there is growing belief that higher prices reflect a fundamental disconnect between the energy demand and supply. Investors no longer talk about domestic supply costs as the factors setting prices instead concentrating on how rising demand will be met until renewable energy is able to have a significant impact on energy demand.

Oil Prices

The run-up in oil prices has been extraordinary virtually doubling in price over the last twelve months. Prices have backed off of highs hit at the beginning of the Ukraine conflict but remain at levels well above that needed for energy companies to make large profits. Brent prices remain approximately $5/bbl. above WTI prices ending the quarter near $108/bbl. Futures prices remain relatively flat declining about a $1 each month going forward. We do not believe $100 oil prices are sustainable and expect increased drilling to eventually lower prices. Nevertheless, we have raised our long-term oil price assumption used in our valuation models to $60 from $50.

Drillers are beginning to react to higher oil prices, but the response has been slow. Active rigs have doubled in the last twelve months but remain below pre-pandemic levels and are only one-third of peak levels in 2015. As the chart below shows, there has been a disconnect between the oil rig count and oil prices in recent years that has become only more exaggerated in recent months with oil prices rising above $100. As indicated previously, we expect drilling activity to continue to increase as long as oil prices remain at current inflated levels. How quickly drilling will increase remains to be seen.

Natural Gas Prices

Natural gas prices have also been exceptionally strong early in the quarter climbing approaching $6/mcf. Much attention has been given to the role domestic gas producers might have in supplying natural gas to Europe to replace gas being received from Russia. The trend towards building liquified natural gas (LNG) export terminals (or reversing import terminals) began years ago. Still, the United States is several years away from increasing its LNG export capacity to a level that could offset Russian imports. That said, the trend will most likely continue creating a favorable outlook for domestic natural gas producers. Interestingly, natural gas prices are higher at the Henry Hub pricing point than most of the country reflecting regional temperature disparities and perhaps a growing trend towards LNG exports.

Storage levels, which entered the winter heating season at high levels, exit the season near historically low levels. Temperatures in the lower 48 states have been colder than normal with the last two weeks in March being significantly colder than normal. As we enter the summer months, there is little to move storage levels back in line. We would expect to enter the next heating season at average to below average storage levels.

Outlook

Energy industry fundamentals remain strong. Energy prices are high and show no sign of decreasing. High oil prices, combined with improved operating efficiencies, mean that production companies are facing very favorable returns on their investment. We look for companies to continue reporting strong positive cash flow and to use cash flow to increase drilling and improve balance sheets. We do not expect companies to raise dividend payments given the cyclical nature of recent oil price trends but would not rule out share repurchases if stock prices do not rebound further. Concerns of industry-wide reductions in lifting costs or a fundamental shift away from carbon-based fuels have gone to the wayside due to a lack of supply response to higher prices. The drilling that is being done is very profitable and that should lead to higher company profits and improved company financials. We believe small energy companies that can expand without drawing attention may be at an advantage.

Source: Michael Heim 01/04/2022; Energy Information Agency (EIA)

Source: Capital IQ as of 03/31/2022

Oil & Gas – Comparable Tables 

Source: Capital IQ as of 03/31/2022

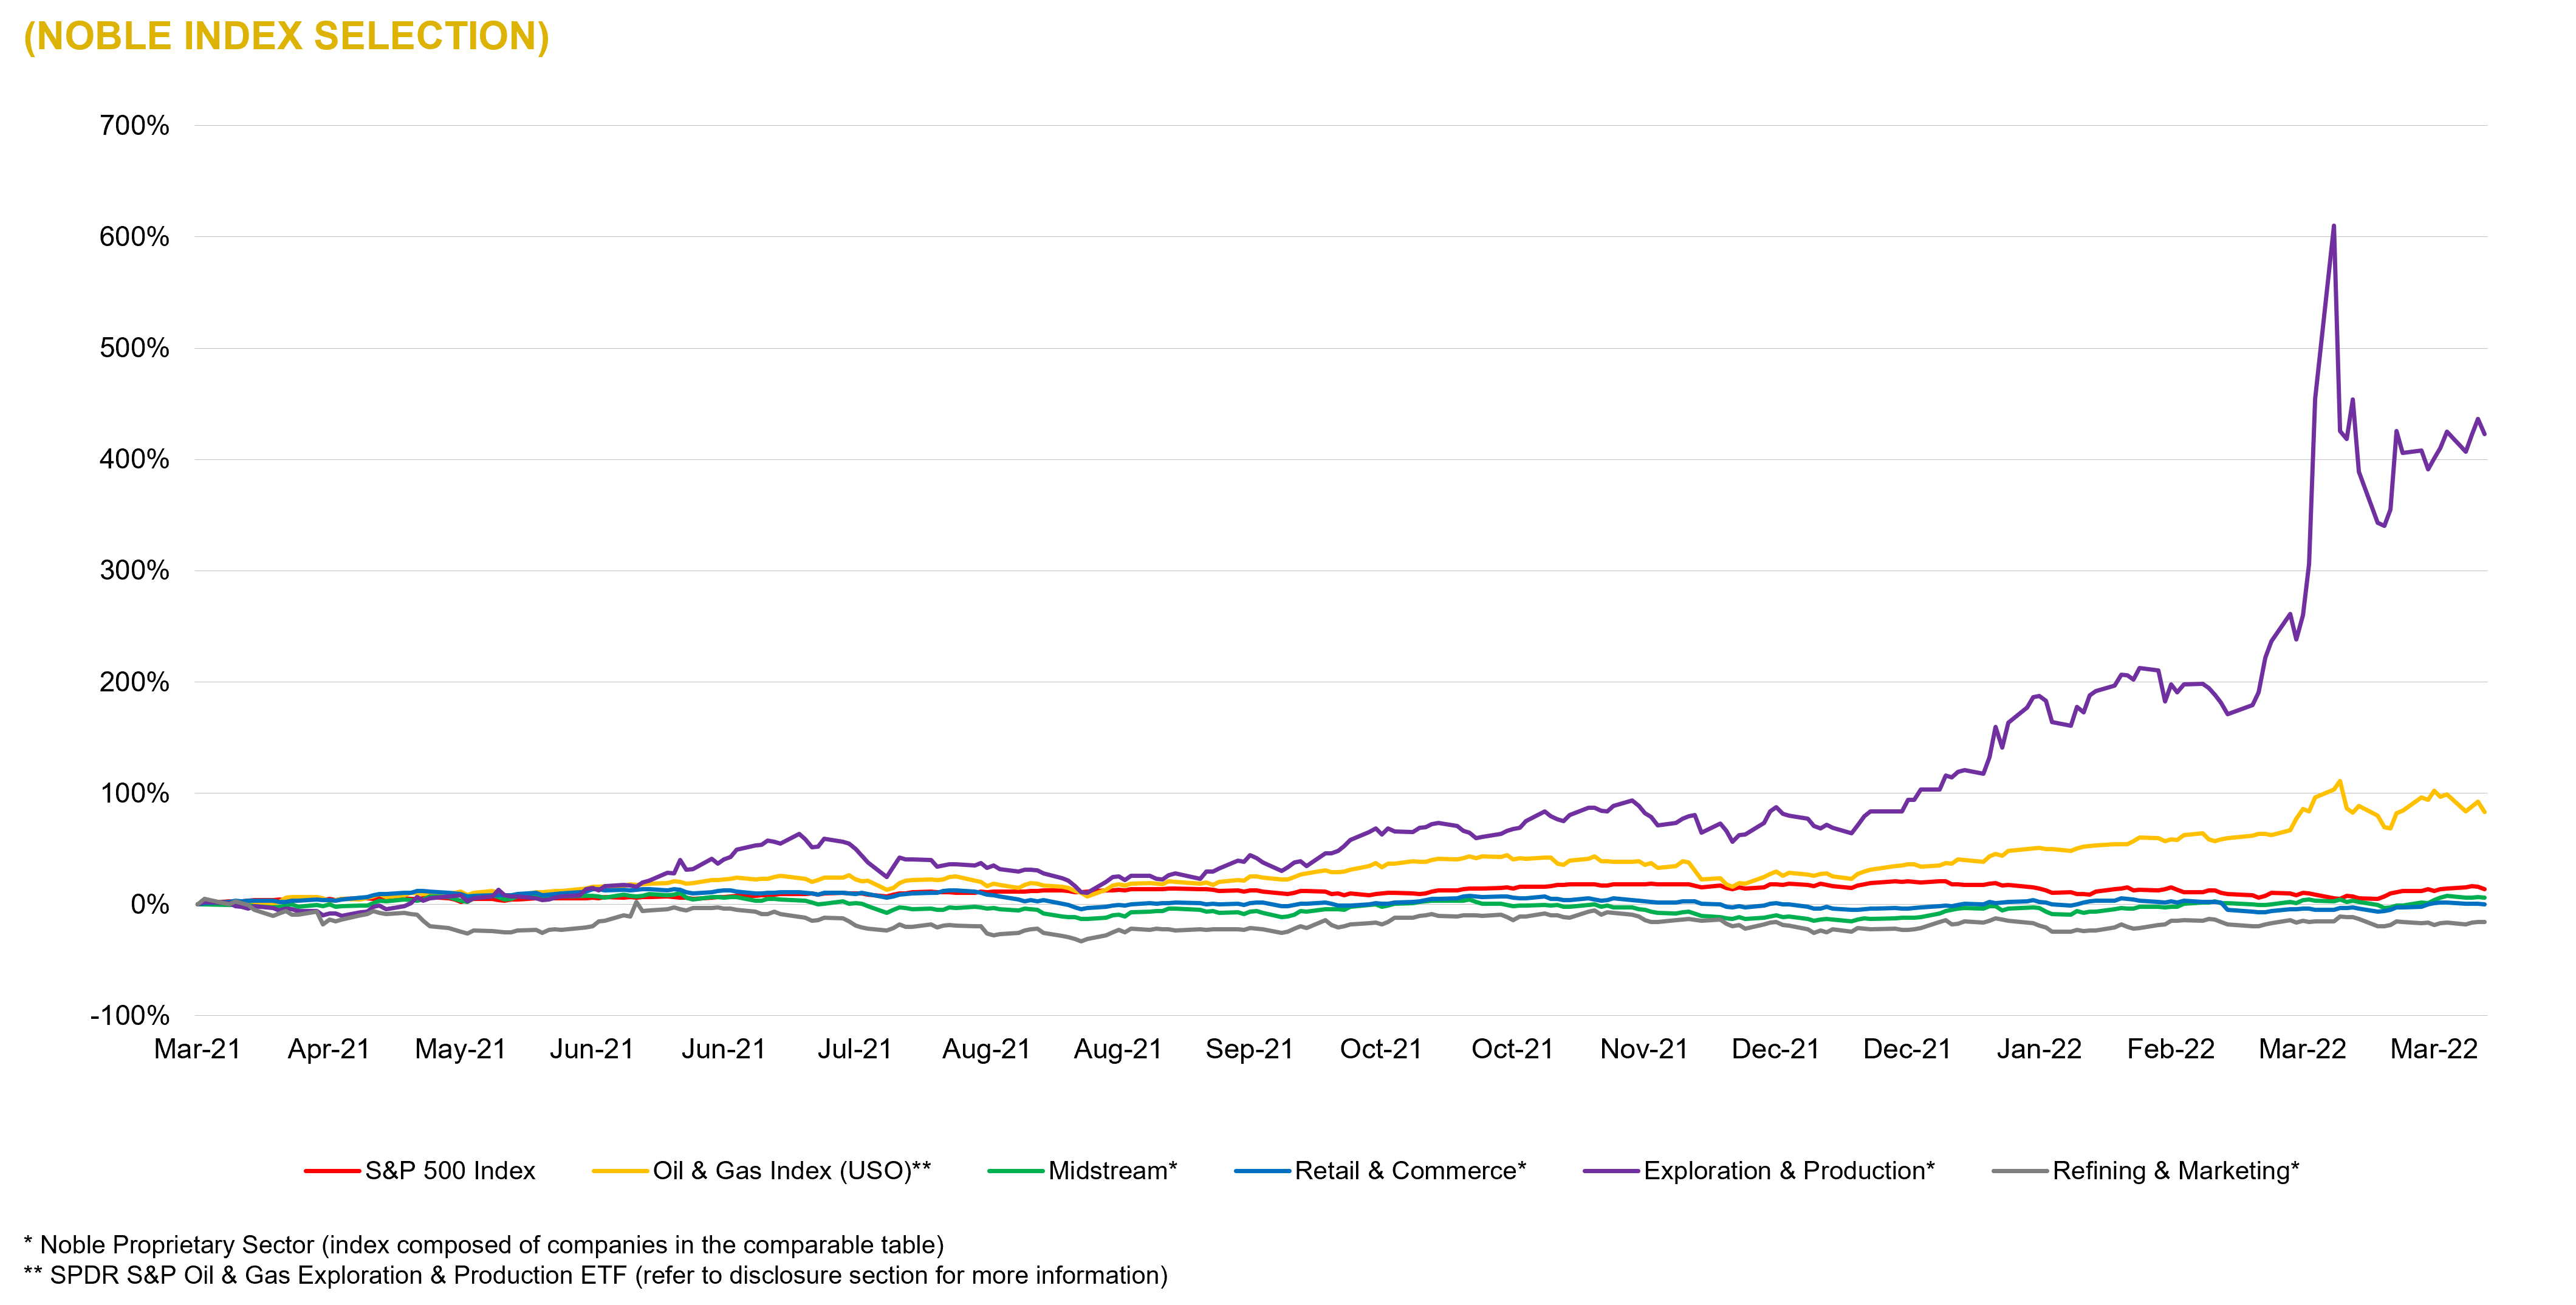
Oil & Gas – LTM Equity Performance 

Source: Capital IQ as of 03/31/2022

Oil & Gas – 2021-4Q Global M&A Activity 

Source: Capital IQ as of 03/31/2022

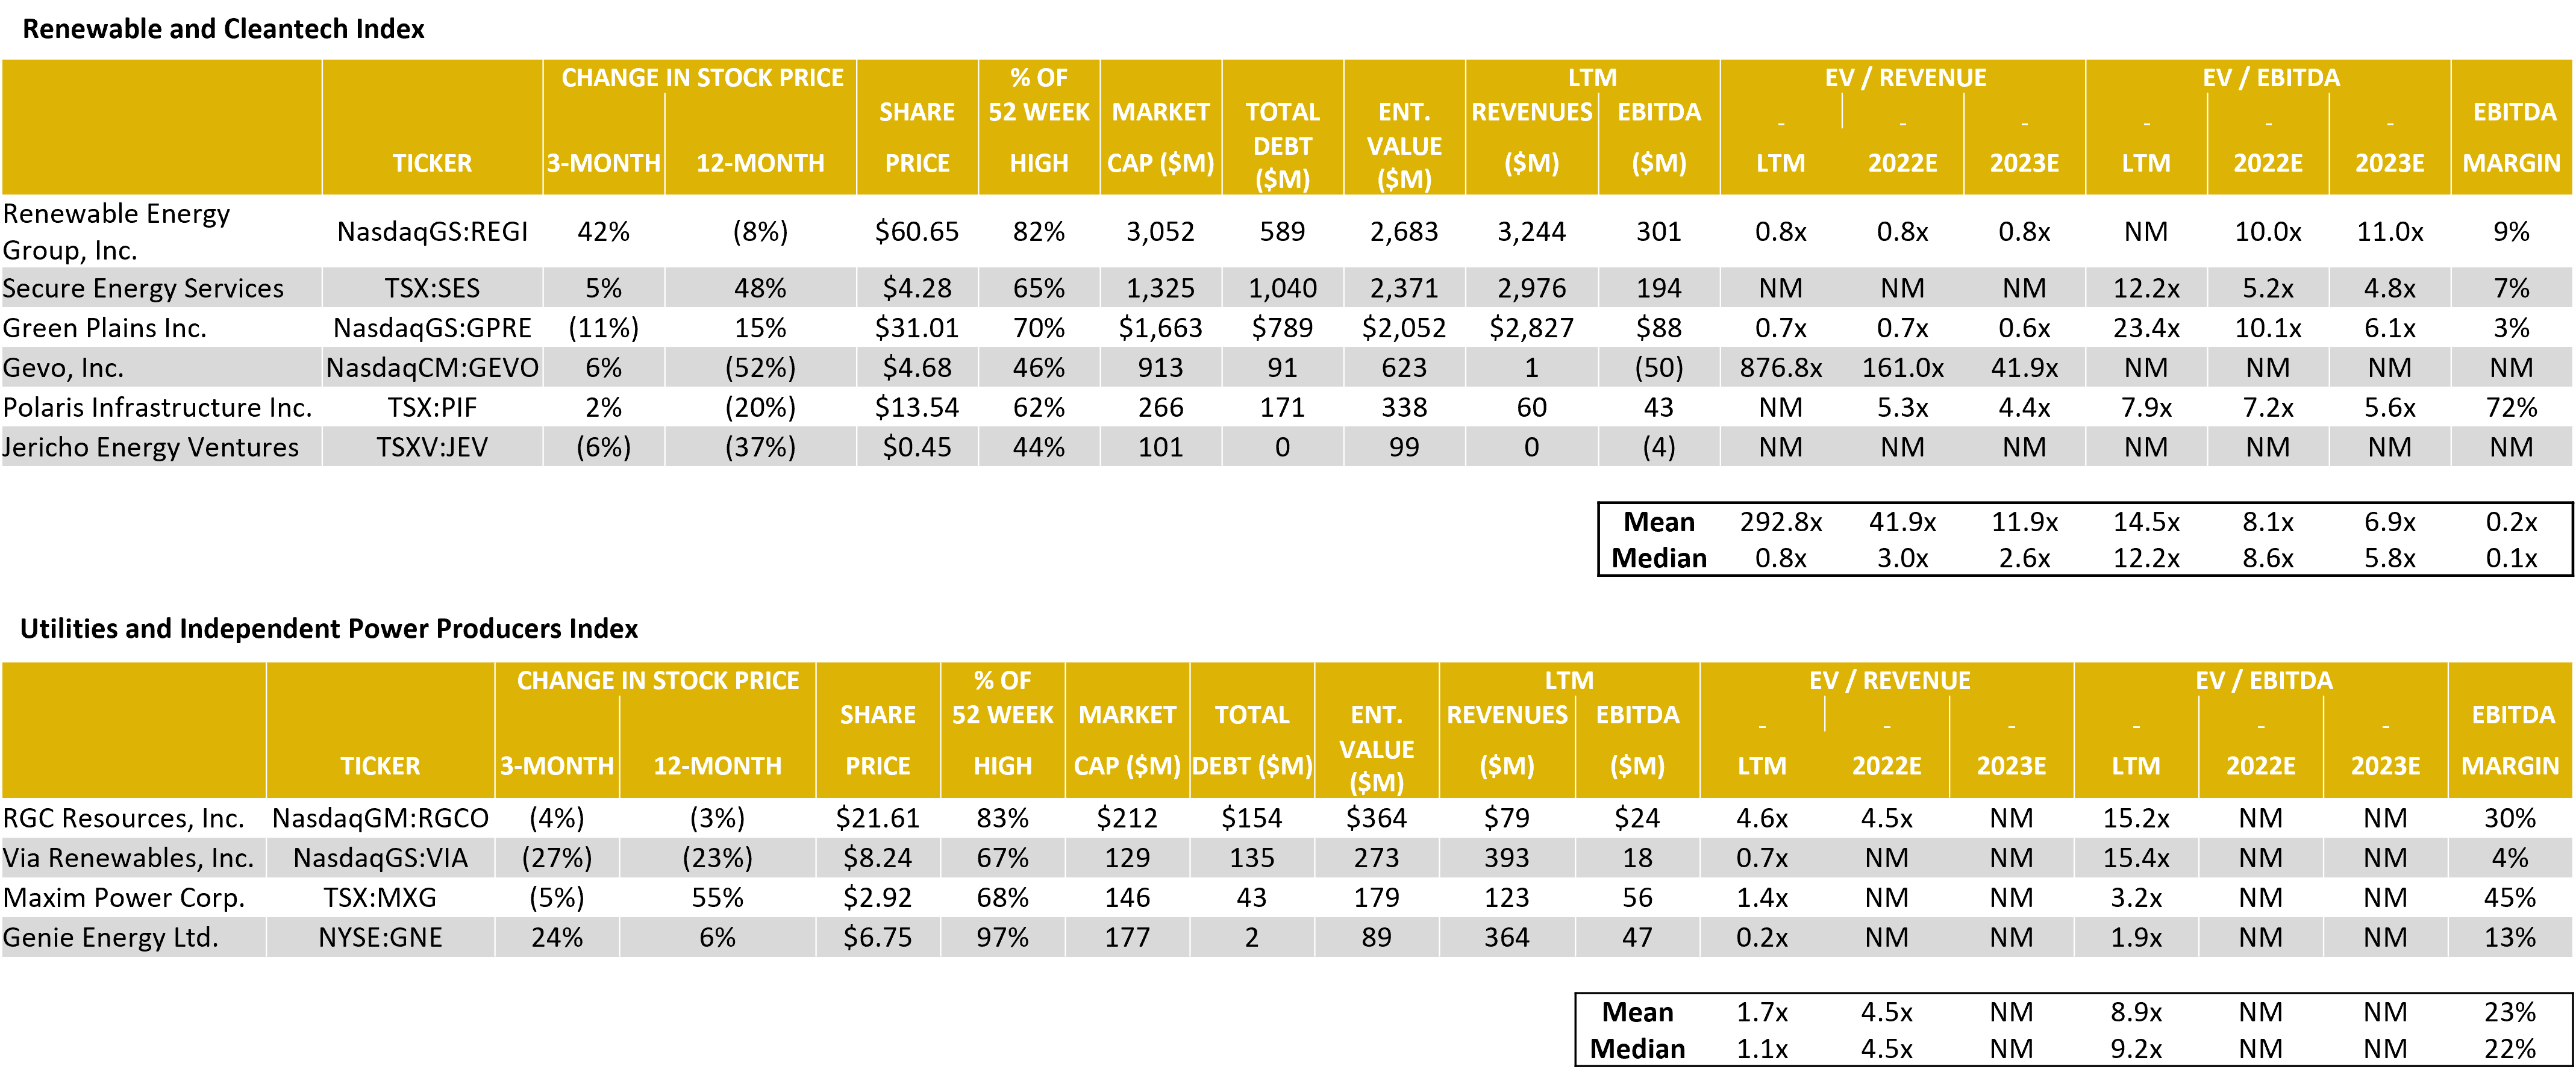
Power Generation – Comparable Tables 

Source: Capital IQ as of 03/31/2022

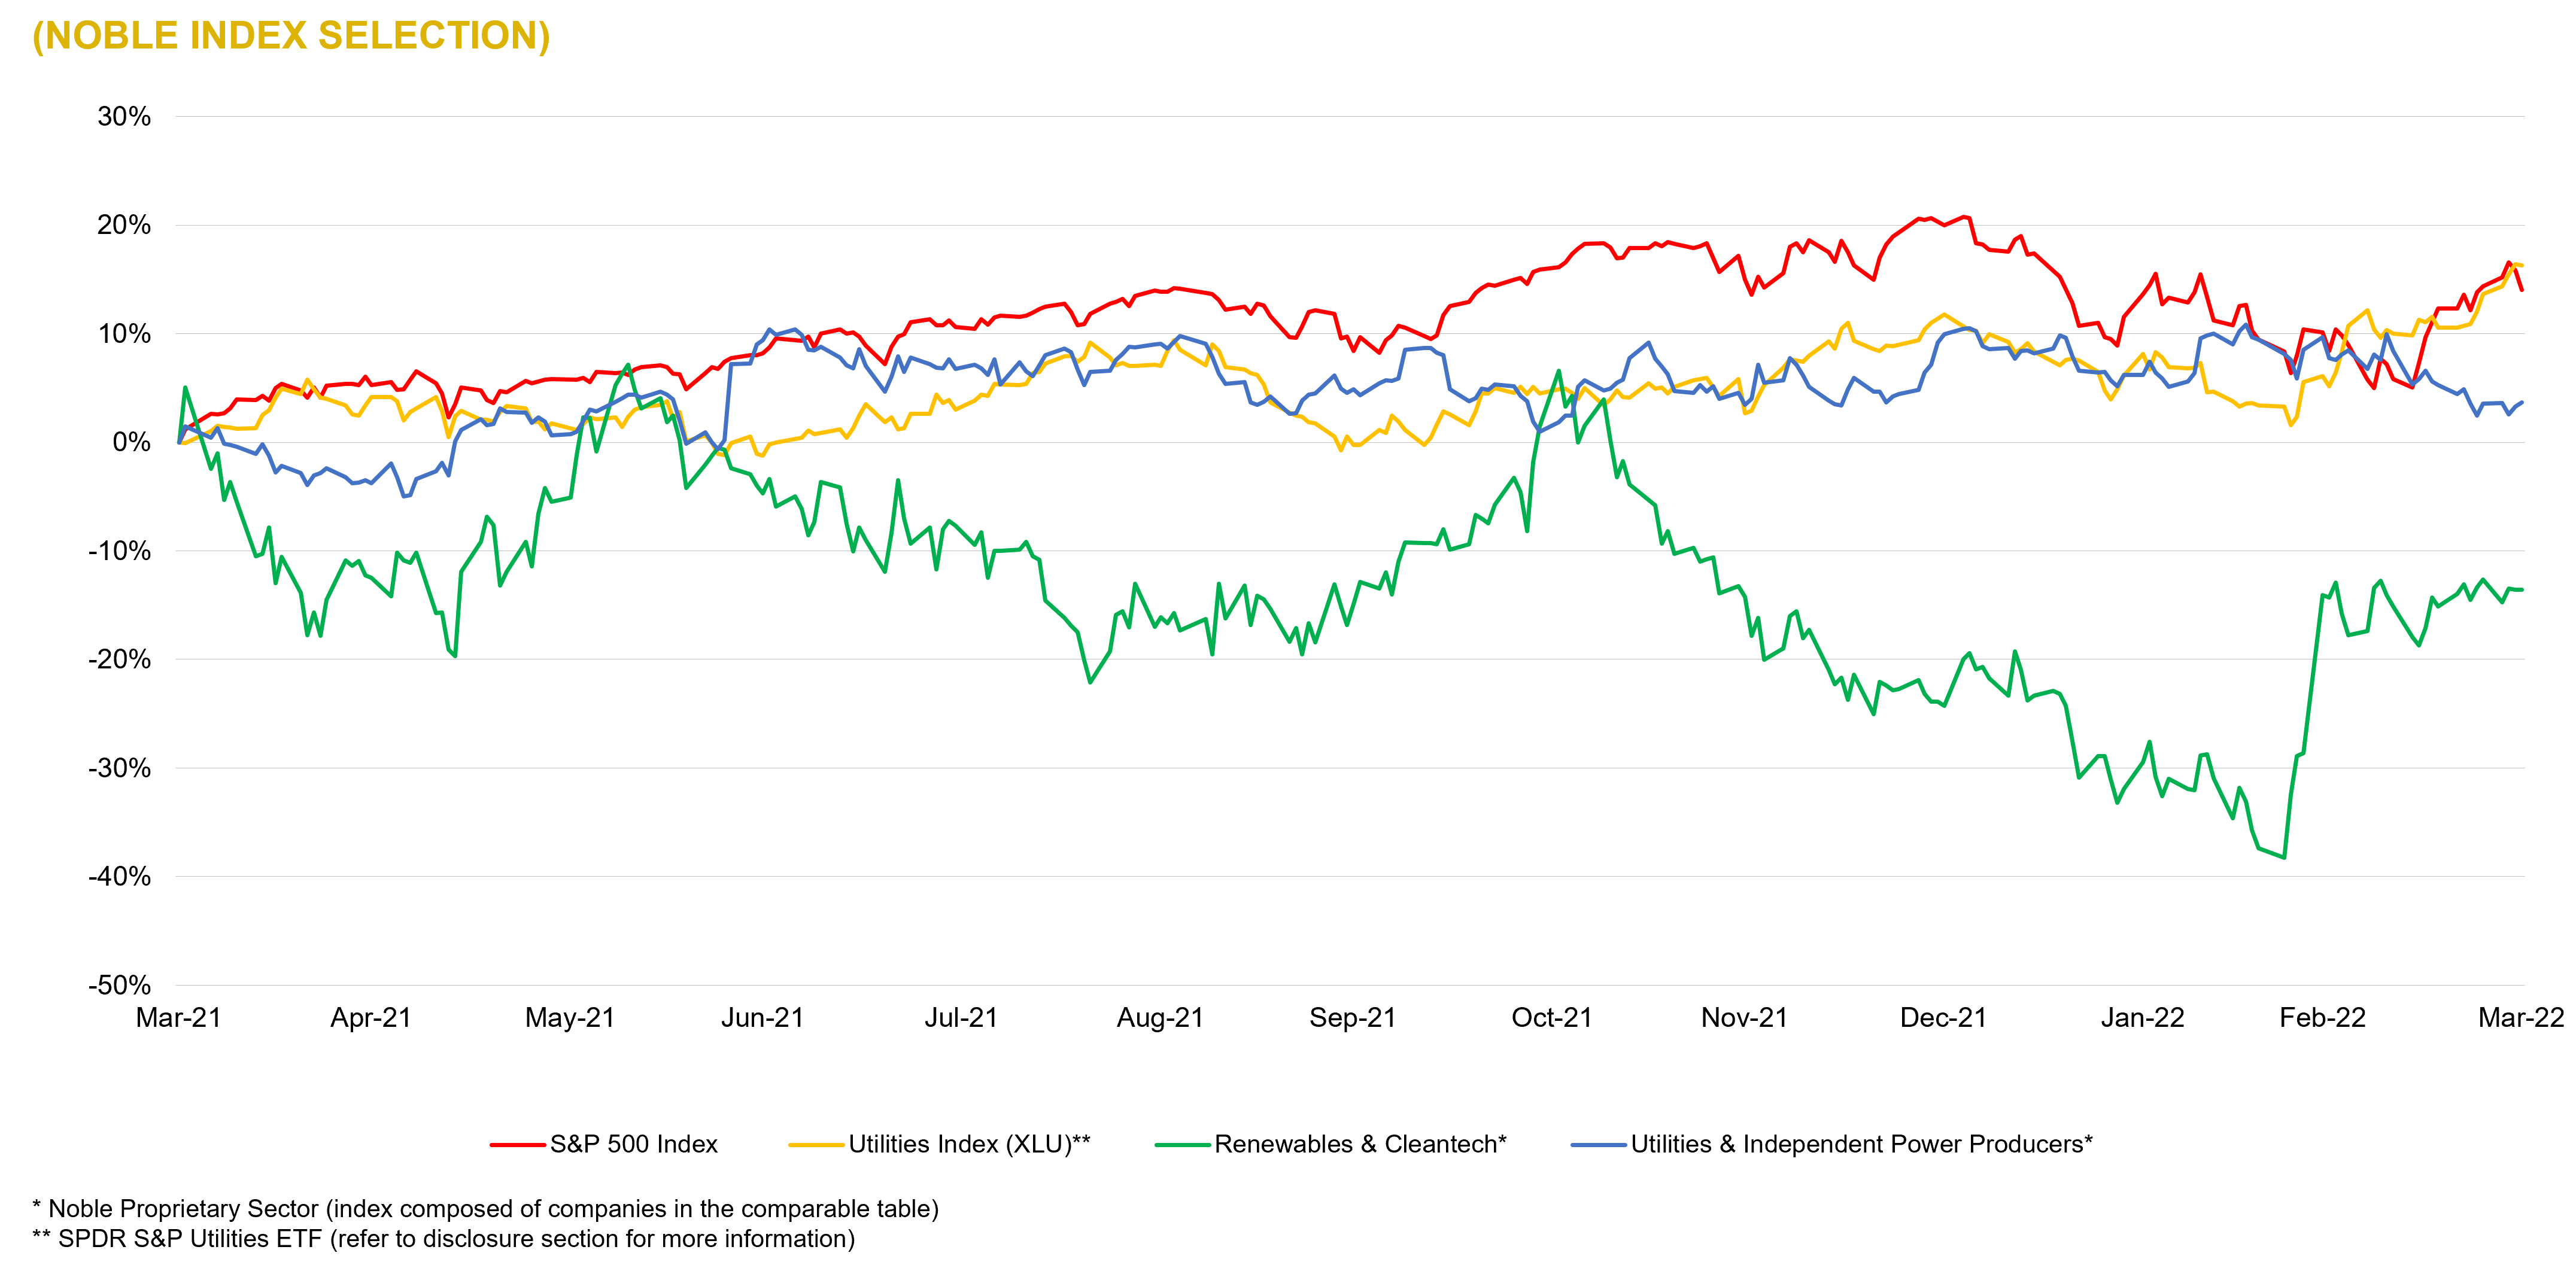
Power Generation – LTM Equity Performance 

Source: Capital IQ as of 03/31/2022

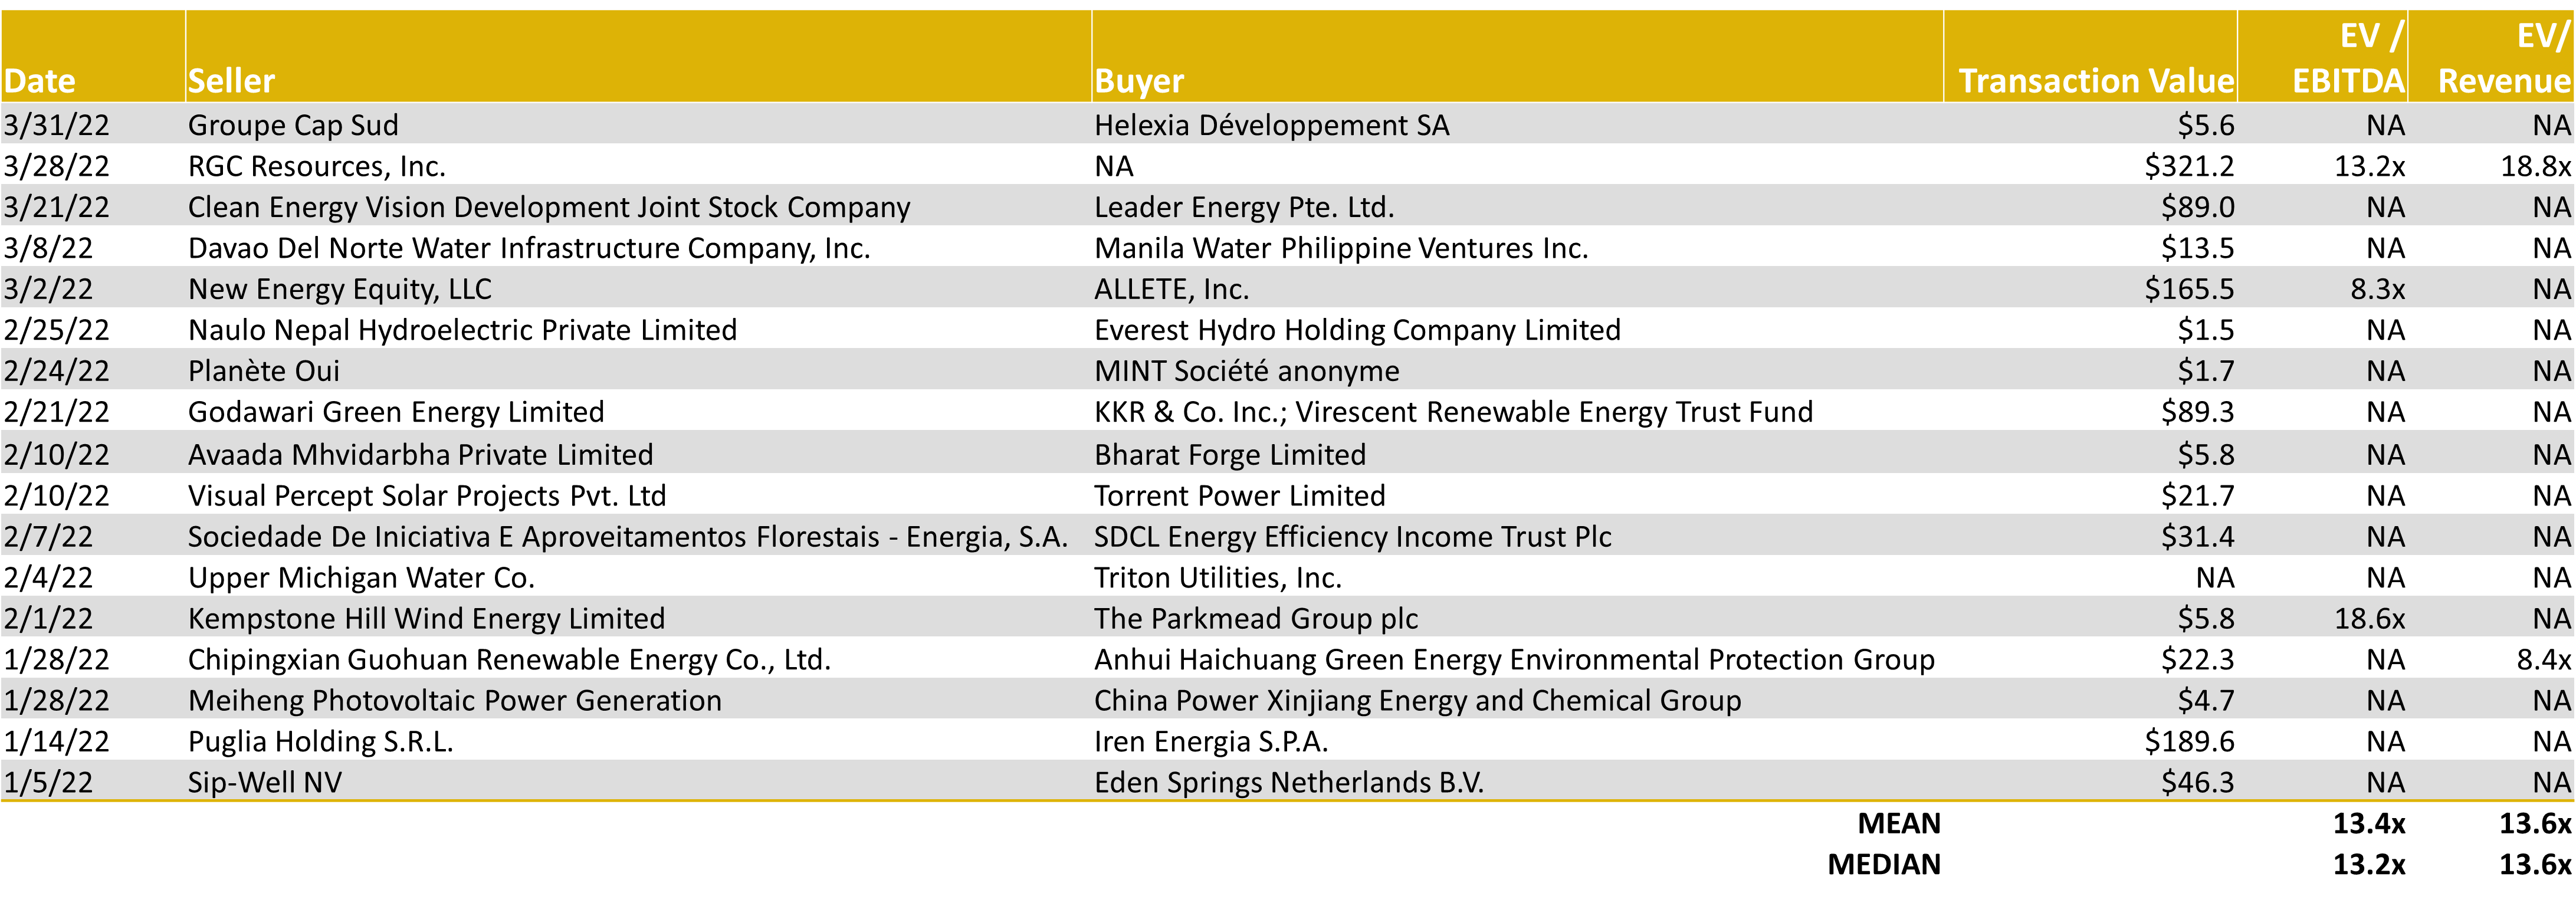
Power Generation – 2021-4Q Global M&A Activity 

Source: Capital IQ as of 03/31/2022

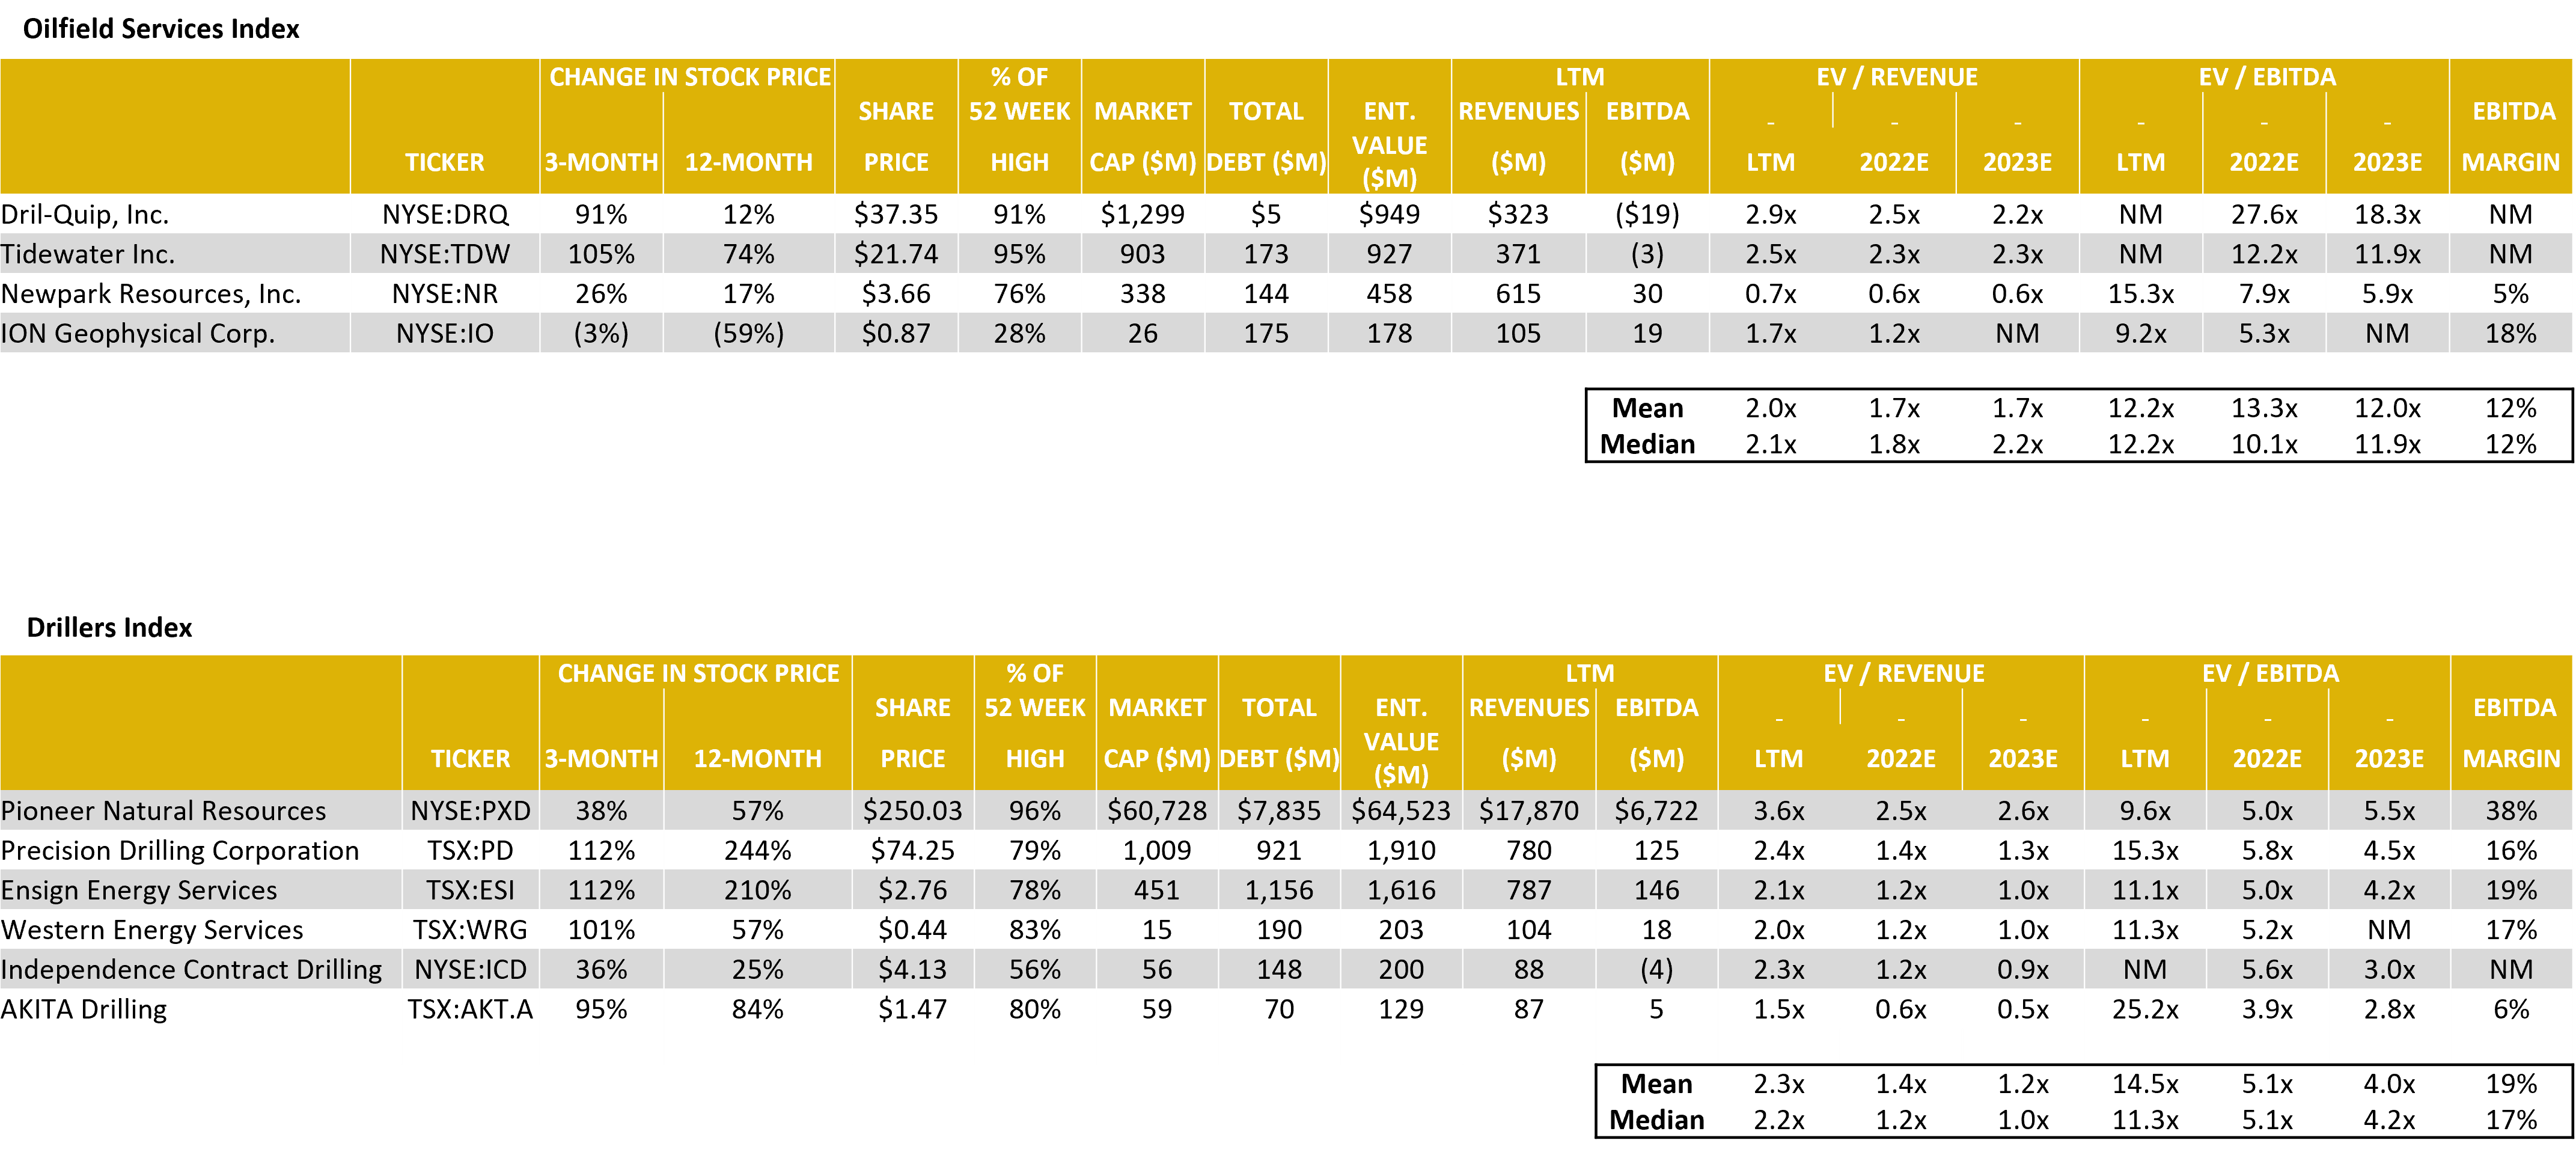
Energy Services – Comparable Tables 

Source: Capital IQ as of 03/31/2022

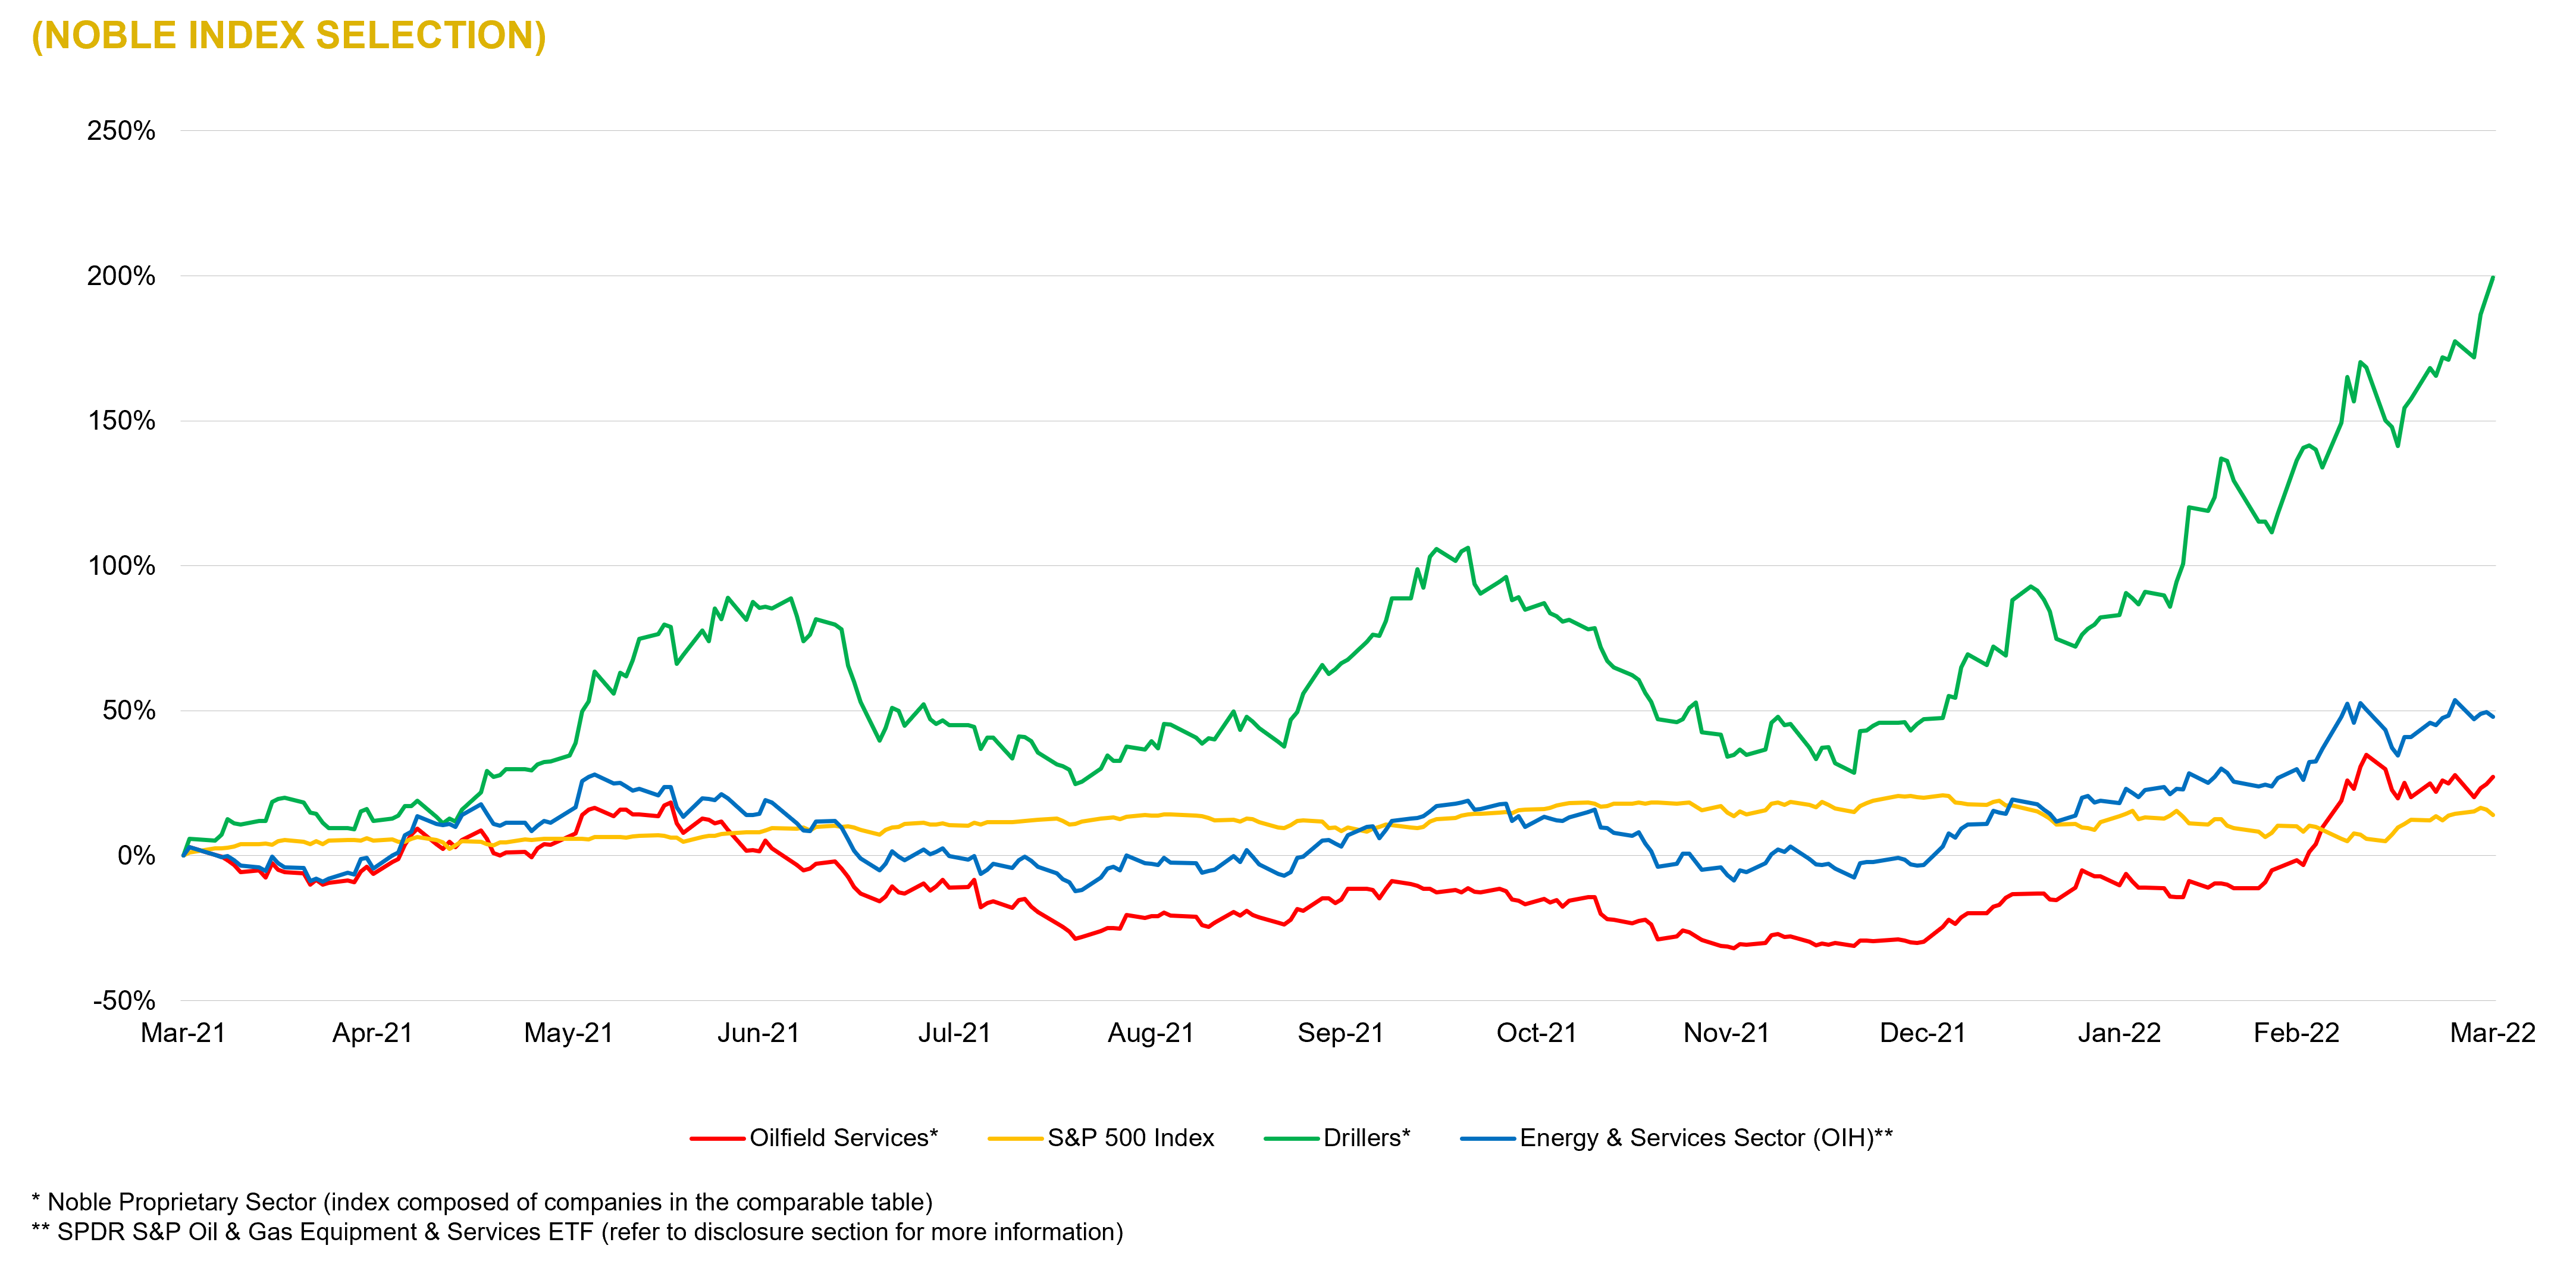
Energy Services – LTM Equity Performance 

Source: Capital IQ as of 03/31/2022

Energy Services – 2021-4Q M&A Activity 

Source: Capital IQ as of 03/31/2022

Mineral Energy – Comparable Tables 

Source: Capital IQ as of 03/31/2022

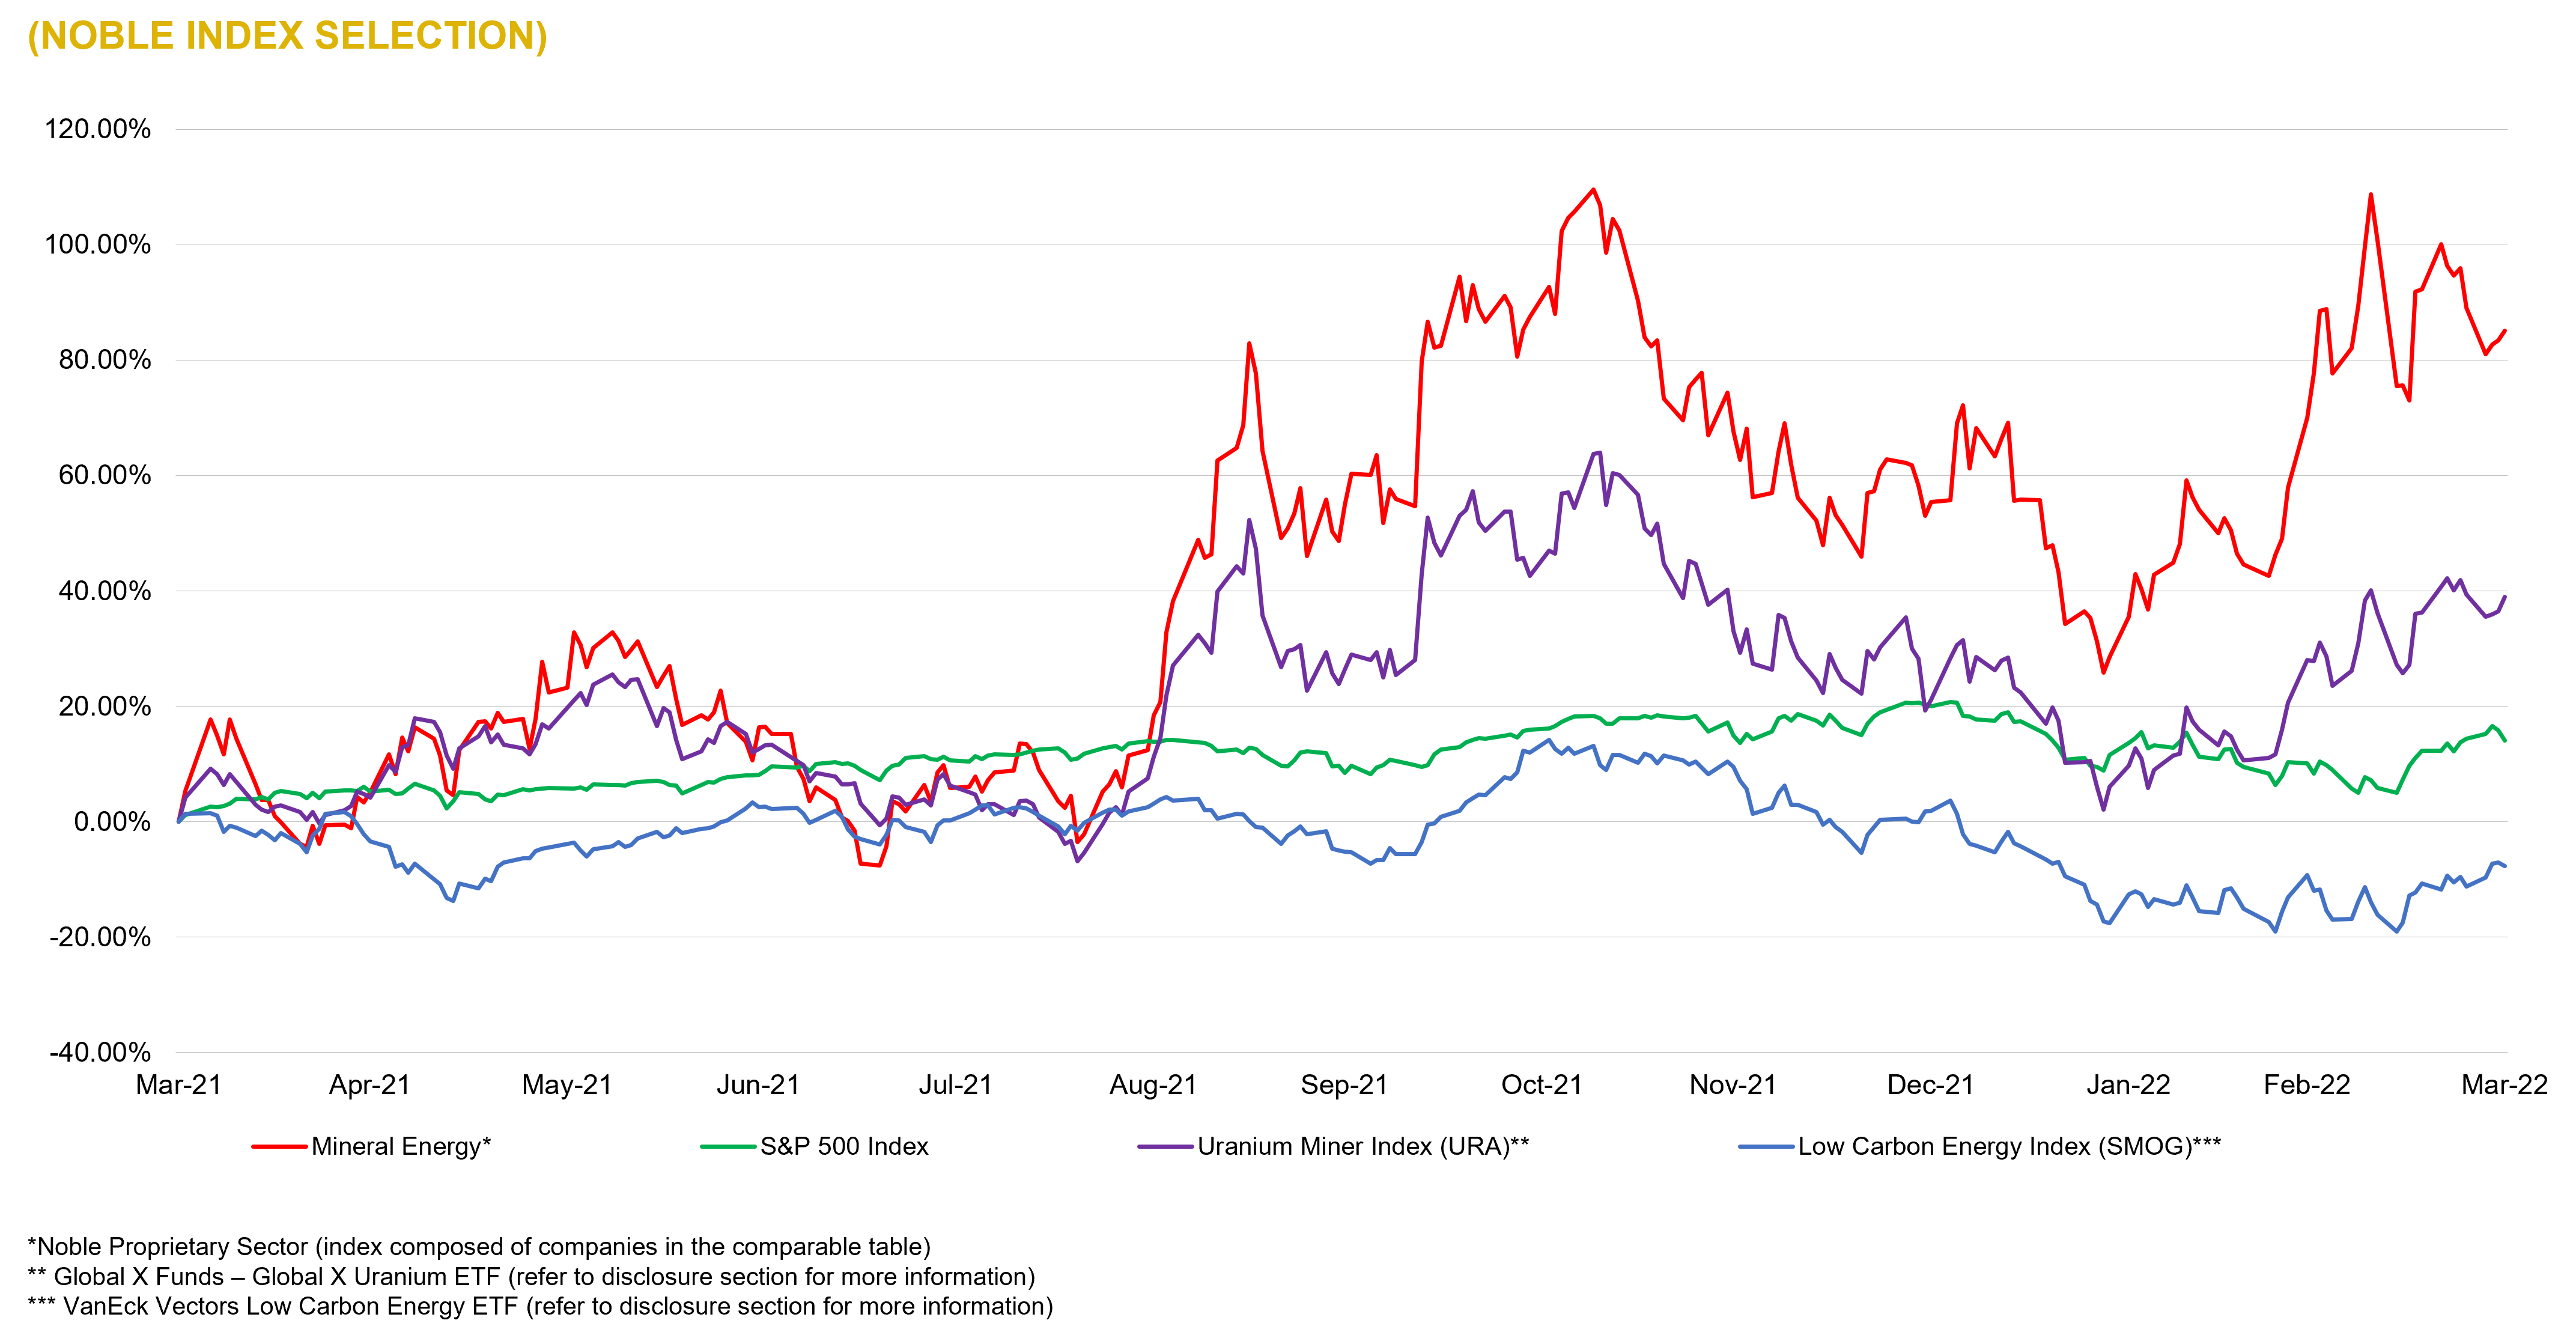
Mineral Energy – LTM Equity Performance 

Source: Capital IQ as of 03/31/2022

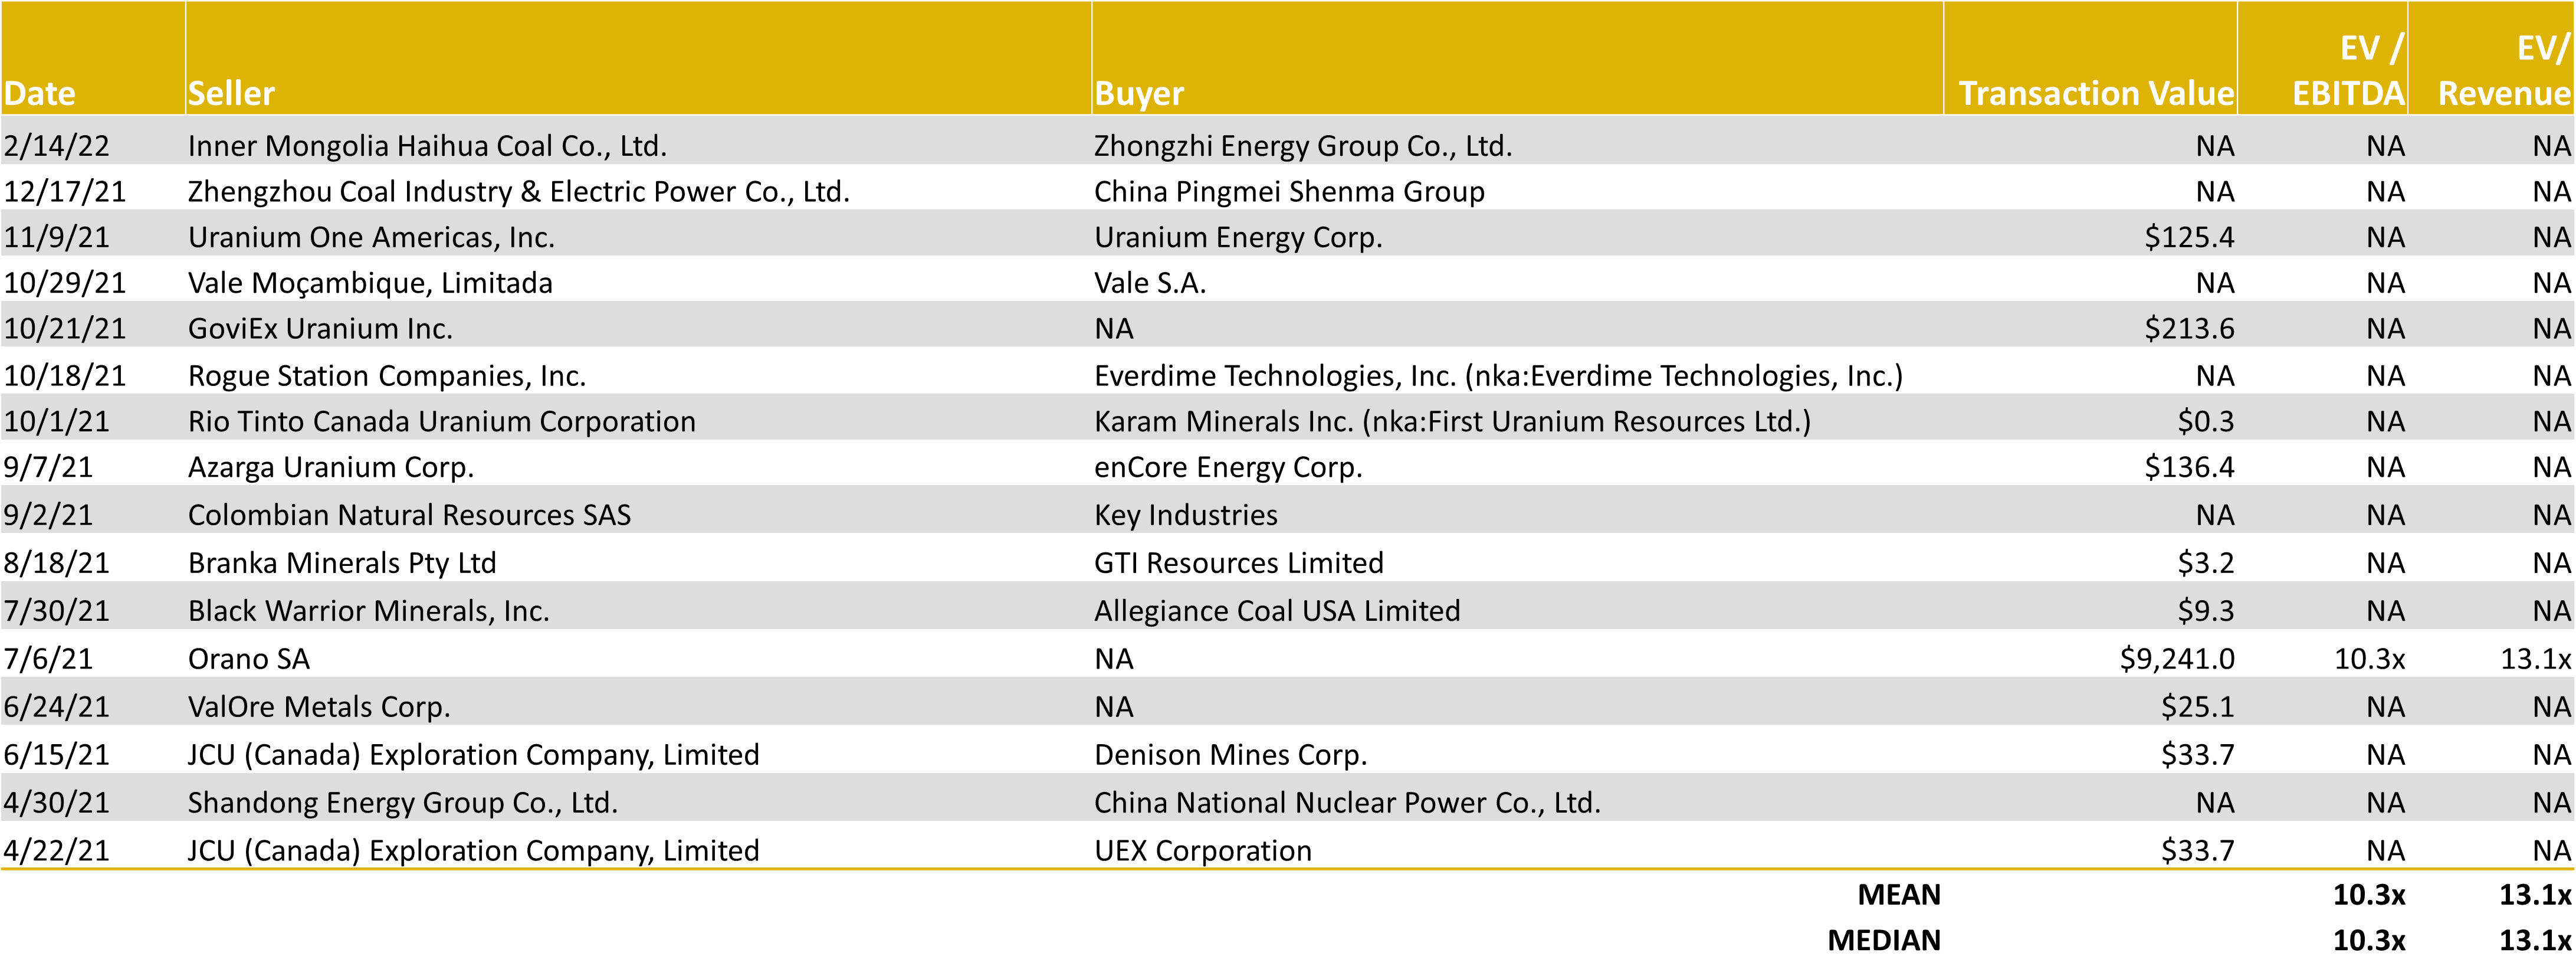
Mineral Energy – 2021 Global M&A Activity 

Source: Capital IQ as of 03/31/2022

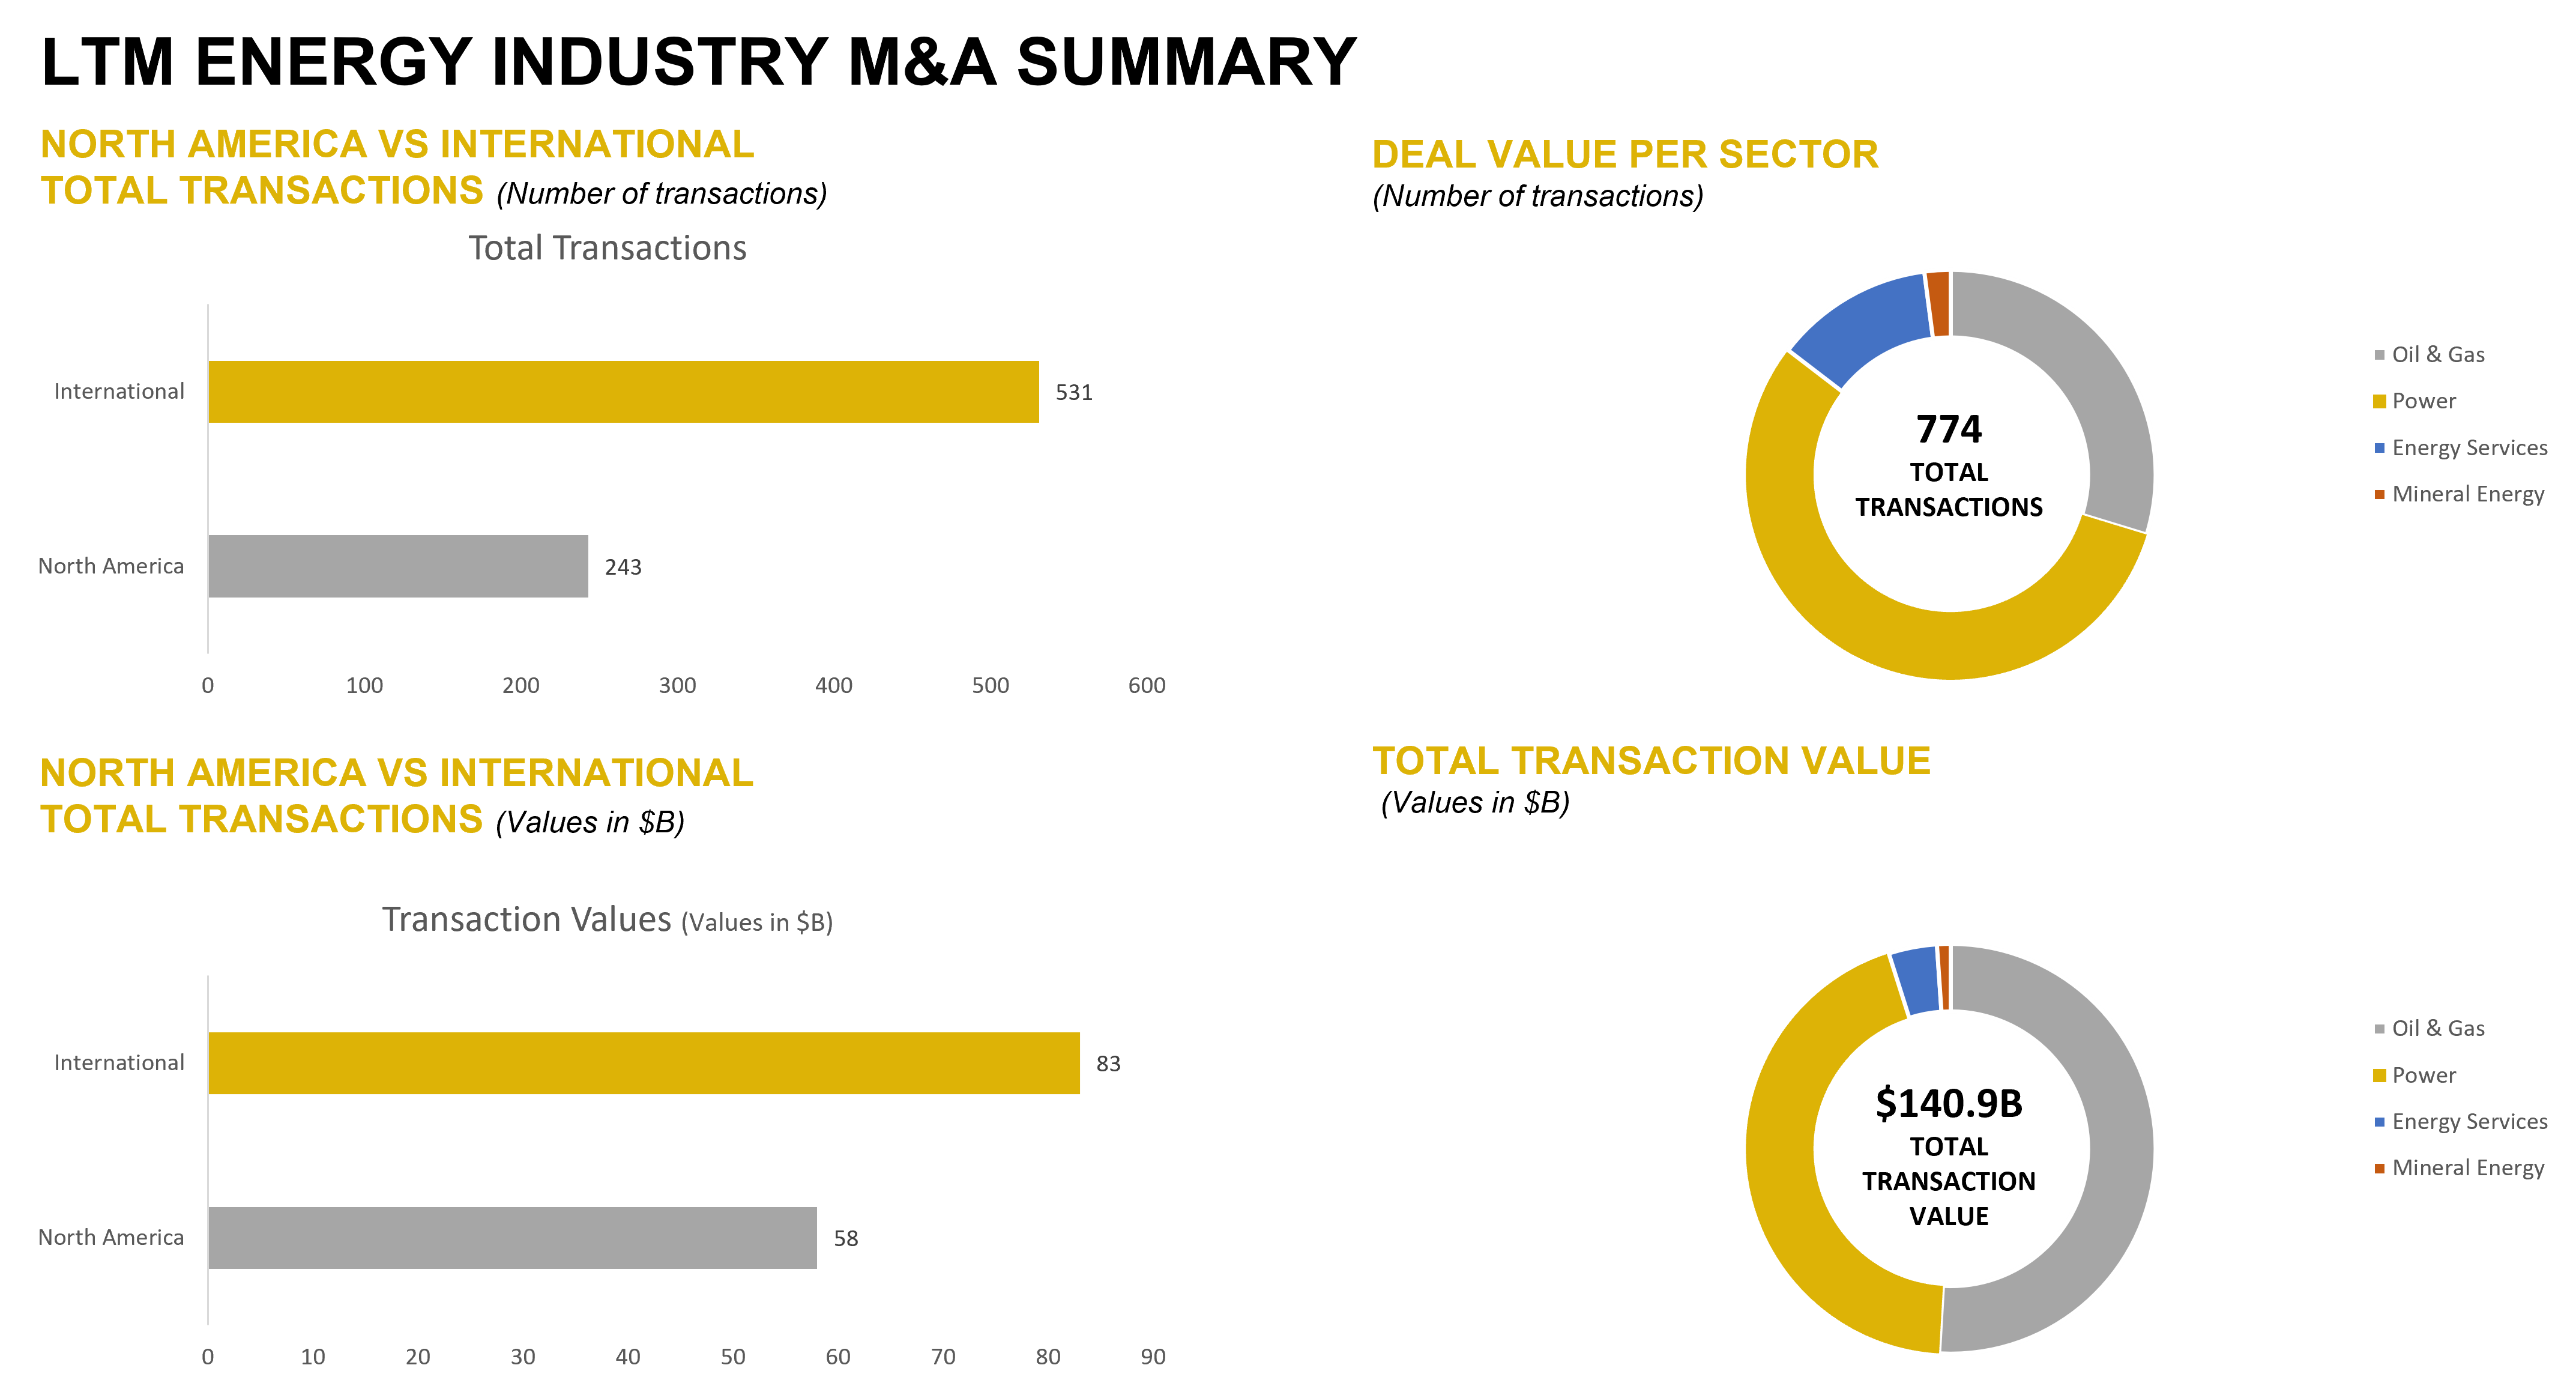
LTM Energy – Energy Industry M&A Summary 

Source: Capital IQ as of 03/31/2022

NOBLE QUARTERLY HIGHLIGHTS

Permex Petroleum Corp. (OTCQB:OILCF)

Industry: Energy – Oil and Gas Exploration and Production

Permex Petroleum is a uniquely positioned junior oil & gas company with assets and operations across the Permian Basin of West Texas and the Delaware Sub-Basin of New Mexico. The company focuses on combining its low-cost development of Held by Production assets for sustainable growth with its current and future Blue-Sky projects for scale growth.

1st Quarter News Highlights:

March 28, 2022: The Company announced the closing of a brokered private placement, which resulted in gross proceeds of approximately USD $7.5 million before deducting the placement agent’s fees and other estimated fees and expenses related to the Offering. Each Unit consists of one common share and one common share purchase warrant. Each Warrant will be exercisable into one Share for a period of five years at an exercise price of USD $0.21 per share.

Peninsula Energy Ltd. (OTCQB:PENMF)

Industry:Mineral Energy; Exploration and production

Peninsula Energy Limited (PEN) is an ASX listed uranium mining company which commenced in-situ recovery operations in 2015 at its 100% owned Lance Projects in Wyoming, USA. Peninsula is embarking on a project transformation initiative at the Lance Projects to change from an alkaline ISR operation to a low-pH ISR operation with the aim of aligning the operating performance and cost profile of the project with industry leading global uranium production projects.

1st Quarter News Highlights:

March 28, 2022: Peninsula Energy announced the initiation of an update to the 2018 Low-pH Feasibility Study on its flagship, 100% owned Lance Project (“Lance”) located in Wyoming, USA. The Company is also pleased to announce the selection of Western Water Consultants, Inc. d/b/a WWC Engineering, a leading US-based consulting and engineering firm with significant Uranium In-Situ Recovery (“ISR”) expertise, to author the Study.

Alvopetro Energy Ltd. (OTCQX:ALVOF)

Industry: Energy – Oil & Gas; Exploration and production

Alvopetro Energy Ltd.’s vision is to become a leading independent upstream and midstream operator in Brazil. The company’s strategy is to unlock the on-shore natural gas potential in the state of Bahia in Brazil, building off the development of their Caburé and Gomo natural gas projects and the construction of strategic infrastructure assets.

1st Quarter News Highlights:

March 17, 2022: The company announced a 33% increase in quarterly dividend to US$0.08/share, payable in cash on April 14, 2022, to shareholders of record at the close of business on March 31, 2022. This dividend is designated as an “eligible dividend” for Canadian income tax purposes. Alvopetro’s cash flows are linked to US dollars and as such, dividends are being paid in US dollars.

Source: Company Press Releases

DOWNLOAD THE FULL REPORT (PDF)

Noble Capital Markets Energy Newsletter Q1 2022

This newsletter was prepared and provided by Noble Capital Markets, Inc. For any questions and/or requests regarding this newsletter, please contact >Francisco Penafiel

DISCLAIMER

All statements or opinions contained herein that include the words “ we”,“ or “ are solely the responsibility of NOBLE Capital Markets, Inc and do not necessarily reflect statements or opinions expressed by any person or party affiliated with companies mentioned in this report Any opinions expressed herein are subject to change without notice All information provided herein is based on public and non public information believed to be accurate and reliable, but is not necessarily complete and cannot be guaranteed No judgment is hereby expressed or should be implied as to the suitability of any security described herein for any specific investor or any specific investment portfolio The decision to undertake any investment regarding the security mentioned herein should be made by each reader of this publication based on their own appraisal of the implications and risks of such decision This publication is intended for information purposes only and shall not constitute an offer to buy/ sell or the solicitation of an offer to buy/sell any security mentioned in this report, nor shall there be any sale of the security herein in any state or domicile in which said offer, solicitation or sale would be unlawful prior to registration or qualification under the securities laws of any such state or domicile This publication and all information, comments, statements or opinions contained or expressed herein are applicable only as of the date of this publication and subject to change without prior notice Past performance is not indicative of future results.

Please refer to the above PDF for a complete list of disclaimers pertaining to this newsletter

Harte Hanks (HHS) – The Art Of A Turnaround

Wednesday, April 27, 2022

Harte Hanks (HHS)
The Art Of A Turnaround

Harte-Hanks is a marketing services company that provides multichannel marketing solutions as well as consulting, data analytics, and strategic assessment. The company’s offerings focus on business-to-business, retail, finance, and automotive segments through digital, social, mobile, and print media offerings. Harte-Hanks strives to develop better customer relationships through its marketing and analytical services for clients. The majority of its revenue is derived from its marketing services in the retail, technology, and consumer brand segments.

Michael Kupinski, Director of Research, Noble Capital Markets, Inc.

Patrick McCann, Research Associate, Noble Capital Markets, Inc.

Refer to the full report for the price target, fundamental analysis, and rating.

    NobleCon18 highlights. Brian Linscott, CEO, and Lauri Kearnes, CFO, presented at NobleCon18 highlighting that the company has successfully pivoted from surviving to thriving. To watch a full replay of the presentation, please click here.

    Customer Care keeps rolling.  The Customer Care segment represented 38% of total revenues in 2021, growing 27.3% on a YoY basis. As a result of technology investments and an asset-lite strategy, the company has been able to decrease fixed costs and reduce its footprint in the division. Management is optimistic about expansion opportunities. The business could have the capacity to generate $1 million …


This Company Sponsored Research is provided by Noble Capital Markets, Inc., a FINRA and S.E.C. registered broker-dealer (B/D).

*Analyst certification and important disclosures included in the full report. NOTE: investment decisions should not be based upon the content of this research summary. Proper due diligence is required before making any investment decision. 


QuoteMedia Inc. (QMCI) – Meeting Expectations Just Got Easier

Wednesday, April 27, 2022

QuoteMedia Inc. (QMCI)
Meeting Expectations Just Got Easier

QuoteMedia, based in Fountain Hills, Arizona, provides cloud-based financial data, market news feeds, and financial software solutions.  Its customers include financial service companies, online brokerages, clearing firms, banks, media portals, public corporations and individual investors.  The company provides a single source solution providing products such as streaming quotes, charting, historical data, technical analysis, news and research.  Information can customized and provided to multiple platforms including terminals and mobile devices.

Michael Kupinski, Director of Research, Noble Capital Markets, Inc.

Refer to the full report for the price target, fundamental analysis, and rating.

    Scores a big fish it hoped for. QuoteMedia was selected as market data and technology provider for one of Canada’s top financial banks. This was a contract that the company indicated it was about to sign in its last investor call. We had already factored in this new account into our 2022 and 2023 estimates.

    Large new account.  We estimate that the new account will become the company’s largest account, exceeding that of the Toronto Exchange estimated to account for annual revenues of roughly $1.7 million. The revenue contribution from the new account is estimated to allow the company to achieve 22% revenue growth for full year 2022 and 2023 due to expanded service offerings in that year …


This Company Sponsored Research is provided by Noble Capital Markets, Inc., a FINRA and S.E.C. registered broker-dealer (B/D).

*Analyst certification and important disclosures included in the full report. NOTE: investment decisions should not be based upon the content of this research summary. Proper due diligence is required before making any investment decision. 


Release – Alliance Resource Partners L.P. Increases Quarterly Cash Distribution


Alliance Resource Partners, L.P. Increases Quarterly Cash Distribution 40% to $0.35 Per Unit; Provides Preliminary View of Results for the Quarter Ended March 31, 2022; and Increases Guidance

Research, News, and Market Data on Alliance Resource Partners


TULSA, Okla.–(BUSINESS WIRE)– Alliance Resource Partners, L.P. (NASDAQ: ARLP) today announced that the Board of Directors of ARLP’s general partner approved an increased cash distribution to its unitholders for the quarter ended March 31, 2022 (the “2022 Quarter”).

ARLP unitholders will receive a cash distribution for the 2022 Quarter of $0.35 per unit (an annualized rate of $1.40 per unit), payable on May 13, 2022, to all unitholders of record as of the close of trading on May 6, 2022. The announced distribution represents a 250.0% increase over the cash distribution of $0.10 per unit for the quarter ended March 31, 2021 (the “2021 Quarter”) and a 40.0% increase over the cash distribution of $0.25 per unit for the quarter ended December 31, 2021.

Preliminary Results for 2022 Quarter

ARLP is providing a preliminary view of the current quarter, which includes the impact of coal shipment delays and oil & gas royalty income tax elections on operating and financial results for the 2022 Quarter.

Shipment delays due to seasonal barge lock maintenance, high river levels and ongoing rail transportation challenges impacted ARLP’s ability to ship approximately 1.1 million tons of contracted tonnage during the 2022 Quarter. These delayed coal shipments are expected to be delivered throughout the balance of the year. The financial impact in the 2022 Quarter reduced ARLP’s previously anticipated coal revenues, net income and EBITDA by approximately $72.0 million, $27.0 million, or $0.21 per basic and diluted limited partner unit, and $31.0 million, respectively. (Unless otherwise noted in this release, “net income” refers to “net income attributable to ARLP.” EBITDA is defined as net income attributable to ARLP before net interest expense, income taxes and depreciation, depletion and amortization.)

Consolidated financial results for the 2022 Quarter will also reflect ARLP’s recent election to convert Alliance Minerals, LLC, the holding company for ARLP’s oil & gas royalty activities, from a partnership pass-through entity taxable at the individual unitholder level to that of a corporate taxable entity for federal and state income tax purposes. This election effectively reduces the total income tax burden on our oil & gas royalties, as ARLP will pay entity level taxes at corporate tax rates that are well below the individual tax rates that would otherwise be paid by our unitholders. As a result, for the 2022 Quarter ARLP will record a one-time non-cash deferred income tax expense and liability of approximately $37.0 million related to the election in addition to a current income tax expense of approximately $5.0 million, which collectively are expected to reduce net income by approximately $42.0 million or $0.33 per basic and diluted limited partner unit.

Reflecting the impacts discussed above, ARLP currently anticipates net income for the 2022 Quarter to be in a range of $35.0 ? $37.0 million or $0.27 ? $0.28 per basic and diluted limited partner unit, compared to net income of $24.7 million or $0.19 per unit for the 2021 Quarter.

Increased Guidance for Full Year 2022

Commenting on current energy markets, Joseph W. Craft III, Chairman, President and Chief Executive Officer, said, “Favorable market conditions for oil, natural gas and coal that developed during the second half of last year soared during the 2022 Quarter. Since we provided initial full-year 2022 guidance for ARLP on January 31, 2022, worldwide commodity prices skyrocketed. We expect energy markets should remain favorable for the next several years, allowing ARLP to capture price realizations well above our previous expectations. As a result, we currently anticipate 2022 coal sales volumes to be approximately 500,000 tons above our initial guidance ranges and that coal sales price per ton sold should exceed our previous expectations by 10.0% ? 22.0%. Segment Adjusted EBITDA Expense per ton sold is also expected to increase slightly above initial estimates as our mining operations continue to effectively manage inflationary pressures and supply chain challenges at our coal mines.”

Mr. Craft continued, “We also anticipate our royalty businesses will benefit from these robust energy markets. Significantly higher oil & gas prices have spurred operators to increase production, leading to anticipated increases in ARLP’s oil & gas royalty volumes this year. The performance of our coal royalty business is also expected to benefit from higher revenue per royalty ton sold. As a result, we currently anticipate ARLP’s 2022 full-year financial and operating results will surpass our initial expectations, despite the short-term effects of transportation challenges on performance during the first half of the year.”

Reflecting the expected benefits of favorable market conditions and increased commodity prices, ARLP is updating its previous guidance as outlined below:

2022 Full Year Guidance


Coal Operations


Volumes (Million Short Tons)


Illinois Basin Sales Tons


25.2 — 26.0

Appalachia Sales Tons


10.3 — 11.0

Total Sales Tons


35.5 — 37.0


Committed & Priced Sales Tons


2022 — Domestic/Export/Total


30.1/4.1/34.2

2023 — Domestic/Export/Total


17.9/2.0/19.9


Per Ton Estimates


Coal Sales Price per ton sold (1)


$54.00 — $63.00

Segment Adjusted EBITDA Expense per ton sold (2)


$33.50 — $35.50


Royalties


Oil & Gas Royalties


Oil (000 Barrels)


885 – 935

Natural gas (000 MCF)


3,000 – 3,400

Liquids (000 Barrels)


350 – 380

Segment Adjusted EBITDA Expense (% of Oil & Gas Royalties Revenue)


~ 12.0%


Coal Royalties


Royalty tons sold (Million Short Tons)


21.5 — 22.0

Revenue per royalty ton sold


$3.10 — $3.20

Segment Adjusted EBITDA Expense per royalty ton sold


$1.10 — $1.20


Consolidated (Millions)


Depreciation, depletion and amortization


$260 — $270

General and administrative


$82 — $84

Net interest expense


$37 — $38

Income tax expense


$53 — $55

Capital expenditures


$220 — $240

_________________________

(1) Sales price per ton is defined as total coal sales revenue divided by total tons sold.

(2) Segment Adjusted EBITDA Expense is defined as operating expenses, coal purchases and other expense.

This announcement is intended to be a qualified notice under Treasury Regulation Section 1.1446-4(b), with 100% of the partnership’s distributions to foreign investors attributable to gross income, gain or loss that is effectively connected with a United States trade or business. Accordingly, ARLP’s distributions to foreign investors are subject to federal income tax withholding at the highest applicable tax rate.

A conference call regarding ARLP’s 2022 Quarter financial results is scheduled for Monday, May 2, 2022 at 10:00 a.m. Eastern. To participate in the conference call, dial (877) 407-0784 and request to be connected to the Alliance Resource Partners, L.P. earnings conference call. International callers should dial (201) 689-8560 and request to be connected to the same call. Investors may also listen to the call via the “investor information” section of ARLP’s website at http://www.arlp.com.

An audio replay of the conference call will be available for approximately one week. To access the audio replay, dial U.S. Toll Free (844) 512-2921; International Toll (412) 317-6671 and request to be connected to replay using access code 13729024.

About Alliance Resource Partners, L.P.

ARLP is a diversified natural resource company that generates operating and royalty income from coal produced by its mining complexes and royalty income from mineral interests it owns in strategic oil & gas producing regions in the United States, primarily the Permian, Anadarko and Williston basins.

ARLP currently produces coal from seven mining complexes its subsidiaries operate in Illinois, Indiana, Kentucky, Maryland and West Virginia. ARLP also operates a coal loading terminal on the Ohio River at Mount Vernon, Indiana. ARLP markets its coal production to major domestic and international utilities and industrial users and is currently the second largest coal producer in the eastern United States.

In addition, ARLP is positioning itself as an energy provider for the future by leveraging its core technology and operating competencies to make strategic investments in the fast growing energy and infrastructure transition.

News, unit prices and additional information about ARLP, including filings with the Securities and Exchange Commission, are available at http://www.arlp.com. For more information, contact the investor relations department of ARLP at (918) 295-7674 or via e-mail at investorrelations@arlp.com.

The statements and projections used throughout this release are based on current expectations. These statements and projections are forward-looking, and actual results may differ materially. These projections do not include the potential impact of any mergers, acquisitions or other business combinations that may occur after the date of this release. We have included more information below regarding business risks that could affect our results.

FORWARD-LOOKING STATEMENTS: With the exception of historical matters, any matters discussed in this press release are forward-looking statements that involve risks and uncertainties that could cause actual results to differ materially from projected results. Those forward-looking statements include expectations with respect to coal and oil & gas consumption and expected future prices, optimizing cash flows, reducing operating and capital expenditures, preserving liquidity and maintaining financial flexibility, among others. These risks to our ability to achieve these outcomes include, but are not limited to, the following: the severity, magnitude, and duration of the COVID-19 pandemic and the emergence of new virus variants, including impacts of the pandemic and of businesses’ and governments’ responses to the pandemic, including actions to mitigate its impact and the development of treatments and vaccines, on our operations and personnel, and on demand for coal, oil, and natural gas, the financial condition of our customers and suppliers, available liquidity and capital sources and broader economic disruptions; changes in macroeconomic and market conditions and market volatility arising from the COVID-19 pandemic or otherwise, including inflation, changes in coal, oil, natural gas, and natural gas liquids prices, and the impact of such changes and volatility on our financial position; decline in the coal industry’s share of electricity generation, including as a result of environmental concerns related to coal mining and combustion and the cost and perceived benefits of other sources of electricity and fuels, such as oil & gas, nuclear energy, and renewable fuels; changes in global economic and geo-political conditions or in industries in which our customers operate; changes in coal prices and/or oil & gas prices, demand and availability which could affect our operating results and cash flows; actions of the major oil-producing countries with respect to oil production volumes and prices could have direct and indirect impacts over the near and long term on oil & gas exploration and production operations at the properties in which we hold mineral interests; changes in competition in domestic and international coal markets and our ability to respond to such changes; potential shut-ins of production by operators of the properties in which we hold mineral interests due to low oil, natural gas, and natural gas liquid prices or the lack of downstream demand or storage capacity; risks associated with the expansion of our operations and properties; our ability to identify and complete acquisitions; dependence on significant customer contracts, including renewing existing contracts upon expiration; adjustments made in price, volume, or terms to existing coal supply agreements; the effects of and changes in trade, monetary and fiscal policies and laws, including the interest rate policies of the Federal Reserve Board; the effects of and changes in taxes or tariffs and other trade measures adopted by the United States and foreign governments; legislation, regulations, and court decisions and interpretations thereof, both domestic and foreign, including those relating to the environment and the release of greenhouse gases, mining, miner health and safety, hydraulic fracturing, and health care; deregulation of the electric utility industry or the effects of any adverse change in the coal industry, electric utility industry, or general economic conditions; investors’ and other stakeholders’ increasing attention to environmental, social, and governance matters; liquidity constraints, including those resulting from any future unavailability of financing; customer bankruptcies, cancellations or breaches to existing contracts, or other failures to perform; customer delays, failure to take coal under contracts or defaults in making payments; our productivity levels and margins earned on our coal sales; disruptions to oil & gas exploration and production operations at the properties in which we hold mineral interests; changes in raw material costs, including due to inflationary pressures; changes in our ability to recruit, hire and maintain labor, including, as a result of, the potential impact of government-imposed vaccine mandates; our ability to maintain satisfactory relations with our employees; increases in labor costs including costs of health insurance and taxes resulting from the Affordable Care Act, adverse changes in work rules, or cash payments or projections associated with workers’ compensation claims; increases in transportation costs and risk of transportation delays or interruptions; operational interruptions due to geologic, permitting, labor, weather or other factors; risks associated with major mine-related accidents, mine fires, mine floods or other interruptions; results of litigation, including claims not yet asserted; foreign currency fluctuations that could adversely affect the competitiveness of our coal abroad; difficulty maintaining our surety bonds for mine reclamation as well as workers’ compensation and black lung benefits; difficulty in making accurate assumptions and projections regarding post-mine reclamation as well as pension, black lung benefits, and other post-retirement benefit liabilities; uncertainties in estimating and replacing our coal mineral reserves and resources; uncertainties in estimating and replacing our oil & gas reserves; uncertainties in the amount of oil & gas production due to the level of drilling and completion activity by the operators of our oil & gas properties; the impact of current and potential changes to federal or state tax rules and regulations, including a loss or reduction of benefits from certain tax deductions and credits; difficulty obtaining commercial property insurance, and risks associated with our participation in the commercial insurance property program; evolving cybersecurity risks, such as those involving unauthorized access, denial-of-service attacks, malicious software, data privacy breaches by employees, insiders or others with authorized access, cyber or phishing-attacks, ransomware, malware, social engineering, physical breaches, or other actions; and difficulty in making accurate assumptions and projections regarding future revenues and costs associated with equity investments in companies we do not control.

Additional information concerning these and other factors can be found in ARLP’s public periodic filings with the SEC, including ARLP’s Annual Report on Form 10-K for the year ended December 31, 2021, filed on February 25, 2022 with the SEC. Except as required by applicable securities laws, ARLP does not intend to update its forward-looking statements.

Brian L. Cantrell
Alliance Resource Partners, L.P.
(918) 295-7673

Source: Alliance Resource Partners, L.P.