Release – Eagle Bulk Shipping Inc. Reports Results for the First Quarter of 2022


Eagle Bulk Shipping Inc. Reports Results for the First Quarter of 2022

Research, News, and Market Data on Eagle Bulk Shipping

STAMFORD, Conn., May 05, 2022 (GLOBE NEWSWIRE) — Eagle Bulk Shipping Inc. (NASDAQ: EGLE) (“Eagle Bulk,” “Eagle” or the “Company”), one of the world’s largest owner-operators within the midsize drybulk vessel segment, today reported financial results for the quarter ended March 31, 2022.

Quarter highlights:

  • Generated Revenues, net of $184.4 million
    • Achieved TCE
      (1) of $27,407/day basis TCE Revenue(1) of $121.6 million
  • Realized net income of $53.1 million, or $4.09 per basic share
    • Adjusted net income(1) of $64.5 million, or $4.97 per adjusted basic share(1)
  • Generated EBITDA
    (1) of $72.1 million
    • Adjusted EBITDA
      (1) of $85.0 million
  • Declared a quarterly dividend of $2.00 per share for the first quarter of 2022. Payable on May 25, 2022 to shareholders of record at the close of business on May 16, 2022

Recent Developments:

  • Looking ahead, as of May 3, 2022, our coverage position is as follows:
    • Q2 2022 – 83% of available days fixed at an average TCE of $29,300

Eagle’s CEO Gary Vogel commented, “Over the past few months, the tragic situation in Ukraine has had a direct impact on our industry and our Company, with cargo trading patterns being disrupted and altered.  Furthermore, a significant number of our seafarer colleagues are from Ukraine, and they are all affected by what is happening to their country and their loved ones.  The safety and well-being of our crew is of paramount importance, and we are focused on supporting them during this difficult time by providing assistance with temporary housing, transportation, and helping with other needs.

Notwithstanding a volatile rate environment, Eagle posted strong results in the first quarter, in what is typically the weakest period of the year.  We achieved a TCE of $27,407 per day, generating an adjusted net income of $65 million for the quarter.  Based on this result and our expectations for continued strong performance, Eagle’s Board declared a first quarter dividend of $2.00 per share, bringing total distributions to over $6 per share since we initiated our dividend program just seven months ago.

Demand growth for minor bulks remains healthy and continues to outpace demand for the broader drybulk market, resulting in Supramax/Ultramax vessels outperforming the larger dry bulk segments.  Voyage distances have also increased, driven primarily by dislocations caused by the war in Ukraine, which has in turn helped to strengthen spot rates.  On the back of this and our active management approach to trading, Eagle has thus far procured approximately 83% of its available days for the second quarter at a net TCE of $29,300 per day.”

These are non-GAAP financial measures. A reconciliation of GAAP to non-GAAP financial measures has been provided in the financial tables included in this press release. An explanation of these measures and how they are calculated are also included below under the heading “Supplemental Information – Non-GAAP Financial Measures.”

Fleet Operating Data 


Three Months Ended


March 31, 2022


March 31, 2021

Ownership Days


4,770


4,199


Chartered in Days


960


658


Available Days


5,397


4,648


Operating Days


5,381


4,622


Fleet Utilization (%)


99.7

%


99.4

%

Results of Operations for
the three months ended March 31, 2022 and 2021

For the three months ended March 31, 2022, the Company reported net income of $53.1 million, or basic and diluted income of $4.09 per share and $3.27 per share, respectively. In the comparable quarter of 2021, the Company reported net income of $9.8 million, or basic and diluted income of $0.84 per share.

For the three months ended March 31, 2022, the Company reported an adjusted net income of $64.5 million, which excludes unrealized losses on derivative instruments of $11.4 million, or basic and diluted adjusted net income of $4.97 per share and $3.97 per share, respectively. In the comparable quarter of 2021, the Company reported adjusted net income of $9.3 million, which excludes unrealized gains on derivative instruments of $0.5 million, or basic and diluted adjusted net income of $0.80 per share.

Revenues, net

Revenues, net for the three months ended March 31, 2022 were $184.4 million compared to $96.6 million in the comparable quarter in 2021. The increase in revenues was primarily attributable to higher charter rates as a result of the market recovery with increase in demand for drybulk products.

Voyage expenses

Voyage expenses for the three months ended March 31, 2022 were $43.6 million compared to $26.6 million in the comparable quarter in 2021. The increase in voyage expenses was primarily due to an increase in bunker consumption expense as bunker fuel prices increased in the first quarter, as well as an increase in voyage charter business and an increase in broker commission expense as a result of the increase in revenues.

Vessel operating expenses

Vessel operating expenses for the three months ended March 31, 2022 were $27.9 million compared to $21.5 million in the comparable quarter in 2021. The increase in vessel operating expenses was primarily attributable to higher owned days and an increase in vessel upgrades as a result of an increase in repairs and upgrades performed while vessels were in drydock. The Company continues to incur higher costs related to the delivery of stores and spares, as well as crew changes as a result of the ongoing COVID-19 pandemic. The ownership days for the three months ended March 31, 2022 and 2021 were 4,770 and 4,199, respectively.

Average daily vessel operating expenses excluding one-time, non-recurring expenses related to vessel acquisitions for the three months ended March 31, 2022 were $5,821 as compared to $4,894 for the three months ended March 31, 2021.

Charter hire expenses

Charter hire expenses for the three months ended March 31, 2022 were $22.7 million compared to $8.5 million in the comparable quarter in 2021. The increase in charter hire expenses was principally due to an increase in chartered-in days and an increase in charter hire rates due to improvement in the charter hire market. The total chartered-in days for the three months ended March 31, 2022 were 960 compared to 658 for the comparable quarter in the prior year. The Company currently charters in four Ultramax vessels on a long-term basis as of the charter-in commencement date with options to extend the charter period.

Depreciation and
amortization

Depreciation and amortization expense for the three months ended March 31, 2022 and 2021 was $14.6 million and $12.5 million, respectively. Total depreciation and amortization expense for the three months ended March 31, 2022 includes $11.7 million of vessel and other fixed asset depreciation and $2.9 million relating to the amortization of deferred drydocking costs. Comparable amounts for the three months ended March 31, 2021 were $10.5 million of vessel and other fixed asset depreciation and $2.0 million of amortization of deferred drydocking costs. The increase in depreciation expense is due to the acquisition of nine Ultramax vessels in 2021, offset by the sale of one vessel in the third quarter of 2021. The increase in amortization of deferred drydock costs is related to completing eleven drydocks since the first quarter of 2021.

General and administrative
expenses

General and administrative expenses for the three months ended March 31, 2022 and 2021 were $10.1 million and $7.7 million, respectively. General and administrative expenses include stock-based compensation of $1.5 million and $0.9 million for the three months ended March 31, 2022 and 2021, respectively. The increase in general and administrative expenses was mainly attributable to an increase in legal and consulting expenses, compensation and benefits, and stock-based compensation expense.

Other operating expense

Other operating expense for the three months ended March 31, 2022 and 2021 was $0.1 million and $1.0 million, respectively. In March 2021, the U.S. government began investigating an allegation that one of our vessels may have improperly disposed of ballast water that entered the engine room bilges during a repair. The Company posted a surety bond as security for any fines, penalties or associated costs that may be issued. Other operating expense consists of expenses relating to the incident, which include legal fees, surety bond expenses, vessel off-hire, crew changes and travel costs.

Interest expense

Interest expense for the three months ended March 31, 2022 and 2021 was $4.4 million and $8.3 million, respectively. The decrease in interest expense is primarily due to a decrease in outstanding debt and lower interest rates due to the refinancing of the Company’s debt in the fourth quarter of 2021.

Realized and unrealized
loss on derivative instruments, net

Realized and unrealized loss on derivative instruments, net for the three months ended March 31, 2022 and 2021 was $7.9 million and $0.7 million, respectively. The increase in realized and unrealized losses is primarily related to losses incurred on our freight forward agreements as a result of the increase in charter hire rates. The non-cash unrealized losses on forward freight agreements (“FFA”) for the remaining nine months of 2022 amounted to $14.3 million based on 2,520 days hedged at a weighted average FFA contract price of $20,942 per day.

The following table shows our open positions on FFAs as of March 31, 2022:

FFA Period

Number of Days
Hedged


Average FFA
Contract Price

Quarter ending June 30, 2022

405


$

16,672

Quarter ending September 30, 2022

1,125


22,503

Quarter ending December 31, 2022

990


20,914

        
Liquidity and Capital Resources


Three Months Ended

(In thousands)

March 31, 2022


March 31, 2021

Net cash provided by operating activities 
(1)

$

42,254


$

14,333


Net cash used in investing activities 
(2)


(3,937

)


(53,385

)

Net cash (used in)/provided by financing activities (3)


(40,862

)


30,916


Net decrease in cash, cash equivalents and restricted cash


(2,545

)


(8,136

)

Cash, cash equivalents and restricted cash at beginning of period


86,222


88,849


Cash, cash equivalents and restricted cash at end of period

$

83,677


$

80,713


(1)

Net cash provided by operating activities for the three months ended March 31, 2022 and 2021 was $42.3 million and $14.3 million, respectively. The increase in cash flows provided by operating activities resulted primarily from the increase in revenues due to higher charter hire rates.


(2)

Net cash used in investing activities for the three months ended March 31, 2022 was $3.9 million, compared to $53.4 million in the comparable period in the prior year. During the three months ended March 31, 2022, the Company paid $3.5 million for the purchase of ballast water treatment systems on our fleet. Additionally, the Company paid $0.3 million for vessel improvements and $0.2 million for other fixed assets.


(3)

Net cash used in financing activities for the three months ended March 31, 2022 was $40.9 million compared to net cash provided by financing activities of $30.9 million in the comparable period in 2021. During the three months ended March 31, 2022, the Company repaid $12.5 million of the Global Ultraco Facility. The Company also paid $26.8 million in dividends and $1.9 million to settle net share equity awards.

As of March 31, 2022, our cash and cash equivalents including restricted cash was $83.7 million compared to $86.2 million as of December 31, 2021.

As of March 31, 2022, the Company’s outstanding debt of $389.2 million which excludes debt discount and debt issuance costs consisted of $275.1 million under the Global Ultraco Debt Facility and $114.1 million under the Convertible Bond Debt.

In addition, as of March 31, 2022, we had $100.0 million in an undrawn revolver facility available under the Global Ultraco Debt Facility.

We continuously evaluate potential transactions that we believe will be accretive to earnings, enhance shareholder value or are in the best interests of the Company, including without limitation, business combinations, the acquisition of vessels or related businesses, repayment or refinancing of existing debt, the issuance of new securities, share repurchases or other transactions.

Capital Expenditures and
Drydocking

Our capital expenditures relate to the purchase of vessels and capital improvements to our vessels, which are expected to enhance the revenue earning capabilities and safety of the vessels.

In addition to acquisitions that we may undertake in future periods, the Company’s other major capital expenditures include funding the Company’s program of regularly scheduled drydocking necessary to comply with international shipping standards and environmental laws and regulations. Although the Company has some flexibility regarding the timing of its drydocking, the costs are relatively predictable. Management anticipates that vessels are to be drydocked every two and a half years for vessels older than 15 years and five years for vessels younger than 15 years. Funding of these requirements is anticipated to be met with cash from operations. We anticipate that this process of recertification will require us to reposition these vessels from a discharge port to shipyard facilities, which will reduce our available days and operating days during that period.

Drydocking costs incurred are deferred and amortized to expense on a straight-line basis over the period through the date of the next scheduled drydocking for those vessels. In the three months ended March 31, 2022, four of our vessels completed drydock and one vessel was in drydock as of March 31, 2022, and we incurred drydocking expenditures of $10.8 million. In the three months ended March 31, 2021, four of our vessels completed drydock and we incurred drydocking expenditures of $4.8 million.

The following table represents certain information about the estimated costs for anticipated vessel drydockings, ballast water treatment systems (“BWTS”), and vessel upgrades in the next four quarters, along with the anticipated off-hire days:


Projected Costs (1) (in millions)

Quarter Ending

Off-hire Days(2)

BWTS

Drydocks

Vessel Upgrades(3)

June 30, 2022

213

$

0.5

$

3.1

$

0.6

September 30, 2022

139


0.3


2.7


0.2

December 31, 2022

118


0.6


2.1


0.2

March 31, 2023

120


0.1


2.6


0.4


(1)

Actual costs will vary based on various factors, including where the drydockings are actually performed.


(2)

Actual duration of off-hire days will vary based on the age and condition of the vessel, yard schedules and other factors.


(3)

Vessel upgrades represents capex relating to items such as high-spec low friction hull paint which improves fuel efficiency and reduces fuel costs, NeoPanama Canal chock fittings enabling vessels to carry additional cargo through the new Panama Canal locks, as well as other retrofitted fuel-saving devices. Vessel upgrades are discretionary in nature and evaluated on a business case-by-case basis.


SUMMARY CONSOLIDATED FINANCIAL AND OTHER DATA

The following table summarizes the Company’s selected condensed consolidated financial and other data for the periods indicated below.

 CONDENSED CONSOLIDATED STATEMENTS OF OPERATIONS
For the Three Months Ended March 31, 2022 and 2021
(In thousands, except share and per share data)


Three Months Ended


March 31, 2022


March 31, 2021

Revenues, net

$

184,398


$

96,572


Voyage expenses


43,627


26,615


Vessel operating expenses


27,915


21,519


Charter hire expenses


22,711


8,480


Depreciation and amortization


14,580


12,506


General and administrative expenses


10,054


7,698


Other operating expense


133


961


Total operating expenses


119,020


77,779


Operating income


65,378


18,793


Interest expense


4,447


8,251


Interest income


(45

)


(17

)

Realized and unrealized loss on derivative instruments, net


7,903


710


Total other expense, net


12,305


8,944


Net income

$

53,073


$

9,849


Weighted average shares outstanding:


Basic


12,974,125


11,729,492


Diluted


16,254,898


11,744,568


Per share amounts:


Basic net income

$

4.09


$

0.84


Diluted net income

$

3.27


$

0.84


CONDENSED CONSOLIDATED BALANCE SHEETS
March 31, 2022 and December 31, 2021
(In thousands, except share data and par values)


March 31, 2022


December 31, 2021

ASSETS:


Current assets:


Cash and cash equivalents

$

83,602


$

86,147


Accounts receivable, net of a reserve of $1,837 and $1,818, respectively


40,918


28,456


Prepaid expenses


5,278


3,362


Inventories


27,771


17,651


Collateral on derivatives


21,307


15,081


Fair value of derivative assets – current


5,516


4,669


Other current assets


797


667


Total current assets


185,189


156,033


Noncurrent assets:


Vessels and vessel improvements, at cost, net of accumulated depreciation of $230,318 and $218,670, respectively


900,920


908,076


Operating lease right-of-use assets


18,654


17,017


Other fixed assets, net of accumulated depreciation of $1,452 and $1,403, respectively


368


257


Restricted cash – noncurrent


75


75


Deferred drydock costs, net


44,985


37,093


Fair value of derivative assets – noncurrent


8,476


3,112


Advances for ballast water systems and other assets


3,920


4,995


Total noncurrent assets


977,398


970,625


Total assets

$

1,162,587


$

1,126,658


LIABILITIES & STOCKHOLDERS’
EQUITY


Current liabilities:


Accounts payable

$

23,396


$

20,781


Accrued interest


1,512


2,957


Other accrued liabilities


18,815


17,994


Fair value of derivative liabilities – current


13,111


4,253


Current portion of operating lease liabilities


15,749


15,728


Unearned charter hire revenue


12,746


12,088


Current portion of long-term debt


49,800


49,800


Total current liabilities


135,129


123,601


Noncurrent liabilities:


Global Ultraco Debt Facility, net of debt issuance costs


217,245


229,290


Convertible Bond Debt, net of debt discount and debt issuance costs


113,150


100,954


Noncurrent portion of operating lease liabilities


2,899


1,282


Other noncurrent accrued liabilities


395


265


Total noncurrent liabilities


333,689


331,791


Total liabilities


468,818


455,392


Commitments and contingencies


Stockholders’ equity:


Preferred stock, $0.01 par value, 25,000,000 shares authorized, none issued as of March 31, 2022 and December 31, 2021


Common stock, $0.01 par value, 700,000,000 shares authorized, 12,985,994 and 12,917,027 shares issued and outstanding as of March 31, 2022 and December 31, 2021, respectively


130


129


Additional paid-in capital


961,930


982,746


Accumulated deficit


(278,858

)


(313,495

)

Accumulated other comprehensive income


10,567


1,886


Total stockholders’ equity


693,769


671,266


Total liabilities and
stockholders’ equity

$

1,162,587


$

1,126,658


CONDENSED CONSOLIDATED STATEMENTS OF CASH FLOWS
For the Three Months Ended March 31, 2022 and 2021
(In thousands)


Three Months Ended


March 31, 2022


March 31, 2021

Cash flows from operating
activities:


Net income

$

53,073


$

9,849


Adjustments to reconcile net
income to net cash provided by operating activities:


Depreciation


11,697


10,507


Amortization of operating lease right-of-use assets


5,706


3,080


Amortization of deferred drydocking costs


2,883


1,999


Amortization of debt discount and debt issuance costs


567


1,629


Net unrealized loss/(gain) on fair value of derivatives


11,450


(503

)

Stock-based compensation expense


1,487


872


Drydocking expenditures


(10,774

)


(4,821

)

Changes in operating assets and
liabilities:


Accounts payable


3,010


6,488


Accounts receivable


(12,462

)


(6,697

)

Accrued interest


(1,445

)


2,150


Inventories


(10,120

)


(3,096

)

Operating lease liabilities current and noncurrent


(5,706

)


(3,302

)

Collateral on derivatives


(6,226

)


Fair value of derivatives, other current and noncurrent assets


(252

)


(5,743

)

Other accrued liabilities


623


159


Prepaid expenses


(1,916

)


(308

)

Unearned charter hire revenue


659


2,070


Net cash provided by operating
activities


42,254


14,333


Cash flows from investing
activities:


Purchase of vessels and vessel improvements


(283

)


(47,977

)

Advances for vessel purchases


(4,720

)

Purchase of scrubbers and ballast water systems


(3,494

)


(755

)

Proceeds from hull and machinery insurance claims


75


Purchase of other fixed assets


(160

)


(8

)

Net cash used in investing
activities


(3,937

)


(53,385

)


Cash flows from financing
activities:


Repayment of term loan under New Ultraco Debt Facility


(7,811

)

Repayment of revolver loan under Super Senior Facility


(15,000

)

Proceeds from revolver loan under New Ultraco Debt Facility


55,000


Repayment of term loan under Global Ultraco Debt Facility


(12,450

)


Cash received from exercise of stock options


85


Cash used to settle net share equity awards


(1,862

)


(811

)

Equity offerings issuance costs


201


(292

)

Financing costs paid to lenders


(18

)


(170

)

Dividends paid


(26,818

)


Net cash (used in)/provided by
financing activities


(40,862

)


30,916


Net decrease in Cash, cash equivalents and restricted cash


(2,545

)


(8,136

)

Cash, cash equivalents and restricted cash at beginning of period


86,222


88,849


Cash, cash equivalents and
restricted cash at end of period

$

83,677


$

80,713


SUPPLEMENTAL CASH FLOW INFORMATION


Cash paid during the period for interest

$

4,791


$

4,320


Accruals for vessel purchases and vessel improvements included in Other accrued liabilities

$

70


$

244


Accruals for scrubbers and ballast water treatment systems included in Accounts payable and Other accrued liabilities

$

2,943


$

3,153


Accruals for dividends payable included in Other accrued liabilities and Other noncurrent accrued liabilities

$

785


$


Accruals for debt issuance costs included in Accounts payable and Other accrued liabilities

$


$

250


Supplemental Information – Non-GAAP Financial Measures

This release includes various financial measures that are non-GAAP financial measures as defined under the rules of the Securities and Exchange Commission (“SEC”). We believe these measures provide important supplemental information to investors to use in evaluating ongoing operating results. We use these measures, together with accounting principles generally accepted in the United States (“GAAP” or “U.S. GAAP”) measures, for internal managerial purposes and as a means to evaluate period-to-period comparisons. However, we do not, and you should not, rely on non-GAAP financial measures alone as measures of our performance. We believe that non-GAAP financial measures reflect an additional way of viewing aspects of our operations, that when taken together with GAAP results and the reconciliations to corresponding GAAP financial measures that we also provide in our press releases, provide a more complete understanding of factors and trends affecting our business. We strongly encourage you to review all of our financial statements and publicly-filed reports in their entirety and to not rely on any single financial measure.

Because non-GAAP financial measures are not standardized, it may not be possible to compare these financial measures with other companies’ non-GAAP financial measures, even if they have similar names.

Non-GAAP Financial Measures

(1) Adjusted net income and
Adjusted Basic and Diluted income per share

Adjusted net income and Adjusted Basic and Diluted income per share represents Net income and Basic and Diluted income per share, respectively, as adjusted to exclude non-cash unrealized losses/(gains) on derivatives and loss on debt extinguishment. The Company utilizes derivative instruments such as FFAs to partially hedge against its underlying long physical position in ships (as represented by owned and third-party chartered-in vessels). The Company does not apply hedge accounting, and, as such, the mark-to-market gains/(losses) on forward hedge positions impact current quarter results, causing timing mismatches in the Condensed Consolidated Statement of Operations. Additionally, we believe that loss on debt extinguishment is not representative of our normal business operations. We believe that Adjusted net income and Adjusted income per share are more useful to analysts and investors in comparing the results of operations and operational trends between periods and relative to other peer companies in our industry. Our Adjusted net income should not be considered an alternative to net income, operating income, cash flows provided by operating activities or any other measure of financial performance or liquidity presented in accordance with U.S. GAAP. As noted above, our Adjusted net income may not be comparable to similarly titled measures of another company because all companies may not calculate Adjusted net income in the same manner.

The following table presents the reconciliation of our Net income to Adjusted net income:

Reconciliation of GAAP Net income to Adjusted Net income
For the Three Months Ended March 31, 2022 and 2021
(In thousands, except share and per share data)


Three Months Ended


March 31, 2022


March 31, 2021

Net income


$

53,073


$

9,849


Adjustments to reconcile net income to Adjusted net income:


Unrealized loss/(gain) on derivatives


11,450


(503

)

Adjusted Net income


$

64,523


$

9,346


Weighted average shares outstanding:


Basic


12,974,125


11,729,492


Diluted (1)


16,254,898


11,744,568


Per share amounts:


Basic adjusted net income


$

4.97


$

0.80


Diluted adjusted net income(1)


$

3.97


$

0.80


(1)

The number of shares used in the Diluted income per share and Diluted adjusted net income per share calculation for the three months ended March 31, 2022 includes 3,150,381 dilutive shares related to the Convertible Bond Debt based on the if-converted method per U.S. GAAP in addition to the restricted stock awards and restricted stock units based on the Treasury stock method.


(2)

EBITDA
and Adjusted EBITDA

We define EBITDA as net income under GAAP adjusted for interest, income taxes, depreciation and amortization.

Adjusted EBITDA is a non-GAAP financial measure that is used as a supplemental financial measure by our management and by external users of our financial statements, such as investors, commercial banks and others, to assess our operating performance as compared to that of other companies in our industry, without regard to financing methods, capital structure or historical costs basis. Our Adjusted EBITDA should not be considered an alternative to net income/(loss), operating income/(loss), cash flows provided by/(used in) operating activities or any other measure of financial performance or liquidity presented in accordance with U.S. GAAP. Our Adjusted EBITDA may not be comparable to similarly titled measures of another company because all companies may not calculate Adjusted EBITDA in the same manner. Adjusted EBITDA represents EBITDA adjusted to exclude the items which represent certain non-cash, one-time and other items such as vessel impairment, gain/(loss) on sale of vessels, impairment of operating lease right-of-use assets, unrealized (gain)/loss on derivatives, loss on debt extinguishment and stock-based compensation expenses that the Company believes are not indicative of the ongoing performance of its core operations.

The following table presents a reconciliation of our net income to EBITDA and Adjusted EBITDA:

Reconciliation of GAAP Net income to EBITDA and Adjusted EBITDA
For the Three Months Ended March 31, 2022 and 2021
(In thousands)


Three Months Ended


March 31, 2022


March 31, 2021

Net income


$

53,073


$

9,849


Adjustments to reconcile net income to EBITDA:


Interest expense


4,447


8,251


Interest income


(45

)


(17

)

Income taxes


EBIT


57,475


18,083


Depreciation and amortization


14,580


12,506


EBITDA


72,055


30,589


Non-cash, one-time and other adjustments to EBITDA(1)


12,937


369


Adjusted EBITDA


$

84,992


$

30,958


(1)

One-time and other adjustments to EBITDA for the three months ended March 31, 2022 includes stock-based compensation and unrealized losses on derivatives. One-time and other adjustments to EBITDA for the three months ended March 31, 2021 includes stock-based compensation and unrealized gains on derivatives.


(3)

TCE
revenue and TCE

Time charter equivalent (“TCE”) is a non-GAAP financial measure that is commonly used in the shipping industry primarily to compare daily earnings generated by vessels on time charters with daily earnings generated by vessels on voyage charters, because charter hire rates for vessels on voyage charters are generally not expressed in per-day amounts while charter hire rates for vessels on time charters generally are expressed in such amounts. The Company defines TCE as shipping revenues less voyage expenses and charter hire expenses, adjusted for realized gains/(losses) on FFAs and bunker swaps, divided by the number of owned available days. TCE provides additional meaningful information in conjunction with shipping revenues, the most directly comparable GAAP measure, because it assists Company management in making decisions regarding the deployment and use of its vessels and in evaluating their financial performance. The Company’s calculation of TCE may not be comparable to that reported by other companies. The Company calculates relative performance by comparing TCE against the Baltic Supramax Index (“BSI”) adjusted for commissions and fleet makeup. Owned available days is the number of our ownership days less the aggregate number of days that our vessels are off-hire due to vessel familiarization upon acquisition, repairs, vessel upgrades or special surveys. The shipping industry uses available days to measure the number of days in a period during which vessels should be capable of generating revenues.

The following table presents the reconciliation of revenues, net to TCE:

Reconciliation of Revenues, net to TCE
For the Three Months Ended March 31, 2022 and 2021
(In thousands, except owned available days and TCE data)


Three Months Ended


March 31, 2022


March 31, 2021

Revenues, net

$

184,398


$

96,572


Less:


Voyage expenses


(43,627

)


(26,615

)

Charter hire expenses


(22,711

)


(8,480

)

Reversal of one legacy time charter 
(1)


83


Realized gain/(loss) on FFAs and bunker swaps


3,547


(1,213

)

TCE revenue

$

121,607


$

60,347


Owned available days


4,437


3,990


TCE

$

27,407


$

15,124


(1)

Prior to the third quarter of 2021, the Company adjusted for the impact of one legacy time charter in the TCE revenue and TCE financial measures.

Glossary of Terms:

Ownership days: We define ownership days as the aggregate number of days in a period during which each vessel in our fleet has been owned by us. Ownership days are an indicator of the size of our fleet over a period and affect both the amount of revenues and the amount of expenses that we recorded during a period.

Chartered-in under operating lease days: We define chartered-in under operating lease days as the aggregate number of days in a period during which we chartered-in vessels. Periodically, the Company charters in vessels on a single trip basis.

Available days: We define available days as the number of our ownership days and chartered-in days less the aggregate number of days that our vessels are off-hire due to vessel familiarization upon acquisition, repairs, vessel upgrades or special surveys and other reasons which prevent the vessel from performing under the relevant charter party such as surveys, medical events, stowaway disembarkation, etc. The shipping industry uses available days to measure the number of days in a period during which vessels should be capable of generating revenues.

Operating days: We define operating days as the number of available days in a period less the aggregate number of days that our vessels are off-hire due to any reason, including unforeseen circumstances. The shipping industry uses operating days to measure the aggregate number of days in a period during which vessels actually generate revenues.

Fleet utilization: We calculate fleet utilization by dividing the number of our operating days during a period by the number of our available days during the period. The shipping industry uses fleet utilization to measure a company’s efficiency in finding suitable employment for its vessels and minimizing the amount of days that its vessels are off-hire for reasons other than scheduled repairs or repairs under guarantee, vessel upgrades, special surveys or vessel positioning. Our fleet continues to perform at high utilization rates.

Definitions of capitalized terms related to our Indebtedness

Global Ultraco Debt Facility: Global Ultraco Debt Facility refers to the senior secured credit facility entered into by Ultraco on October 1, 2021, along with certain of its vessel-owning subsidiaries as guarantors, with the lenders party thereto (the “Lenders”), Credit Agricole Corporate and Investment Bank (“Credit Agricole”), Skandinaviska Enskilda Banken AB (PUBL), Danish Ship Finance A/S, Nordea Bank ABP, Filial I Norge, DNB Markets Inc., Deutsche Bank AG, and ING Bank N.V., London Branch. The Global Ultraco Debt Facility provides for an aggregate principal amount of $400.0 million, which consists of (i) a term loan facility in an aggregate principal amount of $300.0 million and (ii) a revolving credit facility in an aggregate principal amount of $100.0 million. The Global Ultraco Debt Facility is secured by 49 of the Company’s vessels. As of March 31, 2022, $100.0 million of the revolving credit facility remains undrawn.

Convertible Bond Debt: Convertible Bond Debt refers to $114.1 million that the Company raised from its issuance of 5.0% Convertible Senior Notes on July 29, 2019. They are due in 2024.

New Ultraco Debt Facility: New Ultraco Debt Facility refers to senior secured credit facility for $208.4 million entered into by Ultraco Shipping LLC (“Ultraco”), a wholly-owned subsidiary of the Company, as the borrower (the “New Ultraco Debt Facility”), with the Company and certain of its indirectly vessel-owning subsidiaries, as guarantors (the “Guarantors”), the lenders party thereto, the swap banks party thereto, ABN AMRO Capital USA LLC (“ABN AMRO”), Credit Agricole Corporate and Investment Bank, Skandinaviska Enskilda Banken AB (PUBL) and DNB Markets Inc., as mandated lead arrangers and bookrunners, and Credit Agricole Corporate and Investment Bank, as arranger, security trustee and facility agent. The New Ultraco Debt Facility was refinanced on October 1, 2021.

Super Senior Facility: Super Senior Facility refers to the credit facility for $15.0 million, by and among Shipco as borrower, and ABN AMRO Capital USA LLC, as original lender, mandated lead arranger and agent. During the third quarter of 2021, the Company cancelled the Super Senior Revolving Facility. There were no outstanding amounts under the facility.

Conference Call Information

As previously announced, members of Eagle Bulk’s senior management team will host a teleconference and webcast at 8:00 a.m. ET on Friday, May 6, 2022, to discuss the first quarter results.

To participate in the teleconference, investors and analysts are invited to call +1 844-282-4411 in the U.S., or +1 512-900-2336 outside of the U.S., and reference participant code 4384843. A simultaneous webcast of the call, including a slide presentation for interested investors and others, may be accessed by visiting http://www.eagleships.com.

A replay will be available following the call from 11:00 AM ET on May 6, 2022 until 11:00 AM ET on May 16, 2022. To access the replay, call +1 855-859-2056 in the U.S., or +1 404-537-3406 outside of the U.S., and reference passcode 4384843.

About Eagle Bulk Shipping Inc.

Eagle Bulk Shipping Inc. (“Eagle” or the “Company”) is a U.S. based fully integrated, shipowner-operator providing global transportation solutions to a diverse group of customers including miners, producers, traders, and end users. Headquartered in Stamford, Connecticut, with offices in Singapore and Copenhagen, Denmark, Eagle focuses exclusively on the versatile mid-size drybulk vessel segment and owns one of the largest fleets of Supramax/Ultramax vessels in the world. The Company performs all management services in-house (including: strategic, commercial, operational, technical, and administrative) and employs an active management approach to fleet trading with the objective of optimizing revenue performance and maximizing earnings on a risk-managed basis. For further information, please visit our website: www.eagleships.com.

Website Information 

We intend to use our website, 
www.eagleships.com, as a means of disclosing material non-public information and for complying with our disclosure obligations under Regulation FD. Such disclosures will be included in our website’s Investor Relations section. Accordingly, investors should monitor the Investor Relations portion of our website, in addition to following our press releases, filings with the SEC, public conference calls, and webcasts. To subscribe to our e-mail alert service, please click the “Investor Alerts” link in the Investor Relations section of our website and submit your email address. The information contained in, or that may be accessed through, our website is not incorporated by reference into or a part of this document or any other report or document we file with or furnish to the SEC, and any references to our website are intended to be inactive textual references only.

Disclaimer: Forward-Looking Statements

Matters discussed in this release may constitute forward-looking statements that may be deemed to be “forward-looking statements” within the meaning of Section 27A of the Securities Act of 1933, as amended, and Section 21E of the Securities Exchange Act of 1934, as amended. Forward-looking statements reflect current views with respect to future events and financial performance and may include statements concerning plans, objectives, goals, strategies, future events or performance, and underlying assumptions and other statements, which are other than statements of historical facts. These statements may include words such as “believe,” “estimate,” “project,” “intend,” “expect,” “plan,” “anticipate,” and similar expressions in connection with any discussion of the timing or nature of future operating or financial performance or other events.

The forward-looking statements in this release are based upon various assumptions, many of which are based, in turn, upon further assumptions, including without limitation, examination of historical operating trends, data contained in our records and other data available from third parties. Although Eagle Bulk Shipping Inc. believes that these assumptions were reasonable when made, because these assumptions are inherently subject to significant uncertainties and contingencies which are difficult or impossible to predict and are beyond our control, Eagle Bulk Shipping Inc. cannot assure you that it will achieve or accomplish these expectations, beliefs or projections.

Important factors that, in our view, could cause actual results to differ materially from those discussed in the forward-looking statements include the strength of world economies and currencies, general market conditions, including changes in charter hire rates and vessel values, changes as a result of COVID-19, including the availability and effectiveness of vaccines on a widespread basis and the impact of any mutations of the virus, changes in demand that may affect attitudes of time charterers to scheduled and unscheduled drydocking, changes in vessel operating expenses, including drydocking and insurance costs, or actions taken by regulatory authorities, ability of our counterparties to perform their obligations under sales agreements, charter contracts, and other agreements on a timely basis, potential liability from future litigation, domestic and international political conditions including the current conflict between Russia and Ukraine, which may impact our ability to retain and source crew, and in turn, could adversely affect our revenue, expenses and profitability, potential disruption of shipping routes due to accidents and political events or acts by terrorists.

Risks and uncertainties are further described in reports filed by Eagle Bulk Shipping Inc. with the SEC.

CONTACT

Company Contact:
Frank De Costanzo
Chief Financial Officer
Eagle Bulk Shipping Inc.
Tel. +1 203-276-8100
Email: 
investor@eagleships.com

Media:
Rose and Company
Tel. +1 212-359-2228
——————————————————————————–

Source: Eagle Bulk Shipping Inc.
Deeper Dive to Understanding Machine Learning


Image Credit: MIT News


Unpacking Black-Box Models

Adam Zewe | MIT News
Office

Modern machine-learning models, such as neural networks, are often referred to as “black boxes” because they are so complex that even the researchers who design them can’t fully understand how they make predictions.

To provide some insights, researchers use explanation methods that seek to describe individual model decisions. For example, they may highlight words in a movie review that influenced the model’s decision that the review was positive.

But these explanation methods don’t do any good if humans can’t easily understand them, or even misunderstand them. So, MIT researchers created a mathematical framework to formally quantify and evaluate the understandability of explanations for machine-learning models. This can help pinpoint insights about model behavior that might be missed if the researcher is only evaluating a handful of individual explanations to try to understand the entire model.

“With this framework, we can have a very clear picture of not only what we know about the model from these local explanations, but more importantly what we don’t know about it,” says Yilun Zhou, an electrical engineering and computer science graduate student in the Computer Science and Artificial Intelligence Laboratory (CSAIL) and lead author of a paper presenting this framework.

Zhou’s co-authors include Marco Tulio Ribeiro, a senior researcher at Microsoft Research, and senior author Julie Shah, a professor of aeronautics and astronautics and the director of the Interactive Robotics Group in CSAIL. The research will be presented at the Conference of the North American Chapter of the Association for Computational Linguistics.

Understanding Local Explanations

One way to understand a machine-learning model is to find another model that mimics its predictions but uses transparent reasoning patterns. However, recent neural network models are so complex that this technique usually fails. Instead, researchers resort to using local explanations that focus on individual inputs. Often, these explanations highlight words in the text to signify their importance to one prediction made by the model.

Implicitly, people then generalize these local explanations to overall model behavior. Someone may see that a local explanation method highlighted positive words (like “memorable,” “flawless,” or “charming”) as being the most influential when the model decided a movie review had a positive sentiment. They are then likely to assume that all positive words make positive contributions to a model’s predictions, but that might not always be the case, Zhou says.

The researchers developed a framework, known as ExSum (short for explanation summary), that formalizes those types of claims into rules that can be tested using quantifiable metrics. ExSum evaluates a rule on an entire dataset, rather than just the single instance for which it is constructed.


Using a graphical user interface, an individual writes rules that can then be tweaked, tuned, and evaluated. For example, when studying a model that learns to classify movie reviews as positive or negative, one might write a rule that says “negation words have negative saliency,” which means that words like “not,” “no,” and “nothing” contribute negatively to the sentiment of movie reviews.

Using ExSum, the user can see if that rule holds up using three specific metrics: coverage, validity, and sharpness. Coverage measures how broadly applicable the rule is across the entire dataset. Validity highlights the percentage of individual examples that agree with the rule. Sharpness describes how precise the rule is; a highly valid rule could be so generic that it isn’t useful for understanding the model.

Testing Assumptions

If a researcher seeks a deeper understanding of how her model is behaving, she can use ExSum to test specific assumptions, Zhou says.

If she suspects her model is discriminative in terms of gender, she could create rules to say that male pronouns have a positive contribution and female pronouns have a negative contribution. If these rules have high validity, it means they are true overall and the model is likely biased.

ExSum can also reveal unexpected information about a model’s behavior. For example, when evaluating the movie review classifier, the researchers were surprised to find that negative words tend to have more pointed and sharper contributions to the model’s decisions than positive words. This could be due to review writers trying to be polite and less blunt when criticizing a film, Zhou explains.

“To really confirm your understanding, you need to evaluate these claims much more rigorously on a lot of instances. This kind of understanding at this fine-grained level, to the best of our knowledge, has never been uncovered in previous works,” he says.

“Going from local explanations to global understanding was a big gap in the literature. ExSum is a good first step at filling that gap,” adds Ribeiro.

Extending the Framework

In the future, Zhou hopes to build upon this work by extending the notion of understandability to other criteria and explanation forms, like counterfactual explanations (which indicate how to modify an input to change the model prediction). For now, they focused on feature attribution methods, which describe the individual features a model used to make a decision (like the words in a movie review).

In addition, he wants to further enhance the framework and user interface so people can create rules faster. Writing rules can require hours of human involvement — and some level of human involvement is crucial because humans must ultimately be able to grasp the explanations — but AI assistance could streamline the process.

As he ponders the future of ExSum, Zhou hopes their work highlights a need to shift the way researchers think about machine-learning model explanations.

“Before this work, if you have a correct local explanation, you are done. You have achieved the holy grail of explaining your model. We are proposing this additional dimension of making sure these explanations are understandable. Understandability needs to be another metric for evaluating our explanations,” says Zhou.

Reprinted with permission of MIT News” and a link to the MIT News homepage ( http://news.mit.edu/)


Suggested Reading


Two Ways Artificial Intelligence is Helping Cybersecurity


Edge Computing Importance to AI Applications


One Stop Systems (OSS) NobleCon18 Presentation Replay


Blackboxstocks (BLBX) NobleCon18 Presentation Replay


Stay up to date. Follow us:


Release – Genprex Issues Shareholder Letter and Provides 2022 Corporate Update


Genprex Issues Shareholder Letter and Provides 2022 Corporate Update

Research, News, and Market Data on Genprex

Company achieves major
milestones in clinical development programs in 2022

Patient
treatment in Acclaim-2 clinical trial commences


AUSTIN, Texas — (May 5, 2022) — Genprex,
Inc.
 (“Genprex” or the “Company”) (NASDAQ: GNPX), a clinical-stage gene therapy company focused on developing life-changing therapies for patients with cancer and diabetes, today announced that it has issued a shareholder letter and corporate update outlining the Company’s recent progress in its clinical development programs and key milestones and achievements for 2022 and beyond.

“We have had a strong start to this year, achieving many key milestones for our Company,” said Rodney Varner, President and Chief Executive Officer of Genprex. “We announced our second Fast Track Designation for REQORSA™ Immunogene Therapy, we commenced patient treatment in our Phase 1/2 Acclaim-1 clinical trial for non-small cell lung cancer (NSCLC), we opened our Phase 1/2 Acclaim-2 clinical trial for NSCLC and commenced patient treatment in that trial (having treated the first patient in April 2022), and we expanded our clinical development pipeline to include small cell lung cancer (SCLC).  I am enthusiastic about our future as we continue to advance our leading edge gene therapy programs with the goal of extending hope and life to patients with serious disease and unmet need.”

To read the letter in its entirety, a digital copy of the Company’s Shareholder Letter can be found on the Company’s website here.


About Genprex, Inc.

Genprex, Inc. is a clinical-stage gene therapy company focused on developing life-changing therapies for patients with cancer and diabetes. Genprex’s technologies are designed to administer disease-fighting genes to provide new therapies for large patient populations with cancer and diabetes who currently have limited treatment options. Genprex works with world-class institutions and collaborators to develop drug candidates to further its pipeline of gene therapies in order to provide novel treatment approaches. Genprex’s oncology program utilizes its unique, proprietary, non-viral ONCOPREX® Nanoparticle Delivery System, which the Company believes is the first systemic gene therapy delivery platform used for cancer in humans. ONCOPREX encapsulates the gene-expressing plasmids using lipid nanoparticles. The resultant product is administered intravenously, where it is then taken up by tumor cells that express proteins that are deficient. The Company’s lead product candidate, REQORSA™ (quaratusugene ozeplasmid), is being evaluated as a treatment for non-small cell lung cancer (NSCLC). REQORSA has a multimodal mechanism of action that has been shown to interrupt cell signaling pathways that cause replication and proliferation of cancer cells; re-establish pathways for apoptosis, or programmed cell death, in cancer cells; and modulate the immune response against cancer cells. REQORSA has also been shown to block mechanisms that create drug resistance. In 2020, the U.S. Food and Drug Administration (FDA) granted Fast Track Designation for REQORSA for NSCLC in combination therapy with AstraZeneca’s Tagrisso® (osimertinib) for patients with EFGR mutations whose tumors progressed after treatment with TagrissoIn 2021, the FDA granted Fast Track Designation for REQORSA for NSCLC in combination therapy with Merck & Co’s Keytruda® (pembrolizumab) for patients whose disease progressed after treatment with Keytruda.

For more information, please visit the Company’s web site at 
www.genprex.com or follow Genprex on TwitterFacebook and LinkedIn.


Cautionary Language Concerning
Forward-Looking Statements 

Statements contained in this press release regarding matters that are not historical facts are “forward-looking statements” within the meaning of the Private Securities Litigation Reform Act of 1995. These forward-looking statements are made on the basis of the current beliefs, expectations and assumptions of management, are not guarantees of performance and are subject to significant risks and uncertainty. These forward-looking statements should, therefore, be considered in light of various important factors, including those set forth in Genprex’s reports that it files from time to time with the Securities and Exchange Commission and which you should review, including those statements under “Item 1A – Risk Factors” in Genprex’s Annual Report on Form 10-K for the year ended December 31, 2021.

Because forward-looking statements are subject to risks and uncertainties, actual results may differ materially from those expressed or implied by such forward-looking statements. Such statements include, but are not limited to, statements regarding: the timing and success of Genprex’s clinical trials and regulatory approvals, including the extent and impact of the COVID-19 pandemic; the effect of Genprex’s product candidates, alone and in combination with other therapies, on cancer and diabetes; Genprex’s future growth and financial status; Genprex’s commercial and strategic partnerships, including those with its third party manufacturers and their ability to successfully perform and scale up the manufacture of its product candidates; and Genprex’s intellectual property and licenses. 

These forward-looking statements should not be relied upon as predictions of future events and Genprex cannot assure you that the events or circumstances discussed or reflected in these statements will be achieved or will occur. If such forward-looking statements prove to be inaccurate, the inaccuracy may be material. You should not regard these statements as a representation or warranty by Genprex or any other person that Genprex will achieve its objectives and plans in any specified timeframe, or at all. You are cautioned not to place undue reliance on these forward-looking statements, which speak only as of the date of this press release. Genprex disclaims any obligation to publicly update or release any revisions to these forward-looking statements, whether as a result of new information, future events or otherwise, after the date of this press release or to reflect the occurrence of unanticipated events, except as required by law.

Genprex,
Inc.
(877) 774-GNPX (4679)

GNPX
Investor Relations

investors@genprex.com

GNPX
Media Contact

Kalyn Dabbs

media@genprex.com

CoreCivic, Inc. (CXW) – First Look at 1Q22

Thursday, May 05, 2022

CoreCivic, Inc. (CXW)
First Look at 1Q22

CoreCivic is a diversified, government-solutions company with the scale and experience needed to solve tough government challenges in flexible, cost-effective ways. We provide a broad range of solutions to government partners that serve the public good through high-quality corrections and detention management, a network of residential and non-residential alternatives to incarceration to help address America’s recidivism crisis, and government real estate solutions. We are the nation’s largest owner of partnership correctional, detention and residential reentry facilities, and believe we are the largest private owner of real estate used by government agencies in the United States. We have been a flexible and dependable partner for government for nearly 40 years. Our employees are driven by a deep sense of service, high standards of professionalism and a responsibility to help government better the public good. Learn more at www.corecivic.com.

Joe Gomes, Senior Research Analyst, Noble Capital Markets, Inc.

Joshua Zoepfel, Research Associate, Noble Capital Markets, Inc.

Refer to the full report for the price target, fundamental analysis, and rating.

A Miss. CoreCivic reported first quarter results after the market closed yesterday. Revenue came in at $453 million, compared to $454.7 million in the same period last year. Consensus was $465 million. The Company reported adjusted net income of $17.4 million, or $0.14 per share, compared to $29.3 million, or $0.24 per share last year. Consensus EPS net income was $23.1 million, or $0.19 per share. We had projected revenue of $473 million and EPS of $0.18.

What Drove the Miss? Headwinds include a challenging labor market, especially for nurses, disruption from the commencement of the La Palma contract in Arizona, and a drop in federal detainees, partially offset by higher populations at the state level….

This Company Sponsored Research is provided by Noble Capital Markets, Inc., a FINRA and S.E.C. registered broker-dealer (B/D).

*Analyst certification and important disclosures included in the full report. NOTE: investment decisions should not be based upon the content of this research summary. Proper due diligence is required before making any investment decision. 

High Food and High Real Estate Prices Should Cause a Shift in Investors’ Watch-Lists


Image Credit: Mark Chinnick


Food Costs, Empty Shelves, and Real Estate Prices Could Provide Investors With Opportunities

Food shortages, inflation, and skyrocketing real estate. These are the most discussed topics among my social media followers. The discussions, and memes, seem to be defining 2022, just as the pandemic defined 2020 and vaccinating for the pandemic defined 2021.  During the two-plus decades I managed billions in funds on Wall Street, my mind became trained to connect dots and look for opportunities. As news stories scrolled down my Bloomberg screen, the automatic thought process was always to ask myself, what’s impacted, is it bullish or bearish, is there an investment opportunity, and what risks might I be missing.

Connecting Dots

Last month I attended my first in-person conference in two years. In the interest of full disclosure, Channelchek is a sponsor of the NobleCon investor conference, but it is without bias that I know this annual event consistently opens my eyes to companies and realities that grow my investment acumen.

During the investor event my mind becomes super busy digesting and connecting economic and investment “dots.” Matching what I know about the markets with what the list of company presenters are explaining about their companies is exciting. Since video replays of the conference presentations are available online, I’ve recently started watching what I did not see in person. In this way, I can make sure I haven’t missed anything.

Working through the companies alphabetically, I started with Alico Inc (ALCO). Alico is a Florida-based food producer and land management company. As mentioned earlier, my social media (and traditional media) newsfeed is full of stories of food inflation, food shortages, and climbing land values, especially in Florida. Alico’s bottom line would seem to benefit from any or all of these situations.

About Alico (ALCO)

The 120-year-old company is one of the largest citrus producers in the U.S., it owns and manages citrus groves in seven Florida counties. Alico is a major landowner with a total of  49,000 prime citrus acres and 84,000 acres in total. In addition to having strong long-term contracts and relationships with companies like Tropicana, the company also holds thousands of acres of ranch land in Florida. As much as 26,000 acres of this real estate is for sale which stands to benefit of shareholders.


Source: Koyfin

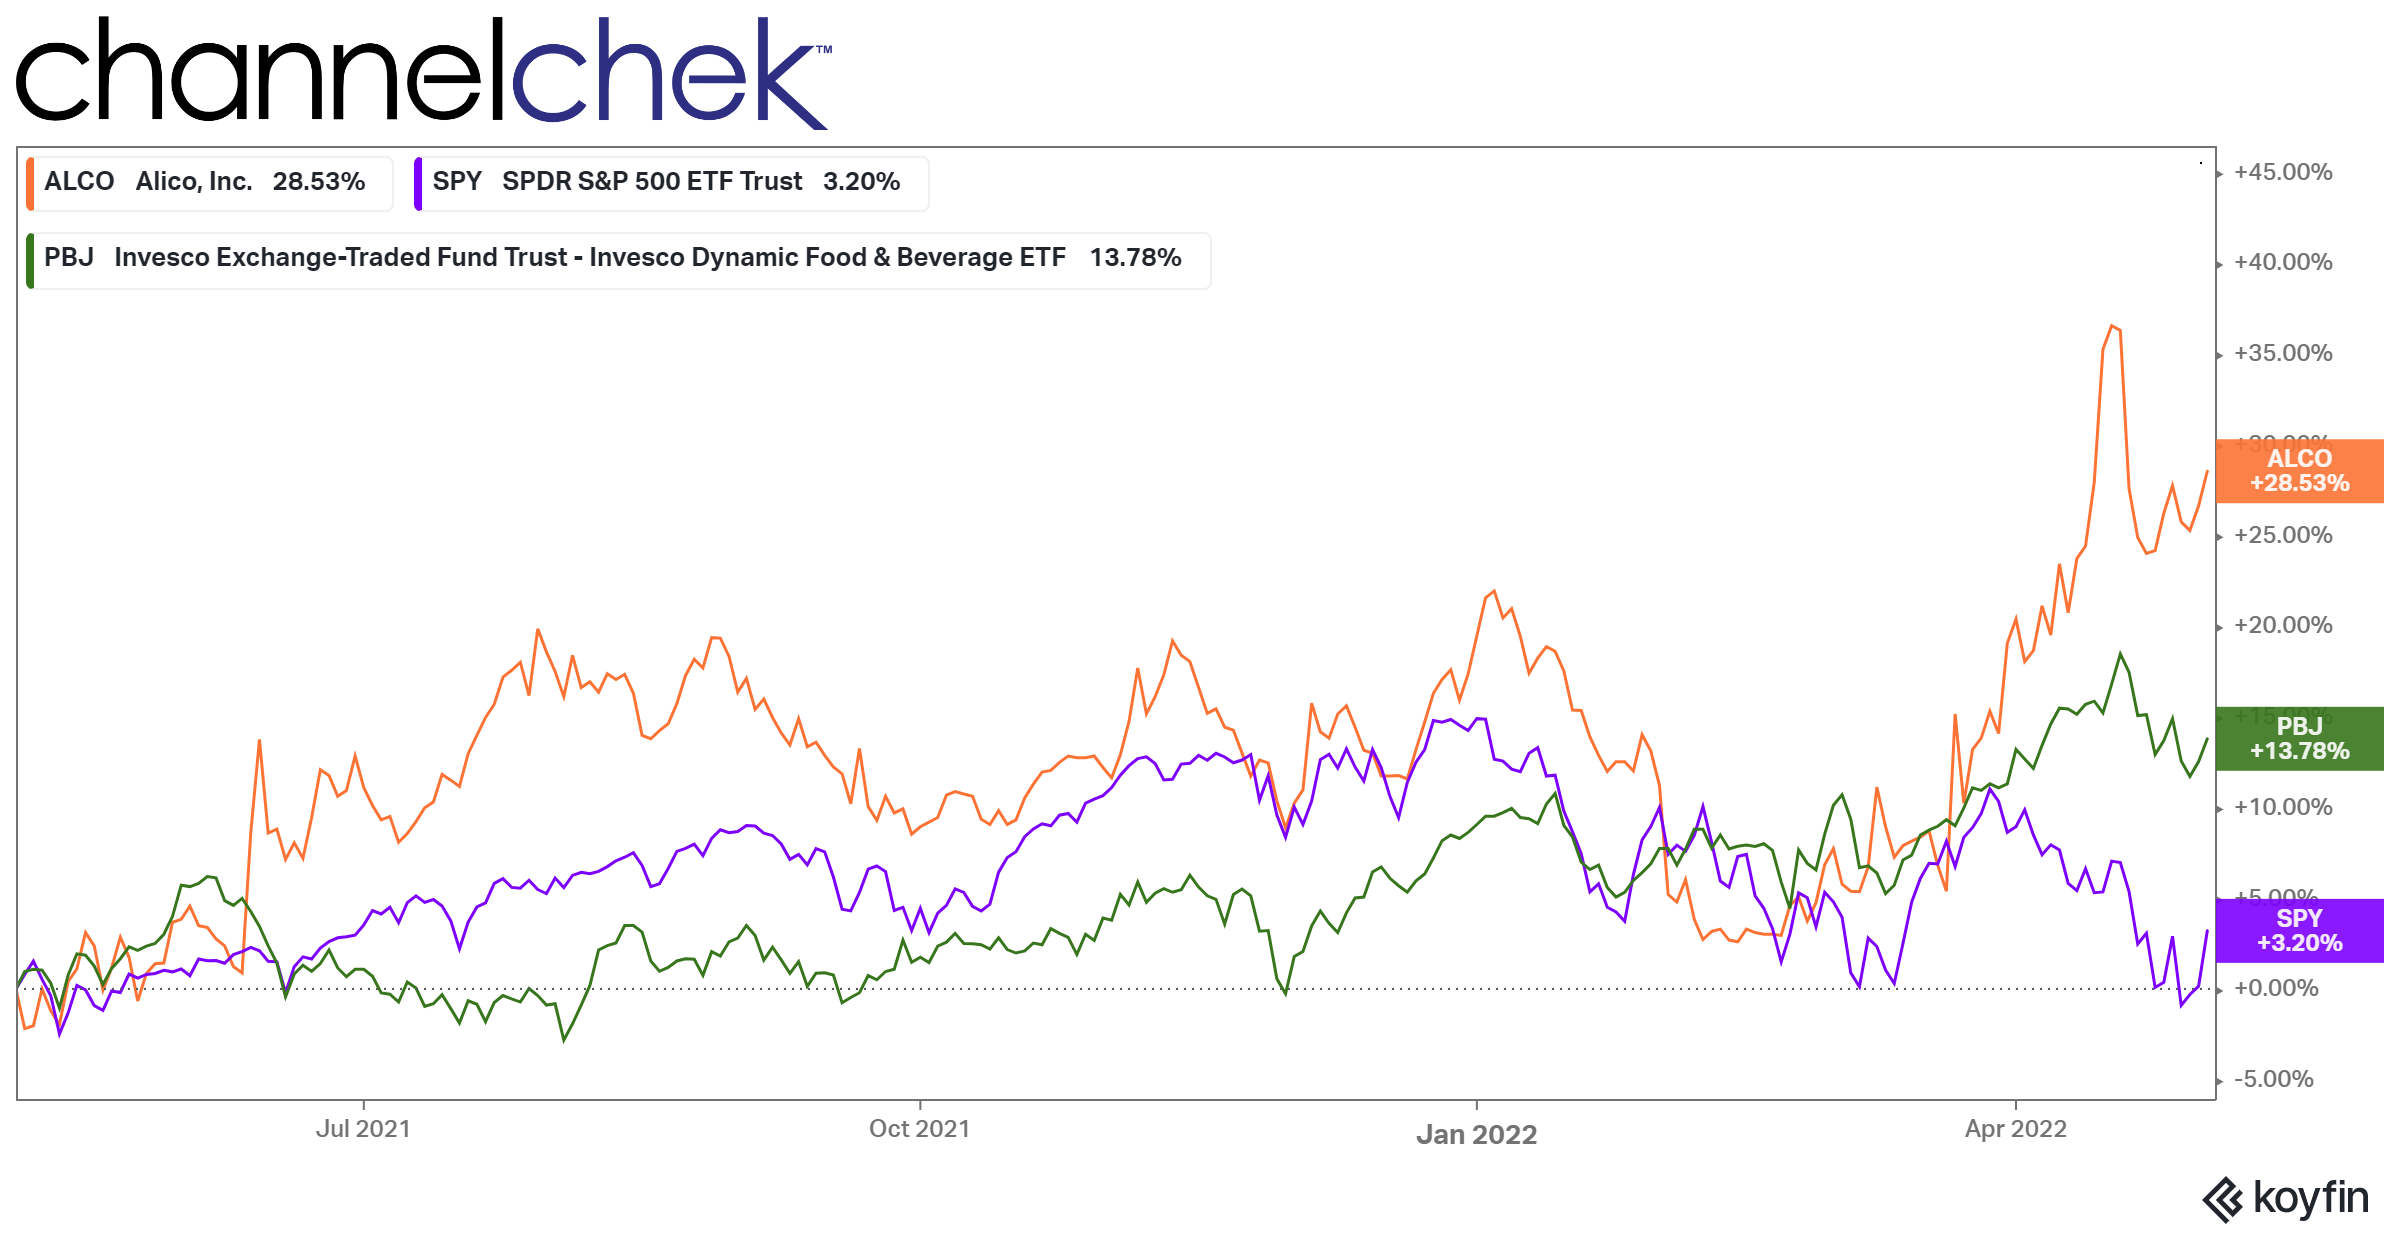
The chart above compares the one year performance of ALCO with that of the S&P 500 along with Invesco Dynamic Food & Beverage ETF (PBJ)

During the recorded presentation, Rich Rallo, the chief financial officer of Alico, discussed what he described as a market cap disconnect where the company’s stock price and asset valuation is below the industry norm. This may change as investors allocate away from tech and look for alternatives.

There is plenty to learn from the presentation replay about agri-business in general and Alico specifically. For example, how Alico benefitted from hedging fuel costs, future sales contracts on fruit,  fertilizer, and grove density.

The company recently paid a dividend of about 5%.


Take-Away

Popular investment advice is, “invest in what you know.” It would follow that the more an investor knows, the better equipped they are to recognize opportunities and be comfortable enough to commit capital.

My recent trips to the supermarket has shown me that inflation is running high, and despite the high prices, some shelves are bare. I hear from investors that they want to invest in companies that aren’t hurt by inflation. I suggest they should look for companies that benefit from rising prices.

Alico will be reporting earnings on May 9.

Paul Hoffman

Managing Editor, Channelchek

Suggested Content


Alico (ALCO) NobleCon18 Presentation Replay


Can Energy Stocks Continue Their High Octane Performance?


Energy and Global Fundamentals Make a Good Case for Owning Western Uranium Stocks


Exposure to Non-Travel Leisure Stocks


Stay up to date. Follow us:


Release – Alvopetro Announces April 2022 Sales Volumes and Q1 2022 Results Webcast


Alvopetro Announces April 2022 Sales Volumes and Q1 2022 Results Webcast

Research, News, and Market Data on Alvopetro Energy

CALGARY, AB, May 5, 2022 /CNW/ – Alvopetro Energy Ltd. (TSXV: ALV) (OTCQX: ALVOF) announces April sales volumes of 2,494 boepd, including natural gas sales of 14.3 MMcfpd and associated natural gas liquids sales from condensate of 107 bopd, based on field estimates. 

Upcoming Q1 2022 results webcast

Alvopetro anticipates announcing Q1 2022 results on May 12, 2022 after markets close and will host a live webcast to discuss the results at 8:00 am Mountain time on May 13, 2022. Details for joining the event are as follows:

Date: May 13, 2022

Time: 8:00 AM Mountain/10:00 AM Eastern

Link: https://us06web.zoom.us/j/84318417369

Dial-in Numbers: https://us06web.zoom.us/u/kckYUds2mG

Webinar ID: 843 1841 7369


The webcast will include a question-and-answer period. Online participants will be able to ask questions through the Zoom portal. Dial-in participants can email questions directly to socialmedia@alvopetro.com.

Corporate Presentation

Alvopetro’s updated corporate presentation is available on our website at:
http://www.alvopetro.com/corporate-presentation

Social Media

Follow Alvopetro on our social media channels at the following links:

Twitter – https://twitter.com/AlvopetroEnergy
Instagram – https://www.instagram.com/alvopetro/
LinkedIn – https://www.linkedin.com/company/alvopetro-energy-ltd
YouTube: https://www.youtube.com/channel/UCgDn_igrQgdlj-maR6fWB0w

Alvopetro Energy Ltd.’s vision is to become a leading
independent upstream and midstream operator in Brazil. Our strategy is to unlock
the on-shore natural gas potential in the state of Bahia in Brazil,
building off the development of our Caburé natural gas field and our strategic
midstream infrastructure.

Neither the TSX Venture
Exchange nor its Regulation Services Provider (as that term is defined in the
policies of the TSX Venture Exchange) accepts responsibility for the adequacy
or accuracy of this news release.

All amounts contained in
this new release are in United States dollars, unless otherwise stated and all
tabular amounts are in thousands of United States dollars, except as otherwise
noted.

Abbreviations: 

boepd

=

barrels of oil equivalent (“boe”) per day

bopd

=

barrels of oil and/or natural gas liquids (condensate) per day

MMcf

=

million cubic feet

MMcfpd

=

million cubic feet per day


BOE Disclosure. The term barrels of oil
equivalent (“boe”) may be misleading, particularly if used in isolation.
A boe conversion ratio of six thousand cubic feet per barrel (6Mcf/bbl) of
natural gas to barrels of oil equivalence is based on an energy equivalency
conversion method primarily applicable at the burner tip and does not represent
a value equivalency at the wellhead. All boe conversions in this news release
are derived from converting gas to oil in the ratio mix of six thousand cubic
feet of gas to one barrel of oil.

SOURCE Alvopetro Energy Ltd.

For further information: Corey C. Ruttan, President, Chief Executive Officer and Director, or Alison Howard, Chief Financial Officer, Phone: 587.794.4224, Email: info@alvopetro.com,
www.alvopetro.com, (TSX-V: ALV) (OTCQX: ALVOF)

Release – Lineage Cell Therapeutics to Report First Quarter 2022 Financial Results and Provide Business Update on May 12, 2022


Lineage Cell Therapeutics to Report First Quarter 2022 Financial Results and Provide Business Update on May 12, 2022

CARLSBAD, Calif.–()–Lineage Cell
Therapeutics, Inc.
 (NYSE American and TASE: LCTX), a clinical-stage biotechnology company developing allogeneic cell therapies for unmet medical needs, today announced that it will report its first quarter 2022 financial and operating results on Thursday, May 12, 2022, following the close of the U.S. financial markets. Lineage management will also host a conference call and webcast on Thursday, May 12, 2022, at 4:30 p.m. Eastern Time/1:30 p.m. Pacific Time to discuss its first quarter 2022 financial and operating results and to provide a business update.

Interested parties may access the conference call by dialing (866) 888-8633 from the U.S. and Canada and (636) 812-6629 from elsewhere outside the U.S. and Canada and should request the “Lineage Cell Therapeutics Call”. A live webcast of the conference call will be available online in the Investors section of Lineage’s website. A replay of the webcast will be available on Lineage’s website for 30 days and a telephone replay will be available through May 20, 2022, by dialing (855) 859-2056 from the U.S. and Canada and (404) 537-3406 from elsewhere outside the U.S. and Canada and entering conference ID number 1875641.

About Lineage Cell Therapeutics, Inc.

Lineage Cell Therapeutics is a clinical-stage biotechnology company developing novel cell therapies for unmet medical needs. Lineage’s programs are based on its robust proprietary cell-based therapy platform and associated in-house development and manufacturing capabilities. With this platform Lineage develops and manufactures specialized, terminally differentiated human cells from its pluripotent and progenitor cell starting materials. These differentiated cells are developed to either replace or support cells that are dysfunctional or absent due to degenerative disease or traumatic injury or administered as a means of helping the body mount an effective immune response to cancer. Lineage’s clinical programs are in markets with billion dollar opportunities and include five allogeneic (“off-the-shelf”) product candidates: (i) OpRegen, a retinal pigment epithelial cell therapy in Phase 1/2a development for the treatment of geographic atrophy secondary to age-related macular degeneration, which is being developed under a worldwide collaboration with Roche and Genentech, a member of the Roche Group; (ii) OPC1, an oligodendrocyte progenitor cell therapy in Phase 1/2a development for the treatment of acute spinal cord injuries; (iii) VAC2, a dendritic cell therapy produced from Lineage’s VAC technology platform for immuno-oncology and infectious disease, currently in Phase 1 clinical development for the treatment of non-small cell lung cancer (iv) ANP1, an auditory neuronal progenitor cell therapy for the potential treatment of auditory neuropathy, and (v) PNC1, a photoreceptor neural cell therapy for the treatment of vision loss due to photoreceptor dysfunction or damage. For more information, please visit www.lineagecell.com or follow the company on Twitter @LineageCell.

Contacts

Lineage Cell Therapeutics, Inc. IR
Ioana C. Hone
(
ir@lineagecell.com)
(442) 287-8963

Solebury Trout IR
Justin Frantz
(
jfrantz@soleburytrout.com )
(617) 221-9100

Russo Partners – Media Relations
Nic Johnson or David Schull
Nic.johnson@russopartnersllc.com
David.schull@russopartnersllc.com
(212) 845-4242

Great Lakes Dredge & Dock (GLDD) – Solid 1Q22 Sets the Table for 2022

Thursday, May 05, 2022

Great Lakes Dredge & Dock (GLDD)
Solid 1Q22 Sets the Table for 2022

Great Lakes Dredge & Dock Corporation is the largest provider of dredging services in the United States. In addition, Great Lakes is fully engaged in expanding its core business into the rapidly developing offshore wind energy industry. The Company has a long history of performing significant international projects. The Company employs experienced civil, ocean and mechanical engineering staff in its estimating, production and project management functions. In its over 131-year history, the Company has never failed to complete a marine project. Great Lakes owns and operates the largest and most diverse fleet in the U.S. dredging industry, comprised of approximately 200 specialized vessels. Great Lakes has a disciplined training program for engineers that ensures experienced-based performance as they advance through Company operations. The Company’s Incident-and Injury-Free® (IIF®) safety management program is integrated into all aspects of the Company’s culture. The Company’s commitment to the IIF® culture promotes a work environment where employee safety is paramount.

Joe Gomes, Senior Research Analyst, Noble Capital Markets, Inc.

Joshua Zoepfel, Research Associate, Noble Capital Markets, Inc.

Refer to the full report for the price target, fundamental analysis, and rating.

1Q22 Operating Results. Revenue of $194.4 million exceed our $176 million estimate and consensus $170 million, partly due to the pull forward of certain business. Margin was a little lighter than projections due to dry dockings and weather issues that restricted work. Nonetheless, adjusted EBITDA for the quarter was $29.7 million versus our $32.7 million estimate. EPS for the quarter was $0.17 compared to our estimate of $0.18.

Favorable Environment. The operating environment remains favorable. The Omnibus Appropriations Bill for fiscal year 2022 included funding for the U.S. Army Corps of Engineers totaling $8.3 billion for fiscal year 2022, an increase of $548 million above the fiscal year 2021 level and an increase of $1.6 billion above the President’s original budget request….

This Company Sponsored Research is provided by Noble Capital Markets, Inc., a FINRA and S.E.C. registered broker-dealer (B/D).

*Analyst certification and important disclosures included in the full report. NOTE: investment decisions should not be based upon the content of this research summary. Proper due diligence is required before making any investment decision. 

Release – Motorsport Games to Report First Quarter 2022 Financial Results


Motorsport Games to Report First Quarter 2022 Financial Results

Research, News, and Market Data on Motorsport Games

MIAMI, May 05, 2022 (GLOBE NEWSWIRE) — Motorsport Games, Inc. (NASDAQ: MSGM) (“Motorsport Games”), a leading racing game developer, publisher and esports ecosystem provider of official motorsport racing series throughout the world, will report financial results for the first quarter ended March 31, 2022 on Monday, May 16, 2022 after market close. Management will host a conference call and webcast on the same day at 5:00 p.m. ET to discuss the results.

Participants may access the live webcast on the Company’s investor relations website at https://ir.motorsportgames.com under “Events.” The call may also be accessed by dialing 1 (800) 786-6104 from the U.S., or by dialing 1 (416) 981-9029 internationally.

About Motorsport
Games:

Motorsport Games, a Motorsport Network company, combines innovative and engaging video games with exciting esports competitions and content for racing fans and gamers around the globe. The Company is the officially licensed video game developer and publisher for iconic motorsport racing series across PC, PlayStation, Xbox, Nintendo Switch and mobile, including NASCAR, INDYCAR, 24 Hours of Le Mans and the British Touring Car Championship (“BTCC”). Motorsport Games is an award-winning esports partner of choice for 24 Hours of Le Mans, Formula E, BTCC, the FIA World Rallycross Championship and the eNASCAR Heat Pro League, among others.

For more information about Motorsport Games visit: www.motorsportgames.com.

Contacts:
Investors:

Ashley DeSimone
Ashley.DeSimone@icrinc.com

Can You Gauge the Onset of Market Capitulation?


Image Credit: LM (Flickr)


Winners and Losers in a Market Capitulation

Capitulation can occur on an individual level, but the term is typically used when so many market participants are giving up on their holdings that the stock market moves down as if a bottom has fallen out. The setup for capitulation is in place well in advance of the hours, days, or months that these market events happen. And unlike black swan events which are almost always surprises, market capitulation is characterized by a build-up, and then a release.

It’s also characterized by many investors questioning themselves for holding for so long and potentially letting a profit turn into a loss.

Capitulate Definition

– to surrender often after negotiation of terms
          The enemy was forced to capitulate unconditionally.

-to cease resisting: ACQUIESCE
          The company capitulated to the labor union to avoid a strike.
                    -Merriam-Webster Online

Praying to the Gods of Breakeven

Market capitulation starts after the market has been strong and has rewarded risk-takers. Then stocks seem to be facing headwinds and average investor fears grow. But not by so much that they don’t keep assets in the market. At some point, while they are holding, and prices continue to decline, greed is overtaken taken by fear. That is to say, fear that their positions will never go back up. This fear is then accompanied by hope.

When all hope is lost, investors face what they believe to be reality and finally hit the sell button. They’re often so tired of the painful days that led them to that moment that they don’t care what the fill price is. This causes the market fall to accelerate, then masses holding positions on margin are also forced to sell. These margin calls help feed the accelerated market decline.

Later, like most financial market behavior, when the last person is done selling, there is only one direction the market can head. Up. While it may go sideways for a while, as recently as last year the market indexes hit all-time highs, this after many market capitulations that came before 2021. So up would seem to be the market’s natural long-term direction.

Seeing it Coming

Markets can come down much faster than they climb back up. So taking some risk off the table while the probability of a painful sell-off is increasing, is one way to spare yourself from the worst. This is tricky as people often “lose” more money in lost opportunity than ever lost permanently in the stock market. 

Market players tend to behave in a bear cycle similar to a person playing slots at a casino. The machine takes some money, takes some more money, then occasionally pays. This gives the player hope which convinces them to stay in their seat. Market participants also stay involved because they’re occasionally rewarded and they’d prefer not to miss out on regaining the amount they are down.  Investors may also stay involved because they know that out of every single market fall in history, the market has always come back and hit new highs.

Pay attention to the market’s technical signs if they indicate it may not hold up. Did it easily break through a support level? Is there greater volume on down days than up days? How far past its moving average has it declined?

Fundamental signs are also always worth paying attention to. Is joblessness rising, consumer confidence falling, are taxes being raised, or are interest rates causing money to be too tight for businesses to thrive?

If the market you’re involved in is showing either technical signs of weakening or fundamental factors working against it, the risks have increased.  

Using it to Your Advantage

Market professionals consider the capitulation phase as reflecting the bottom of the market’s price. If investors could identify when capitulation has taken place and it is exhausted fully, they could buy at the bottom. At the point of full capitulation, there are no sellers left, only buyers and the market’s bubble has burst and is set to reinflate.

Signs of Nearing Stock Capitulation

Since the capitulation phase reflects the bottom of a market’s decline, if investors could identify when capitulation has taken place, it would signal the ideal time to buy. As mentioned before, this is because everyone who wanted to sell the security has already done so, and only buyers are left.

The problem in identifying capitulation is that it is usually only visible in hindsight rather than in foresight.


Source: Koyfin

The one year chart above shows a slow march downward for 2022 for all S&P sectors except for oil (XLE) and utilities (XLU). No sector appears to have had the bottom fall out, and there are still investors whose positions are sitting well above what they paid for them. Newer positions however may now be at a loss. The longer the downward slide continues, the more likely individuals will give up hope and margin account holders will be called to sell their positions. This increases the likelihood of a short but sharp downward search for the bottom.

So far the 2022 move downward has been orderly and on a percentage basis not huge, but it is a real reminder that stocks go both up and down. It seemingly doesn’t show that capitulation is imminent or that it has already occurred.

Fundamentally the outlook for stocks is not one of disaster as labor markets are tight, and there is still a large amount of money in the system that the Federal Reserve has not begun to mop up yet. Also, company earnings are mixed to strong.

Crypto-Capitulation

Capitulation that occurs in cryptocurrency markets is often stronger than in equity markets. For example, Bitcoin had a precipitous drop starting on May 2, 2021 when it fell from $57,300. to $29,800. by July 17, 2021. This 40% drop was partially attributed to negative news coming out of China about Bitcoin mining. Capitulation is often more prevalent in speculative assets.

Bottom Line

If seeing the onset of capitulation and knowing when it is exhausted was easy, we’d all be rich. Since that isn’t the case, we can act prudently in a few different ways. Hedging one’s position using the futures market when they feel risk is increasing is one way. This can be effective both while holding a position as the market seems to be gaining downside momentum, or when the investor believes they have found the bottom but would like to protect any new investment.

It is important to remember that the overall indexes have always grown and reached new highs as the economy continues to expand.

Paul Hoffman

Managing Editor, Channelchek

Suggested Content


When Was the Shortest Recession in Your Lifetime?


Black Swans, Falling Knives, and Market Corrections (March 2020)


Food Costs, Empty Shelves, and Real Estate Prices Could Provide Investors With Opportunities


Many Reasons to Remain Bullish on the Energy Sector


Stay up to date. Follow us:


Release – Element79 Gold Announces $5M Equity Facility Upsized to $10M


Element79 Gold Announces $5M Equity Facility Upsized to $10M

News and Market Data on Element79 Gold

VANCOUVER, BC / ACCESSWIRE
/ May 5, 2022 /
Element79 Gold Corp. (CSE:ELEM)(OTC PINK:ELMGF)(FSE:7YS) (“Element79 Gold”, the “Company”) is pleased to announce that Crescita Capital LLC (“Crescita”) has increased its equity drawdown facility commitment to the Company from $5,000,000 to $10,000,000. The additional funding is being made available pursuant to an amendment dated May 2, 2022 (the “Amendment”) to the original Investment and Advisory Agreement with Crescita dated September 14, 2020 (the “Original Agreement”, and together with the Amendment, the “Agreement”). The Company is able to make drawdown requests for funding, from time to time, pursuant to the facility and on closing of each drawdown, the Company will issue common shares to Crescita in accordance with the terms of the Agreement.

The Company has fully utilized the initial $5,000,000 of Crescita’s invested capital in its corporate development and project advancement since its IPO in August 2021, including completing the Phase 1 exploration program on the Dale property, the drilling program on the Snowbird property, and closing on the acquisition of the Nevada portfolio. Element79 Gold intends to utilize the additional capital to continue progress on its high-tempo development strategy, including the upcoming acquisition of the high-grade Peruvian gold portfolio of Calipuy Resources Inc. (“Calipuy”), the continued advancement of the 43-101 compliant mineral resource at the Company’s flagship Maverick Springs Project, and further exploration of the highly prospective Battle Mountain Portfolio. Near term, additional diamond drilling and metallurgical studies are planned to enable a significant portion of the Maverick Springs resource to be upgraded from the inferred to the indicated category.

“Securing this additional capital, particularly in this market environment where many investors are tightening their purse strings, could not be a stronger vote of confidence for Element79 Gold” remarked James Tworek, CEO of Element79 Gold. “We appreciate Crescita’s repeated investment and belief in our story. The timing is excellent. Element79 Gold now enters into its next phase of development from a position of strength, with the ability to focus on the long-term strategic wins for all our stakeholders.”

In addition to providing for the additional $5,000,000 equity drawdown commitment (the “Second Commitment”), the Amendment provides for certain amendments to the Original Agreement including the addition of the requirement for the Company to make a top up payment to Crescita in the event that the volume weighted average price of the Company’s common shares is less than the subscription price paid by Crescita for a particular drawdown in the 30 days following the drawdown, and amends the fees payable to Crescita for the Second Commitment. The Company will pay an 8% fee to Crescita on the Additional Commitment, which fee will be satisfied by the issuance of 533,333 common shares at a deemed price per share equal to the last closing price of the shares prior to the date of the Amendment, less the maximum discount permitted by the Canadian Securities Exchange. These shares are subject to a four-month hold. A copy of the Original Agreement and Amendment are both filed on SEDAR under the Company’s profile.

Potential Road to
Cashflow Operations: Tailings Utilization and Pre-Production Cashflow

The additional capital will be used to start technical work leading to a PEA and also unlocking the potential for preproduction cashflow through at Machacala as the project develops into 350tpd production. This will also allow the Company to investigate opportunities for cashflow, including reprocessing the historic tailing, estimated to contain approximately 200,000 tonnes at Machacala which were estimated in 1997 by Gold Hawk to contain grades of 1.26 g/t gold and 74 g/t silver.(1) Previous metallurgical studies by Gold Hawk show 87% recoveries of gold and 50%+ recovery of silver in 24 hours of leaching of un-milled tailings, with re-milling able to increase recoveries to 90% of gold and 73% of silver in 24 hours of leaching. While the potential of these tailings is apparent, the Element79 Gold team is reviewing their economic potential and will complete further studies upon completing the acquisition of Calipuy.

“The Peruvian assets, and particularly Machacala, have a clear path towards production in the near-term,” commented Antonios Maragakis. “These funds will be critical in progressing the key geological and engineering work to unlock the mines’ potential in an expedited manner”.

While the potential of these tailings is apparent, the Element79 Gold team is reviewing their economic potential and will complete further studies upon completing the acquisition of Calipuy.

Jason Wells, Managing Director of Crescita Capital stated: “We are excited to continue to financially support Element79 Gold and its transition from an exploration company to a producer. The upside that this brings all of the shareholders is significant”.

Qualified Person

The technical information in this release has been reviewed and verified by Neil Pettigrew, M.Sc., P. Geo., Director of Element79 Gold and a “qualified person” as defined by National Instrument 43-101.

About Element79
Gold

Element79 Gold is a mineral exploration company focused on the acquisition, exploration and development of mining properties for gold and associated metals. Element79 Gold has acquired its flagship Maverick Springs Project located in the famous gold mining district of northeastern Nevada, USA, between the Elko and White Pine Counties, where it has recently completed a 43-101-compliant, pit-constrained mineral resource estimate reflecting an Inferred resource of 3.71 million ounces of gold equivalent* “AuEq” at a grade of 0.92 g/t AuEq (0.34 g/t Au and 43.4 g/t Ag)) with an effective date of Feb. 4, 2022. The acquisition of the Maverick Springs Project also included a portfolio of 15 properties along the Battle Mountain trend in Nevada, which the Company is analyzing for further merit of exploration, along with the potential for sale or spin-out. In British Columbia, Element79 Gold has executed a Letter of Intent to acquire a private company which holds the option to 100% interest of the Snowbird High-Grade Gold Project, which consists of 10 mineral claims located in Central British Columbia, approximately 20km west of Fort St. James. In Peru, Element79 Gold has signed a letter of intent to acquire the business and assets of Calipuy Resources Inc., which holds 100% interest in the past-producing Lucero Mine, one of the highest-grade underground mines to be commercially mined in Peru’s history, as well as the past-producing Machacala Mine. The Company also has an option to acquire 100% interest in the Dale Property which consists of 90 unpatented mining claims located approximately 100 km southwest of Timmins, Ontario, Canada in the Timmins Mining Division, Dale Township. For more information about the Company, please visit www.element79.gold or www.element79gold.com.

On Behalf of the Company

James Tworek
CEO

Contact Information

Investor Relations Department

Phone: +1 (604) 200-3608
E-mail: investors@element79.gold

Cautionary Note
Regarding Forward Looking Statements

This press contains “forward?looking information” and “forward-looking statements” under applicable securities laws (collectively, “forward?looking statements”). These statements relate to future events or the Company’s future performance, business prospects or opportunities that are based on forecasts of future results, estimates of amounts not yet determinable and assumptions of management made in light of management’s experience and perception of historical trends, current conditions and expected future developments. Forward-looking statements include, but are not limited to, statements with respect to: the availability of funding for the Company and issuance of shares to Crescita pursuant to the Agreement; the Company’s plans for use of the funding provided by Crescita; the Company’s plans for exploration and development of the properties the own or are proposing to acquire; the completion of the acquisition of Calipuy and the advancement of its properties; the prospects for mineral resources on certain properties; the prospects for leaching and milling at certain properties; the Company’s business strategy; future planning processes; exploration activities; the timing and result of exploration activities; capital projects and exploration activities and the possible results thereof; acquisition opportunities; and the impact of acquisitions, if any, on the Company. Assumptions may prove to be incorrect and actual results may differ materially from those anticipated, including the risk that the Company does not advance its properties as planned;, that the results of exploration and development are not favorable to the Company; that the projects are not feasible; and the risk that Crescita is not able to fund drawdowns as requested by the Company. Consequently, forward-looking statements cannot be guaranteed. As such, investors are cautioned not to place undue reliance upon forward-looking statements as there can be no assurance that the plans, assumptions or expectations upon which they are placed will occur. All statements other than statements of historical fact may be forward?looking statements. Any statements that express or involve discussions with respect to predictions, expectations, beliefs, plans, projections, objectives or future events or performance (often, but not always, using words or phrases such as “seek”, “anticipate”, “plan”, “continue”, “estimate”, “expect”, “may”, “will”, “project”, “predict”, “forecast”, “potential”, “target”, “intend”, “could”, “might”, “should”, “believe” and similar expressions) are not statements of historical fact and may be “forward?looking statements”.

Actual results may vary from forward-looking statements. Forward-looking statements are subject to known and unknown risks, uncertainties and other factors that may cause actual results to materially differ from those expressed or implied by such forward-looking statements, including but not limited to: the duration and effects of the coronavirus and COVID-19; risks related to the integration of acquisitions; actual results of exploration activities; conclusions of economic evaluations; changes in project parameters as plans continue to be refined; commodity prices; variations in ore reserves, grade or recovery rates; actual performance of plant, equipment or processes relative to specifications and expectations; accidents; labour relations; relations with local communities; changes in national or local governments; changes in applicable legislation or application thereof; delays in obtaining approvals or financing or in the completion of development or construction activities; exchange rate fluctuations; requirements for additional capital; government regulation; environmental risks; reclamation expenses; outcomes of pending litigation; limitations on insurance coverage as well as those factors discussed in the Company’s other public disclosure documents, available on www.sedar.com. Although the Company has attempted to identify important factors that could cause actual results to differ materially from those contained in forward-looking statements, there may be other factors that cause results not to be as anticipated, estimated or intended. The Company believes that the expectations reflected in these forward?looking statements are reasonable, but no assurance can be given that these expectations will prove to be correct and such forward?looking statements included herein should not be unduly relied upon. These statements speak only as of the date hereof. The Company does not intend, and does not assume any obligation, to update these forward-looking statements, except as required by applicable laws.

Sources

  1. Gold Hawk Resources Inc News Release, 2004-06-28

Neither the Canadian
Securities Exchange nor the Market Regulator (as that term is defined in the
policies of the Canadian Securities Exchange) accepts responsibility for the
adequacy or accuracy of this release.

SOURCE: Element79 Gold Corp.


Release – Kratos Reports First Quarter 2022 Financial Results


Kratos Reports First Quarter 2022 Financial Results

Research, News, and Market Data on Kratos Defense & Security Solutions

Affirms
Full Year 2022 Financial Guidance

SAN DIEGO, May 05, 2022 (GLOBE NEWSWIRE) — Kratos Defense & Security Solutions, Inc. (Nasdaq:KTOS), a leading National Security Solutions provider, today reported its first quarter 2022 financial results. For the first quarter of 2022, Kratos reported Revenues of $196.2 million, Operating Loss of $1.2 million, Net Loss of $15.9 million and Adjusted EBITDA of $13.8 million.   Included in Net Loss is a $13.0 million loss for a debt extinguishment charge reflecting the premium paid to redeem the Company’s 6.5% Senior Notes and the write-off of related deferred financing costs.

First quarter 2022 Operating Loss includes non-cash stock compensation expense of $7.0 million, which increased $0.8 million from the first quarter of 2021, and Company-funded Research and Development expense of $9.2 million, reflecting significant ongoing development efforts being made, including in our space and satellite business to develop our virtual, software based OpenSpace ground station solution.

Kratos reported a first quarter 2022 GAAP loss per share of $0.12, which included the $13.0 million loss for debt extinguishment charge noted above, compared to Net Income of $1.9 million and GAAP EPS income of $0.01 for the first quarter of 2021. Adjusted EPS was $0.04 for the first quarter of 2022, compared to $0.06 for the first quarter of 2021. Kratos has approximately $235 million of net operating loss carryforwards, which are expected to substantially shield the Company from paying future cash income taxes.   

First quarter 2022 Revenues of $196.2 million, increased $2.0 million, or 1.0 percent, from first quarter 2021 Revenues of $194.2 million, were adversely impacted by the extended 6 month Continuing Resolution Authorization (CRA), which was not resolved until the end of March 2022. First quarter 2022 revenues were also adversely impacted by continuing and increased supply chain disruptions, and COVID-related employee absenteeism, which resulted in approximately $15.3 million of first quarter 2022 revenues being deferred into future periods. First quarter 2022 revenues include a contribution of $14.7 million from the recent acquisitions of Cosmic Advanced Engineered Solutions, Inc. (Cosmic AES) and CTT, Inc., (CTT) offset by the previously reported loss of an international training services contract of approximately $8.3 million.

First quarter 2022 Cash Flow Used in Operations was $7.9 million, including a use for the increase of inventory balances of $15.3 million during the quarter primarily in our satellite and microwave electronic businesses, in anticipation of the ramps in production in the second half of the year and, in part, to advance inventory levels, in an attempt to mitigate the impact of supply chain disruptions. Free Cash Flow Used in Operations was $18.7 million, after funding $10.8 million of capital expenditures, including in our high growth Unmanned Systems, Space, Satellite and Cyber and Turbine Technologies business areas.

For the first quarter of 2022, Kratos’ Unmanned Systems Segment (KUS) generated Revenues of $52.6 million, as compared to $55.9 million in the first quarter of 2021. KUS Operating Income was $0.5 million in the first quarter of 2022, compared to $4.2 million in the first quarter of 2021, reflecting a less favorable mix of revenues, including an increase in development programs which typically generate lower margins, an increase in SG&A costs of approximately $1.1 million, an increase of R&D expenses of approximately $1.2 million and increases in supply chain and employee related costs.

First quarter 2022 KUS Adjusted EBITDA was $3.0 million, compared to first quarter 2021 Adjusted EBITDA of $6.4 million, reflecting increases in certain development programs which typically generate lower margins and increases in SG&A, R&D, supply chain related and headcount costs.
        

KUS’s book-to-bill ratio for the first quarter of 2022 was 0.3 to 1.0 and 1.0 to 1.0 for the last twelve months ended March 27, 2022, with bookings of $236.7 million for the twelve months ended March 27, 2022.   Total backlog for KUS at the end of the first quarter of 2022 was $230.5 million compared to $269.6 million at the end of the fourth quarter of 2021.

For the first quarter of 2022, Kratos’ Government Solutions Segment (KGS) reported Revenues of $143.6 million, compared to Revenues of $138.3 million in the first quarter of 2021. The increased revenues include the contribution of approximately $14.7 million from the recently acquired Cosmic AES and CTT, offset by a reduction of $8.3 million in our Training Solutions business, resulting primarily from the loss of an international training contract, and continued and increased supply chain disruptions, which resulted in first quarter 2022 KGS revenues of approximately $14.6 million being deferred into future periods. KGS reported operating income of $5.6 million in the first quarter of 2022, compared to $7.1 million in the first quarter of 2021, primarily reflecting a less favorable revenue mix and increased costs related to the supply chain and employee base.  

Kratos’ Space, Satellite and Cyber business generated Revenues of $72.5 million in the first quarter of 2022, compared to $58.5 million in the first quarter of 2021. Included in the first quarter 2022 revenues is $12.7 million from the recent Cosmic AES acquisition, offset partially by approximately $7.1 million of supply chain related and other delays, including in the Company’s commercial and international satellite communications business.  

First quarter 2022 KGS Adjusted EBITDA was $10.8 million, compared to first quarter 2021 KGS Adjusted EBITDA of $11.7 million, reflecting a less favorable mix of revenues, the continued and increased impact of supply chain disruptions and increases in supply chain and employee related costs.

For the first quarter of 2022, KGS reported a book-to-bill ratio of 1.3 to 1.0, and a book to bill ratio of 1.1 to 1 for the twelve months ended March 27, 2022.   Included in KGS is Kratos’ Space, Satellite and Cyber business, which reported a book to bill ratio of 1.3 to 1.0 for the first quarter of 2022, and a book to bill ratio of 1.1 to 1.0 for the twelve months ended March 27, 2022. Bookings for the Space, Satellite and Cyber business for the last twelve months ended March 27, 2022 was $313.8 million. KGS’s total backlog at the end of the first quarter of 2022 was $751.6 million, as compared to $684.3 million at the end of the fourth quarter of 2021.

For the first quarter of 2022, Kratos reported consolidated bookings of $198.2 million and a book-to-bill ratio of 1.0 to 1.0, with consolidated bookings of $873.3 million and a book-to-bill ratio of 1.1 to 1.0 for the last twelve months ended March 27, 2022. Backlog on March 27, 2022 was $982.1 million, as compared to $953.9 million at December 26, 2021, and Kratos’ bid and proposal pipeline was $9.4 billion at March 27, 2022, as compared to $9.4 billion at December 26, 2021.   Backlog at March 27, 2022 was comprised of funded backlog of $685.7 million and unfunded backlog of $296.4 million.

Eric DeMarco, Kratos’ President and CEO, said, “Since our last report, the Fiscal 2022 Budget has been approved, including significant funding in space, satellite, cyber, unmanned systems, hypersonics, missile defense, strategic deterrence and microwave electronics, all core Kratos business areas.   The Fiscal 2023 budget request has also been released, also continuing these as priority national security funding areas. We have now received or have been informed that we will receive several large new contracts in our unmanned systems and our satellite business, including our new software based OpenSpace products. The awards will provide us additional visibility into our Q3 and Q4 forecasted revenue, with a significant increase in our forecasted profitability as we expect to achieve operating leverage on our cost infrastructure.”

Mr. DeMarco, continued, “Over the last few months, the Pentagon has continued to clarify its vision for low cost, force multiplying and loyal wingman unmanned aerial drone systems. We continue to be confident that Kratos’ affordable, made in America, high performance jet drones, which are flying today and not power-points, and which are designed to enable fielding of mass, large quantities and runway independence, providing challenges to adversaries and survivability to our forces, are critical differentiators.   We are currently producing approximately 150 jet drone aircraft of various types annually and are ready and able to immediately step up when the customer requires”.

Mr. DeMarco concluded, “We are focused internally, including continuing to win contract awards, expanding our market share, and on program execution and working with our customers contracting offices so that we receive funding as quickly as possible now that the 2022 budget is in place. We are also focused on managing industry wide challenges, including supply chain issues, inflation and increasing costs, COVID related impacts to our customers and employees and obtaining and retaining qualified personnel, all of which are expected to continue for the foreseeable future.”

Financial Guidance

We are providing our initial second quarter guidance and affirming our full year 2022 guidance as follows:


$M

Q222

FY22


Revenues

$205 – $215

$880 – $920


R&D

$9 – $10

$35 – $38


Operating Income (loss)

$(3) – $0

$26 – $30


Depreciation

$5 – $6

$24 – $25


Amortization

$2 – $3

$8 – $9


Stock Based Compensation

$6 – $7

$25 – $26


Adjusted EBITDA

$11 – $14

$85 – $89


Operating Cash Flow


$20 – $30


Capital Expenditures


$50 – $60


Free Cash Flow Use


($30 – $40)


Our second quarter and Fiscal Year 2022 financial guidance we are providing today includes our current forecasted business mix, and our assumptions related to the expected impact of continued employee absenteeism and retention, manufacturing, production and supply chain disruptions, parts shortages and related price increases in materials and components, travel restrictions and other COVID-19 related items that have and continue to impact the industry and Kratos.  

Throughout the first quarter of 2022, we experienced a significant increase in the intensity and effects of COVID–19, including the new Omicron variant, on our employees, consultants, vendors, suppliers, customers, etc. We have assumed that these COVID–19 related impacts to our business, which significantly impacted our fiscal first quarter 2022 and continue to impact our second quarter, will begin to subside by the third fiscal quarter, and continue to improve throughout the second half of our fiscal year 2022. Our assumption of an improving COVID-19 and supply chain related environment in the second half of the year, combined with we now have a Fiscal 2022 DoD budget and that the FY 2023 DoD budget request has been submitted, are directly related to our 2022 financial forecast and potential investment decisions. Additionally, we have recently received or been informed that we will receive certain large program awards, including in our Unmanned Systems and Satellite business, which directly relates to our forecasted 2022 quarter over quarter financial forecast improvement, including Kratos’ expectation that its financial performance in the second half of 2022 will be substantially greater than the first half.
  

We currently estimate that COVID-related issues, including the availability and increased costs of certain raw materials and related components and materials, a lack of capacity at mills supporting Kratos’ hardware programs, and the availability of an experienced skilled workforce to impact our second quarter 2022 Revenues and Adjusted EBITDA by approximately $15 to $17 million and $2 to $4 million, respectively, similar to the impact that we experienced on our first quarter 2022 Revenues and Adjusted EBITDA. We also currently estimate these issues to impact our fiscal year 2022 Revenues and Adjusted EBITDA by approximately $34 to $38 million and $7 to $10 million, respectively. We will provide future updates as appropriate. Also included in our fiscal year 2022 estimated Adjusted EBITDA are additional incremental merit increases of approximately $5 million above our historical merit increase levels. These increases were recently implemented to retain our highly skilled workforce amidst a very tight and competitive labor market.

The forecasted financial trajectory in the second half of 2022 reflects the expected mix of revenues, including the expected timing of software product deliveries in our Space, Satellite and Cyber business, based upon the forecasted order flow and roll out of our new OpenSpace solution, and contract awards we have recently received or that we have been informed we will receive.  

Forecasted second quarter 2022 and fiscal year 2022 Operating Income and Adjusted EBITDA, also reflect the expected mix of development-type contracts and expected investments, including in our Space, Satellite and Cyber, Unmanned Systems, C5ISR, Turbine Technologies and Rocket System businesses, where we have received, informed that we will receive, or are pursuing or expect to receive a number of new contract awards.   Kratos’ fiscal year 2022 forecasted revenues also include the final impact of the 2021 loss of a large international training contract, which contributed approximately $13.0 million to the Company’s fiscal year 2021 first and second quarter revenues and include the estimated contribution from the recently closed CTT and Cosmic AES acquisitions.

Management will discuss the Company’s first quarter 2022 financial results, as well as its second quarter and full year 2022 guidance on a conference call beginning at 2:00 p.m. Pacific (5:00 p.m. Eastern) today. The conference call can be accessed by dialing (866) 374-5140, and referencing the call by ID number 69056240. The conference call will be broadcast live in listen-only mode on the company’s investor relations website at https://ir.kratosdefense.com/events-presentations. A replay of the webcast will be available on the Kratos web site approximately two hours after the conclusion of the conference call.

About Kratos
Defense & Security Solutions

Kratos Defense & Security Solutions, Inc. (NASDAQ:KTOS) develops and fields transformative, affordable technology, platforms, and systems for United States National Security related customers, allies, and commercial enterprises.  Kratos is changing the way breakthrough technologies for these industries are rapidly brought to market through proven commercial and venture capital backed approaches, including proactive research, and streamlined development processes.  At Kratos, affordability is a technology, and we specialize in unmanned systems, satellite communications, cyber security/warfare, microwave electronics, missile defense, hypersonic systems, training and combat systems and next generation turbo jet and turbo fan engine development. For more information go to www.kratosdefense.com.

Notice Regarding Forward-Looking Statements
This news release contains certain forward-looking statements that involve risks and uncertainties, including, without limitation, express or implied statements concerning the Company’s expectations regarding its future financial performance, including the Company’s expectations for its second quarter and full year 2022 revenues, R&D, operating income, depreciation, amortization, stock based compensation expense, and Adjusted EBITDA, and full year 2022 operating cash flow, capital expenditures and other investments, and free cash flow use, the Company’s future growth trajectory and ability to achieve improved revenue mix and profit in certain of its business segments and the expected timing of such improved revenue mix and profit, the Company’s expectation of ramp on projects and that investments in its business will result in an increase in the Company’s market share and total addressable market and position the Company for significant future organic growth, profitability, cash flow and an increase in shareholder value, the Company’s bid and proposal pipeline, demand for its products and services, including the Company’s alignment with today’s National Security requirements, ability to successfully compete in the tactical unmanned aerial system area and expected new customer awards, including the magnitude and timing of funding and the future opportunity associated with such awards, and expected contract awards related to the Company’s Skyborg Vanguard program and other new tactical unmanned programs, performance of key contracts and programs, including the timing of production and demonstration related to certain of the Company’s contracts and product offerings, the impact of the Company’s restructuring efforts and cost reduction measures, including its ability to improve profitability and cash flow in certain business units as a result of these actions and to achieve financial leverage on fixed administrative costs, benefits to be realized from the Company’s net operating loss carry forwards, the availability and timing of government funding for the Company’s offerings, including the strength of the future funding environment, the short-term delays that may occur as a result of Continuing Resolutions or delays in DoD budget approvals, timing of LRIP and full rate production related to the Company’s unmanned aerial target system offerings, as well as the level of recurring revenues expected to be generated by these programs once they achieve full rate production, market and industry developments, and the current estimated impact of COVID-19 and employee absenteeism, supply chain disruptions, availability of an experienced skilled workforce, inflation and increased costs, and delays on our financial projections, industry, business and operations, including projected growth. Such statements are only predictions, and the Company’s actual results may differ materially from the results expressed or implied by these statements. Investors are cautioned not to place undue reliance on any such forward-looking statements. All such forward-looking statements speak only as of the date they are made, and the Company undertakes no obligation to update or revise these statements, whether as a result of new information, future events or otherwise. Factors that may cause the Company’s results to differ include, but are not limited to: risks to our business and financial results related to the reductions and other spending constraints imposed on the U.S. Government and our other customers, including as a result of sequestration and extended continuing resolutions, the Federal budget deficit and Federal government shut-downs; risks of adverse regulatory action or litigation; risks associated with debt leverage and cost savings and cash flow improvements expected as a result of the refinancing of our Senior Notes; risks that our cost-cutting initiatives will not provide the anticipated benefits; risks that changes, cutbacks or delays in spending by the U.S. DoD may occur, which could cause delays or cancellations of key government contracts; risks of delays to or the cancellation of our projects as a result of protest actions submitted by our competitors; risks that changes may occur in Federal government (or other applicable) procurement laws, regulations, policies and budgets; risks of the availability of government funding for the Company’s products and services due to performance, cost growth, or other factors, changes in government and customer priorities and requirements (including cost-cutting initiatives, the potential deferral of awards, terminations or reduction of expenditures to respond to the priorities of Congress and the Administration, or budgetary cuts resulting from Congressional committee recommendations or automatic sequestration under the Budget Control Act of 2011, as amended); risks that the UAS and UGS markets do not experience significant growth; risks that products we have developed or will develop will become programs of record; risks that we cannot expand our customer base or that our products do not achieve broad acceptance which could impact our ability to achieve our anticipated level of growth; risks of increases in the Federal government initiatives related to in-sourcing; risks related to security breaches, including cyber security attacks and threats or other significant disruptions of our information systems, facilities and infrastructures; risks related to our compliance with applicable contracting and procurement laws, regulations and standards; risks related to the new DoD Cybersecurity Maturity Model Certification (CMMC); risks related to contract performance; risks related to failure of our products or services; risks associated with our subcontractors’ or suppliers’ failure to perform their contractual obligations, including the appearance of counterfeit or corrupt parts in our products; changes in the competitive environment (including as a result of bid protests); failure to successfully integrate acquired operations and competition in the marketplace, which could reduce revenues and profit margins; risks that potential future goodwill impairments will adversely affect our operating results; risks that anticipated tax benefits will not be realized in accordance with our expectations; risks that a change in ownership of our stock could cause further limitation to the future utilization of our net operating losses; risks that we may be required to record valuation allowances on our net operating losses which could adversely impact our profitability and financial condition; risks that the current economic environment will adversely impact our business; currently unforeseen risks associated with COVID-19 and risks related to natural disasters or severe weather. These and other risk factors are more fully discussed in the Company’s Annual Report on Form 10-K for the period ended December 26, 2021, and in our other filings made with the Securities and Exchange Commission.

Note
Regarding Use of Non-GAAP Financial Measures and Other Performance Metrics

This news release contains non-GAAP financial measures, including Adjusted earnings per share (computed using income from continuing operations before income taxes, excluding income (loss) from discontinued operations, excluding income (loss) attributable to non-controlling interest, excluding depreciation, amortization of intangible assets, amortization of capitalized contract and development costs, stock-based compensation expense, acquisition and restructuring related items and other, which includes, but is not limited to, legal related items and foreign transaction gains and losses, less the estimated impact to income taxes) and including Adjusted EBITDA (which includes net income (loss) attributable to noncontrolling interest and excludes, among other things, losses and gains from discontinued operations, acquisition and restructuring related items, stock compensation expense, foreign transaction gains and losses, and the associated margin rates). Additional non-GAAP financial measures include Free Cash Flow from Operations computed as Cash Flow from Operations less Capital Expenditures and Adjusted EBITDA related to our KUS and KGS businesses. Kratos believes this information is useful to investors because it provides a basis for measuring the Company’s available capital resources, the actual and forecasted operating performance of the Company’s business and the Company’s cash flow, excluding non-recurring items and non-cash items that would normally be included in the most directly comparable measures calculated and presented in accordance with GAAP. The Company’s management uses these non-GAAP financial measures, along with the most directly comparable GAAP financial measures, in evaluating the Company’s actual and forecasted operating performance, capital resources and cash flow. Non-GAAP financial measures should not be considered in isolation from, or as a substitute for, financial information presented in compliance with GAAP, and investors should carefully evaluate the Company’s financial results calculated in accordance with GAAP and reconciliations to those financial results. In addition, non-GAAP financial measures as reported by the Company may not be comparable to similarly titled amounts reported by other companies. As appropriate, the most directly comparable GAAP financial measures and information reconciling these non-GAAP financial measures to the Company’s financial results prepared in accordance with GAAP are included in this news release.

Another Performance Metric the Company believes is a key performance indicator in our industry is our Book to Bill Ratio as it provides investors with a measure of the amount of bookings or contract awards as compared to the amount of revenues that have been recorded during the period, and provides an indicator of how much of the Company’s backlog is being burned or utilized in a certain period. The Book to Bill Ratio is computed as the number of bookings or contract awards in the period divided by the revenues recorded for the same period. The Company believes that the rolling or last twelve months’ Book to Bill Ratio is meaningful since the timing of quarter-to-quarter bookings can vary.

Press
Contact:

Yolanda White
858-812-7302 Direct

Investor
Information:

877-934-4687

investor@kratosdefense.com 

Kratos Defense & Security Solutions, Inc.


Unaudited Condensed Consolidated Statements of Operations


(in millions, except per share data)


Three Months Ended


March 27,


March 28,


2022


2021


Service revenues


$

67.9


$

57.3


Product sales


128.3


136.9


Total revenues


196.2


194.2


Cost of service revenues


49.9


42.5


Cost of product sales


94.4


100.7


Total costs


144.3


143.2


Gross profit – service revenues


18.0


14.8


Gross profit – product sales


33.9


36.2


     Total gross profit


51.9


51.0


Selling, general and administrative expenses


40.3


35.3


Acquisition and restructuring related items


0.6


0.2


Research and development expenses


9.2


8.0


Depreciation


1.3


1.2


Amortization of intangible assets


1.7


1.4


     Operating income (loss)


(1.2

)


4.9


Interest expense, net


(5.9

)


(5.9

)


Loss on extinguishment of debt


(13.0

)


Other income, net


0.1


0.2


Loss from continuing operations before income taxes


(20.0

)


(0.8

)


Benefit for income taxes from continuing operations


(4.3

)


(2.7

)


Income (loss) from continuing operations


(15.7

)


1.9


Loss from discontinued operations, net of income taxes


(0.2

)


     Net income (loss)


(15.9

)


1.9


     Less: Net income (loss) attributable to noncontrolling interest


     Net income (loss) attributable to Kratos


$

(15.9

)


$

1.9


Basic income (loss) per common share attributable to Kratos:


     Income (loss) from continuing operations


$

(0.12

)


$

0.02


     Loss from discontinued operations


     Net income (loss)


$

(0.12

)


$

0.02


Diluted income (loss) per common share attributable to Kratos:


     Income (loss) from continuing operations


$

(0.12

)


$

0.01


     Loss from discontinued operations


     Net income (loss)


$

(0.12

)


$

0.01


Weighted average common shares outstanding:


     Basic weighted average common shares outstanding


125.9


124.1


     Diluted weighted average common shares outstanding


125.9


127.7


Adjusted EBITDA (1)


$

13.8


$

18.1


Unaudited Reconciliation of GAAP
to Non-GAAP Measures


Note: (1) Adjusted EBITDA is a non-GAAP measure defined as GAAP net income (loss) attributable to Kratos adjusted for net income (loss) attributable to noncontrolling interest, income (loss) from discontinued operations, net interest expense, provision for income taxes, depreciation and amortization expense of intangible assets, amortization of capitalized contract and development costs, stock-based compensation, acquisition and restructuring related items and other, and foreign transaction gain (loss).    


Adjusted EBITDA as calculated by us may be calculated differently than Adjusted EBITDA for other companies. We have provided Adjusted EBITDA because we believe it is a commonly used measure of financial performance in comparable companies and is provided to help investors evaluate companies on a consistent basis, as well as to enhance understanding of our operating results. Adjusted EBITDA should not be construed as either an alternative to net income or as an indicator of our operating performance or an alternative to cash flows as a measure of liquidity. The adjustments to calculate this non-GAAP financial measure and the basis for such adjustments are outlined below. Please refer to the following table below that reconciles GAAP net income (loss) to Adjusted EBITDA.       


The adjustments to calculate this non-GAAP financial measure, and the basis for such adjustments, are outlined below:


Interest income and interest
expense, net. 
The Company receives interest income on investments and incurs interest expense on loans, capital leases and other financing arrangements, including the amortization of issue discounts and deferred financing costs. These amounts may vary from period to period due to changes in cash and debt balances.           


Income taxes. The Company’s tax expense can fluctuate materially from period to period due to tax adjustments that may not be directly related to underlying operating performance or to the current period of operations and may not necessarily reflect the impact of utilization of our NOLs.


Depreciation. The Company incurs depreciation expense (recorded in cost of revenues and in operating expenses) related to capital assets purchased, leased or constructed to support the ongoing operations of the business. The assets are recorded at cost or fair value and are depreciated over the estimated useful lives of individual assets.           


Amortization of intangible
assets. 
The Company incurs amortization of intangible expense related to acquisitions it has made. These intangible assets are valued at the time of acquisition and are amortized over the estimated useful lives.


Amortization of capitalized
contract and development costs. 
The Company incurs amortization of previously capitalized software development and non-recurring engineering costs related to certain targets in its Unmanned Systems and ballistic missile target businesses as these units are sold.


Stock-based compensation
expense. 
The Company incurs expense related to stock-based compensation included in its GAAP presentation of selling, general and administrative expense. Although stock-based compensation is an expense of the Company and viewed as a form of compensation, these expenses vary in amount from period to period, and are affected by market forces that are difficult to predict and are not within the control of management, such as the market price and volatility of the Company’s shares, risk-free interest rates and the expected term and forfeiture rates of the awards. Management believes that exclusion of these expenses allows comparison of operating results to those of other companies that disclose non-GAAP financial measures that exclude stock-based compensation.     


Foreign transaction (gain)
loss. 
The Company incurs transaction gains and losses related to transactions with foreign customers in currencies other than the U.S. dollar. In addition, certain intercompany transactions can give rise to realized and unrealized foreign currency gains and losses.


Acquisition and transaction
related items. 
The Company incurs transaction related costs, such as legal and accounting fees and other expenses, related to acquisitions and divestiture activities. Management believes these items are outside the normal operations of the Company’s business and are not indicative of ongoing operating results.


Restructuring costs. The Company incurs restructuring costs for cost reduction actions which include employee termination costs, facility shut-down related costs and remaining lease commitment costs for excess or exited facilities. Management believes that these costs are not indicative of ongoing operating results as they are either non-recurring and/or not expected when full capacity and volumes are achieved.


Legal related items. The Company incurs costs related to pending legal settlements and other legal related matters. Management believes these items are outside the normal operations of the Company’s business and are not indicative of ongoing operating results.


Adjusted EBITDA is a non-GAAP financial measure and should not be considered in isolation or as a substitute for financial information provided in accordance with GAAP. This non-GAAP financial measure may not be computed in the same manner as similarly titled measures used by other companies. The Company expects to continue to incur expenses similar to the Adjusted EBITDA financial adjustments described above, and investors should not infer from the Company’s presentation of this non-GAAP financial measure that these costs are unusual, infrequent, or non-recurring.


Reconciliation of Net income (loss) attributable to Kratos to Adjusted EBITDA is as follows:


Three Months Ended


March 27,


March 28,


2022


2021


Net income (loss) attributable to Kratos


$

(15.9

)


$

1.9


Loss from discontinued operations, net of income taxes


0.2


Interest expense, net


5.9


5.9


Loss on extinguishment of debt


13.0


Benefit for income taxes from continuing operations


(4.3

)


(2.7

)


Depreciation (including cost of service revenues and product sales)


5.3


4.9


Stock-based compensation


7.0


6.2


Foreign transaction loss


0.1


Amortization of intangible assets


1.7


1.4


Amortization of capitalized contract and development costs


0.3


0.2


Acquisition and restructuring related items and other


0.6


0.2


Plus: Net income (loss) attributable to noncontrolling interest


Adjusted EBITDA


$

13.8


$

18.1


Reconciliation of acquisition and restructuring related items and other included in Adjusted EBITDA:


Three Months Ended


March 27,


March 28,


2022


2021


Acquisition and transaction related items


$

0.3


$

0.2


Restructuring costs


0.1


Legal related items


0.2


$

0.6


$

0.2


Kratos Defense & Security Solutions, Inc.


Unaudited Segment Data


(in millions)


Three Months Ended


March 27,


March 28,


2022


2021


Revenues:


Unmanned Systems


$

52.6


$

55.9


Kratos Government Solutions


143.6


138.3


Total revenues


$

196.2


$

194.2


Operating income (loss)


Unmanned Systems


$

0.5


$

4.2


Kratos Government Solutions


5.6


7.1


Unallocated corporate expense, net


(7.3

)


(6.4

)


Total operating income (loss)


$

(1.2

)


$

4.9


Note: Unallocated corporate expense, net includes costs for certain stock-based compensation programs (including stock-based compensation costs for stock options, employee stock purchase plan and restricted stock units), the effects of items not considered part of management’s evaluation of segment operating performance, and acquisition and restructuring related items, corporate costs not allocated to the segments, legal related items, and other miscellaneous corporate activities.


Reconciliation of Segment Operating Income to Adjusted EBITDA is as follows:


Three Months Ended


March 27,


March 28,


2022


2021


Unmanned Systems


Operating income


$

0.5


$

4.2


Other income


0.1


0.1


Depreciation


1.6


1.6


Amortization of intangible assets


0.3


0.3


Amortization of capitalized contract and development costs


0.3


0.2


Acquisition and restructuring related items and other


0.2


Adjusted EBITDA


$

3.0


$

6.4


% of revenue


5.7

%


11.4

%


Kratos Government Solutions


Operating income


$

5.6


$

7.1


Other income


0.2


Depreciation


3.7


3.3


Amortization of intangible assets


1.4


1.1


Acquisition and restructuring related items and other


0.1


Adjusted EBITDA


$

10.8


$

11.7


% of revenue


7.5

%


8.5

%


Total Adjusted EBITDA


$

13.8


$

18.1


% of revenue


7.0

%


9.3

%


Kratos Defense & Security Solutions, Inc.


Unaudited Condensed Consolidated Balance Sheets


(in millions)


March 27,


December 26,


2022


2021


Assets


Current assets:


Cash and cash equivalents


$

254.4


$

349.4


Accounts receivable, net


280.7


284.7


Inventoried costs


107.1


91.7


Prepaid expenses


11.1


9.8


Other current assets


34.6


22.5


Total current assets


687.9


758.1


Property, plant and equipment, net


173.5


168.3


Operating lease right-of-use assets


39.6


38.5


Goodwill


522.9


493.9


Intangible assets, net


51.5


43.2


Other assets


90.1


87.5


Total assets


$

1,565.5


$

1,589.5


Liabilities and Stockholders’
Equity


Current liabilities:


Accounts payable


$

51.7


$

50.4


Accrued expenses


34.2


27.2


Accrued compensation


56.7


47.3


Accrued interest


0.2


1.5


Billings in excess of costs and earnings on uncompleted contracts


49.7


58.1


Current portion of operating lease liabilities


10.5


10.1


Other current liabilities


9.2


25.7


Other current liabilities of discontinued operations


1.1


0.8


Total current liabilities


213.3


221.1


Long-term debt


295.0


296.7


Operating lease liabilities, net of current portion


33.3


32.7


Other long-term liabilities


73.9


76.2


Other long-term liabilities of discontinued operations


2.5


2.5


Total liabilities


618.0


629.2


Commitments and contingencies


Redeemable noncontrolling interest


15.2


15.2


Stockholders’ equity:


Additional paid-in capital


1,582.0


1,578.9


Accumulated other comprehensive loss


0.6


0.6


Accumulated deficit


(650.3

)


(634.4

)


Total Kratos stockholders’ equity


932.3


945.1


Total liabilities and stockholders’ equity


$

1,565.5


$

1,589.5


Kratos Defense & Security Solutions, Inc.


Unaudited Condensed Consolidated Statements of Cash Flows


(in millions)


Three Months Ended


March 27,


March 28,


2022


2021


Operating activities:


Net income (loss)


$

(15.9

)


$

1.9


Less: loss from discontinued operations


(0.2

)


Income (loss) from continuing operations


(15.7

)


1.9


Adjustments to reconcile income (loss) from continuing operations to net cash provided by (used in) operating activities from continuing operations:


Depreciation and amortization


7.0


6.3


Amortization of lease right-of-use assets


2.6


2.2


Deferred income taxes


0.1


Stock-based compensation


7.0


6.2


Amortization of deferred financing costs


0.3


0.2


Loss on extinguishment of debt


13.0


Provision for (recovery of) doubtful accounts


(0.1

)


Changes in assets and liabilities, net of acquisitions:


Accounts receivable


31.9


9.8


Unbilled receivables


(19.8

)


(1.8

)


Inventoried costs


(15.3

)


(4.2

)


Prepaid expenses and other assets


(9.5

)


(2.0

)


Operating lease liabilities


(2.7

)


(2.2

)


Accounts payable


1.3


(2.0

)


Accrued compensation


5.6


6.2


Accrued expenses


6.1


(2.7

)


Accrued interest


(1.3

)


4.9


Billings in excess of costs and earnings on uncompleted contracts


(8.3

)


7.1


Income tax receivable and payable


(4.9

)


(2.2

)


Other liabilities


(5.2

)


(5.0

)


Net cash provided by (used in) operating activities from continuing operations


(7.9

)


22.7


Investing activities:


Cash paid for acquisitions, net of cash acquired


(58.5

)


(5.1

)


Capital expenditures


(10.8

)


(9.6

)


Net cash used in investing activities from continuing operations


(69.3

)


(14.7

)


Financing activities:


Proceeds from the issuance of long-term debt


200.0


Repayment of debt


(309.8

)


Debt issuance costs


(3.2

)


Credit agreement borrowings


100.0


Payment under finance leases


(0.3

)


(0.2

)


Payments of employee taxes withheld from share-based awards


(6.8

)


(7.1

)


Proceeds from shares issued under equity plans


2.9


2.5


Net cash used in financing activities from continuing operations


(17.2

)


(4.8

)


Net cash flows from continuing operations


(94.4

)


3.2


   Net operating cash flows of discontinued operations


0.1


(0.5

)


Effect of exchange rate changes on cash and cash equivalents


(0.7

)


(0.6

)


Net increase (decrease) in cash, cash equivalents and restricted cash


(95.0

)


2.1


Cash, cash equivalents and restricted cash at beginning of period


349.4


381.5


Cash, cash equivalents and restricted cash at end of period


$

254.4


$

383.6


Kratos Defense & Security Solutions, Inc.


Unaudited Non-GAAP Measures


Computation of Adjusted Earnings Per Share


(in millions, except per share data)


Adjusted income from continuing operations and adjusted income from continuing operations per diluted common share (Adjusted EPS) are non-GAAP measures for reporting financial performance and exclude the impact of certain items and, therefore, have not been calculated in accordance with GAAP. Management believes that exclusion of these items assists in providing a more complete understanding of the Company’s underlying continuing operations results and trends and allows for comparability with our peer company index and industry. The Company uses these measures along with the corresponding GAAP financial measures to manage the Company’s business and to evaluate its performance compared to prior periods and the marketplace. The Company defines adjusted income from continuing operations before amortization of intangible assets, depreciation, stock-based compensation, foreign transaction gain/loss, and acquisition and restructuring related items and other. The estimated impact to income taxes includes the impact to the effective tax rate, current tax provision and deferred tax provision, and excludes the impact of discrete items, including transaction related expenses and release of valuation allowance, or benefit related to the add-backs.* Adjusted EPS reflects adjusted income on a per share basis using weighted average diluted shares outstanding.          


The following table reconciles the most directly comparable GAAP financial measures to the non-GAAP financial measures.


Three Months Ended


March 27,


March 28,


2022


2021


Net income (loss) attributable to
Kratos


$

(15.9

)


$

1.9


Less: GAAP benefit for income taxes


(4.3

)


(2.7

)


Less: Net income (loss) attributable to noncontrolling interest


Less: Loss from discontinued operations, net of income taxes


0.2


Loss from continuing operations
before taxes


(20.0

)


(0.8

)


Add: Amortization of intangible assets


1.7


1.4


Add: Amortization of capitalized contract and development costs


0.3


0.2


Add: Depreciation


5.3


4.9


Add: Stock-based compensation


7.0


6.2


Add: Loss on extinguishment of debt


13.0


Add: Foreign transaction loss


0.1


Add: Acquisition and restructuring related items and other


0.6


0.2


   Non-GAAP
Adjusted income from continuing operations before income taxes


7.9


12.2


Income taxes on Non-GAAP measure Adjusted income from continuing operations*


2.8


4.5


   Non-GAAP
Adjusted net income


$

5.1


$

7.7


Diluted earnings per common share


$

(0.12

)


$

0.01


Less: GAAP benefit for income taxes


(0.03

)


(0.02

)


Less: Net income (loss) attributable to noncontrolling interest


Less: Loss from discontinued operations, net of income taxes


Add: Amortization of intangible assets


0.01


0.01


Add: Amortization of capitalized contract and development costs


Add: Depreciation


0.04


0.04


Add: Stock-based compensation


0.06


0.05


Add: Loss on extinguishment of debt


0.10


Add: Foreign transaction loss


Add: Acquisition and restructuring related items and other


Income taxes on Non-GAAP measure Adjusted income from continuing operations*


(0.02

)


(0.03

)


Adjusted income from continuing
operations per diluted common share


$

0.04


$

0.06


Weighted average diluted common
shares outstanding


125.9


127.7


*The impact to income taxes is calculated by recasting income before income taxes to include the add-backs involved in determining Adjusted income from continuing operations before income taxes and recalculating the income tax provision (benefit), including current and deferred income taxes, using the Adjusted income from continuing operations before income taxes. The recalculation also adjusts for any discrete tax expense, including transaction related expenses and the release of valuation allowance, or benefit related to the add-backs.        


Source: Kratos Defense & Security Solutions, Inc.

Release – Cypress Development Completes Enertopia Asset Acquisition


Cypress Development Completes Enertopia Asset Acquisition

Research, News, and Market Data on Cypress Development

VANCOUVER, BC, May 5, 2022 /PRNewswire/ – Cypress Development Corp. (TSXV: CYP) (OTCQX: CYDVF) (Frankfurt: C1Z1) (“Cypress” or “the Company”) is pleased to announce that it has completed its acquisition of Enertopia Corporation’s (“Enertopia”) Clayton Valley Lithium Claystone Project (“Enertopia Project”) located adjacent to the Cypress Clayton Valley Lithium Project in Nevada (“Cypress Project”).

“We are pleased with the addition of Enertopia’s property,” commented Dr. Bill Willoughby, President, and CEO of Cypress. “The property is a continuation of the lithium-bearing units in Cypress’ project, with Enertopia’s drilling having shown similar values of lithium. With this consolidation, the data will be incorporated into our resource model and has the potential to enhance the project through our Feasibility Study underway. We expect this consolidation of Clayton Valley lithium claystone projects to be of significant value for both Enertopia and Cypress shareholders.”

The purchase consideration for the Enertopia Project comprised US$1.1 million in cash and the issuance of 3,000,000 common shares in the capital of Cypress (“Consideration Shares”). The transaction also included Enertopia entering into an Irrevocable Proxy and Voting Agreement and Lock-Up Agreement with Cypress in relation to the Consideration Shares. (See Company’s February 24, 2022 new release for further information).  In terms of these agreements, Enertopia inter alia agreed to; (i) vote in favor of shareholder resolutions supported by Cypress’ Board of Directors (ii) certain limitations to the circumstances under which it could sell the Consideration Shares, and (iii) a 12-month standstill in relation to certain corporate activities pertaining to Cypress shares.

In connection with the transaction, the Company has agreed to pay a finder’s fee of US$105,000 to an arm’s-length party, subject to TSX Venture Exchange approval.

About Cypress Development Corp

Cypress Development Corp. is a Canadian based advanced stage lithium company, focused on developing its 100%-owned Clayton Valley Lithium Project in Nevada, USA. Cypress is in the pilot stage of testing on material from its lithium-bearing claystone deposit and progressing towards completing a Feasibility Study and permitting, with the goal of becoming a domestic producer of lithium for the growing electric vehicle and battery storage market.

ON BEHALF OF CYPRESS DEVELOPMENT CORP.

WILLIAM WILLOUGHBY, PhD., PE

President & Chief Executive Officer

NEITHER THE TSX VENTURE EXCHANGE NOR ITS REGULATION SERVICES PROVIDER ACCEPTS RESPONSIBILITY FOR THE ADEQUACY OR ACCURACY OF THE CONTENT OF THIS NEWS RELEASE.

Cautionary Note Regarding Forward-Looking
Statements

This release includes
certain statements that may be deemed to be “forward-looking
statements”. Forward-looking statements are subject to risks,
uncertainties and assumptions and are identified by words such as 
expects,”
“estimates,” “projects,” “anticipates,”
“believes,” “could,” “scheduled,” and other
similar words. All statements in this release, other than statements of
historical facts, that address events or developments that management of the
Company expects, are forward-looking statements. Although management believes
the expectations expressed in such forward-looking statements are based on
reasonable assumptions, such statements are not guarantees of future
performance, and actual results or developments may differ materially from
those in the forward-looking statements. The Company undertakes no obligation
to update these forward-looking statements if management’s beliefs, estimates
or opinions, or other factors, should change. Factors that could cause actual
results to differ materially from those in forward-looking statements, include
market prices, exploration, and development successes, continued availability
of capital and financing, and general economic, market or business conditions.
Please see the public filings of the Company at 
www.sedar.com for
further information.

SOURCE Cypress Development Corp.