CoreCivic, Inc. (CXW) – Headwinds Lead to Miss but Still See Upside

Monday, May 09, 2022

CoreCivic, Inc. (CXW)
Headwinds Lead to Miss but Still See Upside

CoreCivic is a diversified, government-solutions company with the scale and experience needed to solve tough government challenges in flexible, cost-effective ways. We provide a broad range of solutions to government partners that serve the public good through high-quality corrections and detention management, a network of residential and non-residential alternatives to incarceration to help address America’s recidivism crisis, and government real estate solutions. We are the nation’s largest owner of partnership correctional, detention and residential reentry facilities, and believe we are the largest private owner of real estate used by government agencies in the United States. We have been a flexible and dependable partner for government for nearly 40 years. Our employees are driven by a deep sense of service, high standards of professionalism and a responsibility to help government better the public good. Learn more at www.corecivic.com.

Joe Gomes, Senior Research Analyst, Noble Capital Markets, Inc.

Joshua Zoepfel, Research Associate, Noble Capital Markets, Inc.

Refer to the full report for the price target, fundamental analysis, and rating.

Behind the Miss. There were a number of items with the most significant being the La Palma transition, both the cost of implementing the transition as well as a faster drawn down of the existing ICE population than was anticipated, and a challenging labor market where CoreCivic has implemented above average wage increases.

But Significant Upside Potential. Due to the COVID regulations, CoreCivic’s occupancy levels remain well below historical norms. A return to pre-COVID occupancy levels, or about an additional 8,000 detainees, could add some $40-$50 million to EBITDA. Given the expectations for a border surge once Title 42 is lifted, we do not think this is a stretch….

This Company Sponsored Research is provided by Noble Capital Markets, Inc., a FINRA and S.E.C. registered broker-dealer (B/D).

*Analyst certification and important disclosures included in the full report. NOTE: investment decisions should not be based upon the content of this research summary. Proper due diligence is required before making any investment decision. 

Eagle Bulk Shipping (EGLE) – Quarterly Results In Line With Expectations

Monday, May 09, 2022

Eagle Bulk Shipping (EGLE)
Quarterly Results In Line With Expectations

Eagle Bulk Shipping Inc. (“Eagle”) is a US-based drybulk owner-operator focused on the Supramax/Ultramax mid-size asset class, which ranges from 50,000 and 65,000 deadweight tons in size; these vessels are equipped with onboard cranes allowing for the self-loading and unloading of cargoes, a feature which distinguishes them from the larger classes of drybulk vessels and provides for greatly enhanced flexibility and versatility- both with respect to cargo diversity and port accessibility. The Company transports a broad range of major and minor bulk cargoes around the world, including coal, grain, ore, pet coke, cement, and fertilizer. Eagle operates out of three offices, Stamford (headquarters), Singapore, and Hamburg, and performs all aspects of vessel management in-house including: commercial, operational, technical, and strategic.

Michael Heim, CFA, Senior Research Analyst, Noble Capital Markets, Inc.

Refer to the full report for the price target, fundamental analysis, and rating.

Eagle Bulk Shipping reported 2022-1Q results generally in line with expectations. Revenues, net were $184.4 million versus $93.4 million for the same period last year and in line with our $182.4 million estimate. Adjusted EBITDA (excluding unrealized derivative value changes) was $85.0 million versus our $88.1 million estimate. Adjusted net income was $64.5 million ($3.97 per diluted share) versus $9.3 million ($0.80) last year and in line with our estimate of $64.3 million ($4.00). The consensus analyst estimate was $3.97.

Charter rates are high. The company achieved a TCE rate of $27,407/day in the quarter, benefitting from a sharp run up in shipping rates last fall. Eagle is well protected against any decline in rates having locked in 83% of available days fixed at an average TCE rate of $29,300. CEO Gary Vogel indicated that “the demand growth for minor bulks remains healthy and continues to outpace demand for the broader drybulk market.” Disruptions caused by the war in Ukraine have resulted in longer voyage distances and higher rates….

This Research is provided by Noble Capital Markets, Inc., a FINRA and S.E.C. registered broker-dealer (B/D).

*Analyst certification and important disclosures included in the full report. NOTE: investment decisions should not be based upon the content of this research summary. Proper due diligence is required before making any investment decision. 

E.W. Scripps (SSP) – Why We Are Raising Full Year 2022 Estimates

Monday, May 09, 2022

E.W. Scripps (SSP)
Why We Are Raising Full Year 2022 Estimates

The E.W. Scripps Company (NASDAQ: SSP) is a diversified media company focused on creating a better-informed world. As one of the nation’s largest local TV broadcasters, Scripps serves communities with quality, objective local journalism and operates a portfolio of 61 stations in 41 markets. The Scripps Networks reach nearly every American through the national news outlets Court TV and Newsy and popular entertainment brands ION, Bounce, Defy TV, Grit, ION Mystery, Laff and TrueReal. Scripps is the nation’s largest holder of broadcast spectrum. Scripps runs an award-winning investigative reporting newsroom in Washington, D.C., and is the longtime steward of the Scripps National Spelling Bee. Founded in 1878, Scripps has held for decades to the motto, “Give light and the people will find their own way.”

Michael Kupinski, Director of Research, Noble Capital Markets, Inc.

Refer to the full report for the price target, fundamental analysis, and rating.

Q1 exceeds expectations. First quarter results were better than expected on both the top line and cash flow. Total company revenues increased 4.6% to $565.7 million, 1.3% better than our $558.5 million estimate. Adj. EBITDA was $124.5 million, 16% better than our $107.5 million estimate. The variance on the revenue was due to stronger than expected core advertising, beating our estimate by 1.5% and better revenues in its Networks business, beating our estimate by 1.9%. 

Q2 guidance lower than expected. We are raising our total company revenue estimate from $596.0 million to $603.0 million. Due to the higher than expected costs in its Network segment, we are lowering our adj. EBITDA estimate from $167.4 million to $139.3 million. The Q2 adjustment took away the Q1 upside variance in Adj. EBITDA. …

This Research is provided by Noble Capital Markets, Inc., a FINRA and S.E.C. registered broker-dealer (B/D).

*Analyst certification and important disclosures included in the full report. NOTE: investment decisions should not be based upon the content of this research summary. Proper due diligence is required before making any investment decision. 

Diamond Supply Pressures Could Benefit Public Mining Companies


Image Credit: Kim Alaniz (Flickr)


Will Reduced Diamond Production in Europe Bode Well for Producers Elsewhere?

They say that if the economy is faltering that you should invest in hard assets, or companies that produce them. Hard asset investing can include commodities like gold, silver, and platinum with value extending to equities of producers of these durable metals. It may also include collectibles like fine art and diamonds and other gemstones. In the case of diamonds, the axiom extends to producers (mining companies) as well.

Diamond Supply Side Down

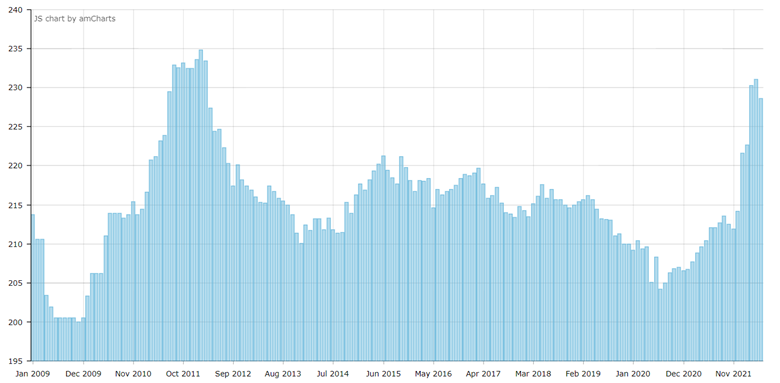
Demand for diamonds did not dip during the pandemic, sales just moved from brick and mortar to online purchases. So the pace remained consistent, which is usuall at about the same pace they are consumed. Diamonds are scarce, so by definition, supply is typically tight. But, the recent Russia/Ukraine issues have had an impact since 30-35% of the worlds diamonds that once were sold out of Russia are off now limits. 


Diamond Price Index (DPI) provided by diamondse.info, June 2009 – May 2022

Taking up the Slack

With demand remaining consistent at 130 million carats per year and supply being significantly pinched, those able to supply diamonds stand to fare much better than other years since the unmet need for diamonds from non-conflict areas is likely to be much stronger as a result.

When people in North America think of diamond mining, they usually think of South Africa, not Europe. The impact of what is going on in Europe is not interrupting operations in South Africa’s ability to add new diamonds to market.

One junior diamond mining company which has a well-established prior operational and production history in South Africa, extensive prior experience supplying rough diamonds to the world market, and a long-established alliance with Tiffany & Co., DeBeers, and others is Diamcor Mining Inc. (DMIFF,
DMI:CA
).

Diamcor’s focus is on idetification, acquisition, and operation of diamond projects with near term production potential. This allows this company to avoid the high risks and costs associated with traditional exploration.

In a video from the recent NobleCon18, Dean Taylor, CEO of Diamcor Mining discussed that his company is production-focused, bringing supply of raw diamonds to sellers. In addition to having a strategic alliance with Tiffany’s the retailer is also a shareholder of the company.

To gain deeper understanding of the supply factors impacting world diamond production and partnerships, as well as Diamcor’s business specifically and value, watch the video here

Take-Away

As we have seen with other industries that impact our everyday life at the grocery store, gas stations, and elsewhere, geopolitical events have an effect on prices and company earnings. Diamonds and gemstones are not what is being discussed when we chat over the fence with our neighbors, but this may mean that the opportunities have not yet been recognized by the investing masses.

Paul Hoffman

Managing Editor, Channelchek

Suggested Content


Exposure to Non-Travel Leisure Stocks


Can Energy Stocks Continue Their High Octane Performance?


Energy and Global Fundamentals Make a Good Case for Owning Western Uranium Stocks


Diamcor Mining (DMIFF) NobleCon18 Presentation Replay

Sources

https://www.aljazeera.com/economy/2022/5/9/angolas-endiama-says-sanctions-against-russia-could-hurt-its-diamond-operations

http://www.diamcormining.com/investors/diamond-information/

https://www.diamondse.info/diamonds-price-index.asp


Stay up to date. Follow us:


Release – Eagle Bulk Shipping Inc. Publishes 2022 ESG Sustainability Report


Eagle Bulk Shipping Inc. Publishes 2022 ESG Sustainability Report

Research, News, and Market Data on Eagle Bulk Shipping

STAMFORD, Conn., May 09, 2022 (GLOBE NEWSWIRE) — Eagle Bulk Shipping Inc. (Nasdaq: EGLE) (“Eagle Bulk”, “Eagle”, or the “Company”), one of the world’s largest owner-operators within the midsize drybulk segment, today announced the publication of its third annual Environmental, Social, and Governance (ESG) Sustainability Report.

The report, which has been prepared in accordance with the Marine Transportation Framework established by the Sustainability Accounting Standards Board (SASB), provides an overview of Eagle’s strategic priorities and performance with respect to various environmental, social, and governance-related matters.

Gary Vogel, Eagle Bulk’s CEO, commented, “Eagle Bulk advanced a number of important ESG-related initiatives in 2021, which are detailed in our report. We have embedded these initiatives across our company, as demonstrated by the sustainability-linked targets included in the new credit facility we entered into during the fourth quarter of 2021, which allow the Company to decrease its interest rate margin, subject to meeting fleet energy efficiency targets and making investments in decarbonization initiatives. I’m pleased to report that we have met these targets for 2021 and will benefit from a decrease in our margin starting this June, which will step down to 210 basis points over 3-month LIBOR.   Additionally, we improved our fuel efficiency profile by adding nine modern vessels to our fleet and completed our first ever sustainable biofuel voyage, sailing the M/V Sydney Eagle across the Atlantic and reducing the vessel’s net well-to-wake CO2 emissions by ~90% during the voyage.

From a Social perspective, our top priority has been to ensure the health and safety of our employees, both onshore and onboard our vessels. COVID-19 continued to impact our business in 2021. We have had some colleagues deal with illness personally, while others had to cater to family being impacted at home.

More recently, the tragic events taking place in Ukraine have significantly impacted our Ukrainian seafarers, and we are doing what we can to ensure their safety and well-being by providing assistance with temporary housing, transportation, and other needs.”

Eagle’s ESG Sustainability Report can be accessed on the Company’s website at www.eagleships.com/ESG.

CONTACT

Company Contact:
Frank De Costanzo
Chief Financial Officer
Eagle Bulk Shipping Inc.
Tel. +1 203-276-8100
Email: 
investor@eagleships.com

Media:
Rose and Company
Tel. +1 212-359-2228

Source: Eagle Bulk Shipping Inc.


Release – Gevo Reports First Quarter 2022 Financial Results


Gevo Reports First Quarter 2022 Financial Results

Research, News, and Market Data on Gevo

Gevo to Host Conference Call Today at 4:30 p.m. EST/2:30 p.m. MST

ENGLEWOOD, Colo.
May 9, 2022
– Gevo, Inc. (NASDAQ: GEVO) (“Gevo”, the “Company”, “we”, “us” or “our”) today announced financial results for the first quarter of 2022 and recent corporate highlights.

Recent Corporate Highlights

  • On January 31, 2022, Gevo announced that it had begun the process of bringing its dairy manure-based renewable natural gas (“RNG”) project online in northwest Iowa and once this facility has reached steady-state production levels of approximately 355,000 MMBTU, its evaluation period by the California Air Resource Board and the Environmental Protection Agency for Low Carbon Fuel Standard (“LCFS”) and Renewable Identification Number (“RIN”) credits will commence.
  • Our Net-Zero 1 project continues to be on schedule, and we recently received the conditional use permits for the plant and the wind turbines that will help power the project.
  • Verity Tracking continues to develop a proprietary platform based on distributed ledger technology (also known as the “blockchain”) and recently partnered with Farmers’ Edge, a company dedicated to helping farmers track data and improve agricultural decision making, to support development.
  • On March 18, 2022, Gevo signed a “take-or-pay” agreement with British Airways plc to supply 30 million gallons per year of sustainable aviation fuel (“SAF”) over a five-year term.
  • On March 21, 2022, the oneworld® Alliance announced that certain of its members plan to purchase up to 200 million gallons per year of SAF from Gevo over a five-year term expected to commence in 2027.
  • On March 22, 2022, Gevo signed a “take-or-pay” agreement with Delta Air Lines, Inc. to supply 75 million gallons per year of SAF for seven years, replacing the existing agreement signed with Delta in 2019 to purchase 10 million gallons per year.

2022 First Quarter Financial Highlights

  • Ended the quarter with cash, cash equivalents, restricted cash and marketable securities of $429.6 million compared to $475.8 million as of the end of Q4 2021
  • Revenue of $0.2 million for the quarter compared to $0.1 million in Q1 2021
  • Loss from operations of $(16.0) million for the quarter compared to $(9.9) million in Q1 2021
  • Non-GAAP cash EBITDA loss of $(10.3) million for the quarter compared to $(7.8) million in Q1 2021
  • GAAP net loss per share and non-GAAP adjusted net loss per share of $(0.08) for the quarter compared to $(0.05) in Q1 2021


Commenting on the first quarter of 2022 and recent corporate events, Dr. Patrick R. Gruber, Gevo’s Chief Executive Officer, said “We are moving forward with our Net Zero 1 plans in Lake Preston, South Dakota and couldn’t be more pleased with the progress we have made. We look forward to beginning site preparations later this year and construction early next year. We believe we have a world class team in place to manage the development of this first of its kind, Net-Zero plant and the many additional plants that will be needed to produce this valuable fuel. In northwest Iowa, our dairy RNG facility continues its ramp to stable production and I am very proud of how well that team executed to deliver the project on time and within budget. We intend to build many Net-Zero plants over the coming years and we believe we have all the right people in place to get it done.”


First Quarter 2022 Financial Results

During the three months ended March 31, 2022, total revenue was $0.2 million, compared with $0.1 million in the same period in 2021. We sold approximately 35,000 gallons of SAF, isooctane and isooctene from our development facility at Luverne, Minnesota  in first quarter of 2022 compared to nil for the three months ended March 31, 2021 due to the COVID-19 shutdown.

Cost of goods sold was $4.2 million for the three months ended March 31, 2022, compared with $2.0 million in the same period in 2021. The majority of first quarter 2022 cost of goods sold was related to a $2.9 million adjustment made to the Company’s finished goods and work in process inventory to net realizable value with the offset recorded in cost of goods sold.

Selling, general and administrative expense increased by $5.6 million during the three months ended March 31, 2022, compared with the same period in 2021, due primarily to increases in personnel costs related to strategic new hiring, stock-based compensation, professional fees related to new contracts and higher costs for insurance.

Preliminary stage project costs are related to our NW Iowa RNG and Net-Zero projects and consist primarily of research and development expense in addition to selling, general and administrative expenses of the projects. Preliminary stage project costs decreased by $2.2 million during the three months ended March 31, 2022, compared to the same period in 2021. The decrease is primarily due to the capitalization of Net-Zero 1 project costs in the third quarter of 2021, after completing certain project milestones. Net-Zero 1 related costs and RNG related costs were still being expensed in the first quarter of 2021.

Gevo incurred a net loss for the three months ended March 31, 2022, of $(15.7) million, compared with a net loss of $(10.1) million during the same period in 2021. Non-GAAP adjusted net loss for the three months ended March 31, 2022, was $(15.7) million, compared with a non-GAAP adjusted net loss of $(10.0) million during the same period in 2021. Among other things, we incurred costs related to our production of isobutanol and hydrocarbon products for market development purposes, process technology and related process engineering work, expenses for additional intellectual property and know-how development for chemical and biological catalysts and related technologies, market development, partnership development, site development work, and Verity Tracking development expenses.

Non-GAAP cash EBITDA loss in the three months ended March 31, 2022, was $(10.3) million, compared with a $(7.8) million non-GAAP cash EBITDA loss in the same period in 2021.

During the three months ended March 31, 2022, we used $7.9 million in cash for investing activities, of which $71.1 million related to proceeds from sales and maturities of marketable securities, offset by the reinvestment of $31.2 million in marketable securities, and $31.5 million of investments in our capital projects, including $18.3 million in the NW Iowa RNG project, $9.6 million in the Net-Zero 1 project, as well as $3.2 million in development projects at Agri-Energy and Gevo.


Webcast and Conference Call Information

Hosting today’s conference call at 4:30 p.m. EST (2:30 p.m. MST) will be Dr. Patrick R. Gruber, Chief Executive Officer, L. Lynn Smull, Chief Financial Officer, Dr. Chris Ryan, Chief Operating Officer, Heather Manuel, Vice President – Investor Relations & Communications and John Richardson, Director of Investor Relations. They will review Gevo’s financial results and provide an update on recent corporate highlights

.

To participate in the conference call, please dial 1 (833) 729-4776 (inside the U.S.) or 1 (830) 213-7701 (outside the U.S.) and reference the access code 2251249# or through the event weblink https://edge.media-server.com/mmc/p/rkzfqmut

A replay of the call and webcast will be available two hours after the conference call ends on May 9, 2022. To access the replay, please dial 1 (855) 859-2056 (inside the U.S.) or 1 (404) 537-3406 (outside the U.S.) and reference the access code 2251249#. The archived webcast will be available in the Investor Relations section of Gevo’s website at www.gevo.com.

About Gevo

Gevo’s mission is to transform renewable energy and carbon into energy-dense liquid hydrocarbons. These liquid hydrocarbons can be used for drop-in transportation fuels such as gasoline, jet fuel, and diesel fuel, that when burned have potential to yield net-zero greenhouse gas emissions when measured across the full lifecycle of the products. Gevo uses low-carbon renewable resource-based carbohydrates as raw materials, and is in an advanced state of developing renewable electricity and renewable natural gas for use in production processes, resulting in low-carbon fuels with substantially reduced carbon intensity (the level of greenhouse gas emissions compared to standard petroleum fossil-based fuels across their lifecycle). Gevo’s products perform as well or better than traditional fossil-based fuels in infrastructure and engines, but with substantially reduced greenhouse gas emissions. In addition to addressing the problems of fuels, Gevo’s technology also enables certain plastics, such as polyester, to be made with more sustainable ingredients. Gevo’s ability to penetrate the growing low-carbon fuels market depends on the price of oil and the value of abating carbon emissions that would otherwise increase greenhouse gas emissions. Gevo believes that its proven, patented, technology enabling the use of a variety of low-carbon sustainable feedstocks to produce price-competitive low carbon products such as gasoline components, jet fuel, and diesel fuel yields the potential to generate project and corporate returns that justify the build-out of a multi-billion-dollar business.

Gevo believes that Argonne National Laboratory GREET model is the best available standard of scientific based measurement for life cycle inventory or LCI.

Learn more at Gevo’s website: www.gevo.com

Forward-Looking Statements

Certain statements in this press release may constitute “forward-looking statements” within the meaning of the Private Securities Litigation Reform Act of 1995. These forward-looking statements relate to a variety of matters, including, without limitation, our financial condition, our results of operation and liquidity, our business development activities, our Net-Zero Projects, our RNG Project, the engineering and design work for our projects, our offtake agreements, our plans to develop its business, our ability to successfully construct and finance our operations and growth projects, our ability to achieve cash flow from our planned projects, the ability of our products to contribute to lower greenhouse gas emissions, particulate and sulfur pollution, Verity Tracking development progress, project development costs and other statements that are not purely statements of historical fact These forward-looking statements are made based on the current beliefs, expectations and assumptions of the management of Gevo and are subject to significant risks and uncertainty. Investors are cautioned not to place undue reliance on any such forward-looking statements. All such forward-looking statements speak only as of the date they are made, and Gevo undertakes no obligation to update or revise these statements, whether as a result of new information, future events or otherwise. Although Gevo believes that the expectations reflected in these forward-looking statements are reasonable, these statements involve many risks and uncertainties that may cause actual results to differ materially from what may be expressed or implied in these forward-looking statements. For a further discussion of risks and uncertainties that could cause actual results to differ from those expressed in these forward-looking statements, as well as risks relating to the business of Gevo in general, see the risk disclosures in the Annual Report on Form 10-K of Gevo for the year ended December 31, 2021 and in subsequent reports on Forms 10-Q and 8-K and other filings made with the U.S. Securities and Exchange Commission by Gevo.


Non-GAAP Financial Information

This press release contains financial measures that do not comply with U.S. generally accepted accounting principles (GAAP), including non-GAAP cash EBITDA loss, non-GAAP adjusted net loss and non-GAAP adjusted net loss per share. Non-GAAP cash EBITDA loss excludes depreciation and amortization and non-cash stock-based compensation from GAAP loss from operations. Non-GAAP adjusted net loss and adjusted net loss per share exclude non-cash gains and/or losses recognized in the quarter due to the changes in the fair value of certain of Gevo’s financial instruments, such as warrants, convertible debt and embedded derivatives, from GAAP net loss. Management believes these measures are useful to supplement its GAAP financial statements with this non-GAAP information because management uses such information internally for its operating, budgeting and financial planning purposes. These non-GAAP financial measures also facilitate management’s internal comparisons to Gevo’s historical performance as well as comparisons to the operating results of other companies. In addition, Gevo believes these non-GAAP financial measures are useful to investors because they allow for greater transparency into the indicators used by management as a basis for its financial and operational decision making. Non-GAAP information is not prepared under a comprehensive set of accounting rules and therefore, should only be read in conjunction with financial information reported under U.S. GAAP when understanding Gevo’s operating performance. A reconciliation between GAAP and non-GAAP financial information is provided in the financial statement tables below


Gevo, Inc.

Condensed Consolidated Balance Sheets Information

(Unaudited, in thousands, except share and per share
amounts)

March 31, 2022

December 31, 2021

Assets

Current assets

Cash and cash equivalents

$                     44,626

$                     40,833

Marketable securities (current)

                     265,813

                     275,340

Restricted cash (current)

                       16,216

                       25,032

Accounts receivable, net

                           168

                           978

Inventories

                         2,735

                         2,751

Prepaid expenses and other current assets

                         5,861

                         6,857

Total current assets

                     335,419

                     351,791

Property, plant and equipment, net

                     156,896

                     139,141

Long-term marketable securities

                       32,724

                       64,396

Long-term restricted cash

                       70,238

                       70,168

Operating right-of-use assets

                         2,209

                         2,414

Finance right-of-use assets

                       26,887

                       27,297

Intangible assets, net

                         8,656

                         8,938

Deposits and other assets

                         5,631

                         2,331

Total assets

$                   638,660

$                   666,476

Liabilities

Current liabilities

Accounts payable and accrued liabilities

$                     13,410

$                     28,288

Operating lease liabilities (current)

                           416

                           772

Finance lease liabilities (current)

                         4,029

                         3,413

Loans payable – other (current)

                             89

                           158

Total current liabilities

                       17,944

                       32,631

2021 Bonds payable (long-term)

                       66,669

                       66,486

Loans payable – other (long-term)

                           276

                           318

Operating lease liabilities (long-term)

                         1,838

                         1,902

Finance lease liabilities (long-term)

                       17,403

                       17,797

Other long-term liabilities

                             95

                             87

Total liabilities

                     104,225

                     119,221

Stockholders’ Equity

Common stock, $0.01 par value per share; 500,000,000 authorized; 201,752,722 and 201,988,662 shares issued and outstanding at March 31, 2022 and December 31, 2021, respectively.

                         2,019

                         2,020

Additional paid-in capital

                  1,107,051

                  1,103,224

Accumulated other comprehensive loss

                       (1,587)

                          (614)

Accumulated deficit

                    (573,048)

                    (557,375)

Total stockholders’ equity

                     534,435

                     547,255

Total liabilities and stockholders’ equity

$                   638,660

$                   666,476


Gevo, Inc.

Condensed Consolidated Statements of Operations
Information

(Unaudited, in thousands, except share and per share
amounts)

Three Months Ended March 31,

2022

2021

Revenue and cost of goods sold

Ethanol sales and related products, net

$                        169

$                          —

Hydrocarbon revenue

                            63

                            13

Other revenue

                            —

                            80

Total revenues

                          232

                            93

Cost of production

                       3,090

                          901

Depreciation and amortization

                       1,091

                       1,093

Gross loss

                     (3,949)

                     (1,901)

Operating expenses

Research and development expense (including noncash compensation expense of $0.1 million and $0.5 million, respectively)

                       1,192

                       1,378

Selling, general and administrative expense (including noncash compensation expense of $1.4 million and $0.5 million, respectively)

                       9,367

                       3,814

Preliminary stage project costs

                          507

                       2,727

Other operations (including noncash compensation expense of $0.1 million and nil, respectively)

                          589

                            —

Depreciation and amortization

                          351

                            58

Total operating expenses

                    12,006

                       7,977

Loss from operations

                   (15,955)

                     (9,878)

Other income (expense)

(Loss) gain from change in fair value of derivative warrant liability

                            —

                           (53)

Interest expense

                             (2)

                             (5)

Interest and dividend income

                          252

                            31

Other income (expense), net

                            32

                         (152)

Total other income (expense), net

                          282

                         (179)

Net loss

$                 (15,673)

$                 (10,057)

Net loss per share – basic and diluted

$                     (0.08)

$                     (0.05)

Weighted-average number of common shares outstanding – basic and diluted

201,925,747

183,566,524


Gevo, Inc.

Condensed Consolidated Statements of Comprehensive Income

(Unaudited, in thousands, except share and per share
amounts)

Three Months Ended March 31,

2022

2021

Net loss

$                 (15,673)

$                (10,057)

Other comprehensive income (loss)

Unrealized gain (loss) on available-for-sale securities, net of tax

                         (974)

                            —

Adjustment for net gain (loss) realized and included in net income, net of tax

                              1

                            —

Total change in other comprehensive income (loss)

                         (973)

                            —

Comprehensive loss

$                 (16,646)

$                (10,057)


Gevo, Inc.

Condensed Consolidated Statements of Stockholders Equity Information

(Unaudited, in thousands, except share amounts)

Common Stock

Paid-In Capital

Accumulated Other Comprehensive
Loss

Accumulated Deficit

Stockholders’ Equity

Shares

Balance, December 31, 2021

201,988,662

$     2,020

$    1,103,224

$                      (614)

$             (557,375)

$             547,255

Issuance of common stock upon exercise of warrants

4,677

            —

                  3

                          —

                      —

                         3

Non-cash stock-based compensation

            —

            4,044

                          —

                      —

                  4,044

Issuance of common stock under stock plans, net of taxes

(240,617)

            (1)

              (220)

                          —

                      —

                    (221)

Other comprehensive loss

            —

                —

                        (973)

                      —

                    (973)

Net loss

            —

                —

                          —

               (15,673)

               (15,673)

Balance, March 31, 2022

201,752,722

$     2,019

$    1,107,051

$                   (1,587)

$             (573,048)

$             534,435

Balance, December 31, 2020

128,138,311

$     1,282

$      643,269

$                        —

$             (498,172)

$             146,379

Issuance of common stock, net of issuance costs

68,170,579

          682

        457,008

                          —

                      —

               457,690

Issuance of common stock upon exercise of warrants

1,863,058

            18

            1,099

                          —

                      —

                  1,117

Non-cash stock-based compensation

            —

               562

                          —

                      —

                     562

Issuance of common stock under stock plans, net of taxes

(121,499)

            (1)

                  1

                          —

                      —

                       —

Net loss

            —

                —

                          —

               (10,057)

               (10,057)

Balance, March 31, 2021

198,050,449

$     1,981

$    1,101,939

$                        —

$             (508,229)

$             595,691


Gevo, Inc.

Condensed Consolidated Cash Flow Information

(Unaudited, in thousands)

Three Months Ended March 31,

2022

2021

Operating Activities

Net loss

$                    (15,673)

$                   (10,057)

Adjustments to reconcile net loss to net cash used in operating activities:

Stock-based compensation

                         4,258

                           925

Depreciation and amortization

                         1,442

                        1,149

Non-cash lease expense

                            139

                             17

Non-cash interest expense

                         1,150

                             —

Changes in operating assets and liabilities:

Accounts receivable

                            810

                           435

Inventories

                             16

                             39

Prepaid expenses and other current assets, deposits and other assets

                        (2,317)

                       (4,273)

Accounts payable, accrued expenses and long-term liabilities

                        (2,285)

                        4,600

Net cash used in operating
activities

                      (12,460)

                       (7,165)

Investing Activities

Acquisitions of property, plant and equipment

                      (31,218)

                       (4,630)

Acquisition of patent portfolio

                            (10)

                             —

Proceeds from sale and maturity of marketable securities

                       71,082

                             —

Purchase of marketable securities

                      (31,993)

                             —

Net cash used in investing
activities

                         7,861

                       (4,630)

Financing Activities

Debt and equity offering costs

                             —

                     (31,683)

Proceeds from issuance of common stock and common stock warrants

                             —

                     489,373

Proceeds from exercise of warrants

                               3

                        1,117

Net settlement of common stock under stock plans

                          (220)

                             —

Payment of loans payable – other

                          (103)

                            (27)

Payment of finance lease liabilities

                            (34)

                             —

Net cash provided by financing
activities

                          (354)

                     458,780

Net increase (decrease) in cash
and cash equivalents

                        (4,953)

                     446,985

Cash, cash equivalents and restricted cash at beginning of period

136,033

78,338

Cash, cash equivalents and
restricted cash at end of period

$                   131,080

$                   525,323


Gevo, Inc.

Reconciliation of GAAP to Non-GAAP Financial Information

(Unaudited, in thousands, except share and per share
amounts)

Three Months Ended March 31,

2022

2021

Non-GAAP Cash EBITDA:

Loss from operations

$                 (15,955)

$                   (9,878)

Depreciation and amortization

                       1,442

                       1,149

Stock-based compensation

                       4,258

                          925

Non-GAAP cash EBITDA

$                 (10,255)

$                   (7,804)

Non-GAAP Adjusted Net Loss:


Net Loss

$                 (15,673)

$                 (10,057)

Adjustments:

Gain (loss) from change in fair value of derivative warrant liability

                             —

                           (53)

Total adjustments

                            —

                           (53)

Non-GAAP Net Income (Loss)

$                 (15,673)

$                 (10,004)

Non-GAAP adjusted net loss per share – basic and diluted

$                     (0.08)

$                     (0.05)

Weighted-average number of common shares outstanding – basic and diluted

201,925,747

183,566,524

Investor and Media Contact

+1 720-647-9605

IR@gevo.com

1 Cash EBITDA loss
is a non-GAAP measure calculated by adding back depreciation and amortization
and non-cash stock-based compensation to GAAP loss from operations. A
reconciliation of cash EBITDA loss to GAAP loss from operations is provided
in the financial statement tables following this release.

2 Adjusted net
loss per share is a non-GAAP measure calculated by adding back non-cash gains
and/or losses recognized in the quarter due to the changes in the fair value
of certain of our financial instruments, such as warrants, convertible debt
and embedded derivatives, to GAAP net loss per share. A reconciliation of
adjusted net loss per share to GAAP net loss per share is provided in the
financial statement tables following this release.

3 Adjusted net
loss is a non-GAAP measure calculated by adding back non-cash gains and/or
losses recognized in the quarter due to the changes in the fair value of
certain of our financial instruments, such as warrants, convertible debt and
embedded derivatives, to GAAP net loss. A reconciliation of adjusted net loss
to GAAP net loss is provided in the financial statement tables following this
release.

4 Cash EBITDA loss
is a non-GAAP measure calculated by adding back depreciation and amortization
and non-cash stock compensation to GAAP loss from operations. A
reconciliation of cash EBITDA loss to GAAP loss from operations is provided
in the financial statement tables following this release.


Investor & Media Contact:

Gevo Inc.
345 Inverness Drive South, Building C Suite 310,
Englewood, CO 80112
Phone: +1 720-647-9605
Email: IR@gevo.com

Twitter is about to Make Stock Market History with $RICK


Image Credit: Bombshells (Property of RCI Holdings)


Twitter and Ricks Hospitality Will Make History After the Closing Bell May 9

Twitter Spaces or just Spaces when on Twitter ($TWTR) is a relatively new way to hold a live audio conversation on Twitter between two parties, groups, or in a meeting setting. An earnings call, for public companies is a quarterly check-in with investors, analysts, and the media to discuss the company’s financial results for the prior reporting period.  On Monday, May 9th, at 4:30 PM ET, RCI Hospitality will hold its earnings call on Twitter Spaces. This event will make them the first in what may soon become the norm for corporations.

You can be part of history by logging in on Twitter’s audio platform to this reporting event.  


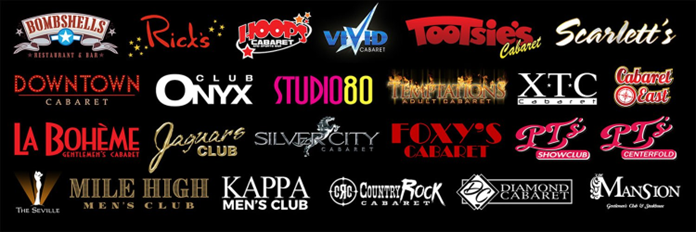
About RCI Hospitality, Holdings (RICK)

RCI owns and operates upscale gentlemen’s clubs and restaurants. Additionally, there is a website and media division. The banner below gives a great visual cross-section of their properties.


Image: Twitter @RicksCEO

If you want to explore Twitter Spaces, or learn about RICKs earnings, or just be part of history, here are the details of how to participate:

  • To participate in the RCI 2Q22 Earnings Call Twitter Space, follow @RicksCEO and go to this link: https://twitter.com/i/spaces/1mrGmanekZQGy
  • To ask questions during the Q&A, participants must join the Twitter Space using a mobile device
  • To listen only, participants can access the Twitter Space from a computer


RCI Hospitality will also be holding a Meet Management event that evening in Miami:

  • Investors are invited to meet management at RCI’s top revenue generating club
  • May 9th, at 8 PM ET, at Tootsie’s Cabaret Miami, 150 NW 183rd St., Miami, FL 33169
  • RSVP your contact information to gary.fishman@anreder.com


Stay up to date. Follow us:


History of Hawkish Fed Policy and Soft Landings


Image Credit: Jaime Robles (Flickr)


Fed Hopes for ‘Soft Landing’ for the US Economy, but History Suggests it Won’t be Able to Prevent a Recession

The Federal Reserve will likely soon learn what gymnasts already know: sticking a landing is hard.

With inflation surging to a new 40-year high and continuing to accelerate, the Fed is expected to again lift interest rates by a half-percentage point at the end of its next meeting. It will be the third of seven planned rate hikes in 2022 – following increases in March and May – as the Fed tries to cool consumer demand and slow rising prices.

By raising interest rates, the central bank is hoping to achieve a proverbial “soft landing” for the U.S. economy, in which it’s able to tame rapid inflation without causing unemployment to rise or triggering a recession. The Fed and professional forecasters project that inflation will recede to below 3% and unemployment will remain under 4% in 2023.

Our recent research, however, suggests that engineering a soft landing is highly improbable and that there is a significant likelihood of a recession in the not too distant future.

That’s because high inflation and low unemployment are both strong predictors of future recessions. In fact, since the 1950s, every time inflation has exceeded 4% and unemployment has been below 5%, the U.S. economy has gone into a recession within two years.

Today, inflation is at 8.5% and unemployment is at 3.6% – suggesting a recession will be very hard to avert.

Behind the Curve

Inflation is fundamentally caused by too much money chasing too few goods.

In the short run, the supply of goods in the economy is more or less fixed – there is nothing that fiscal or monetary policy can do to change it – so the job of the Fed is to manage total demand in the economy so that it balances with the available supply.

This article was republished with permission from The Conversation, a news site dedicated to sharing ideas from academic experts. It was written by and represents the research-based opinions of Alex Domash, Research Fellow, Harvard Kennedy School, and Lawrence H. Summers, Charles W. Eliot University Professor, Harvard Kennedy School.

When demand runs too far ahead of supply, the economy begins to overheat, and prices rise sharply. In our assessment, measures of overheating – such as strong demand growth, diminishing inventories and rising wages – began to show in the economy throughout 2021. But a new operating framework that the Fed adopted in August 2020 prevented the Fed from taking action until sustained inflation was already apparent.

As a result, the Fed is way behind the curve today in responding to an overheating economy.

Sticking a Soft Landing
is Hard

To bring down surging inflation, the Fed will now try to raise interest rates to curb consumer demand.

The resulting increase in borrowing costs can help slow economic activity by discouraging consumers and businesses from making new investments. But it would come at the risk of causing major economic disruptions and pushing the economy into a recession. This is the soft landing: Interest rates rise and demand falls enough to lower inflation, but the economy keeps growing.

The history of engineering soft landings is not encouraging, however. We found that every time the Fed has hit the brakes hard enough to bring down inflation in a meaningful way, the economy has gone into recession.

While some have argued that there have been several examples of soft landings over the last 60 years, including in 1965, 1984 and 1994, we show in our analysis that these periods had little resemblance to the current moment.

In all three episodes, the Fed was operating in an economy with significantly higher unemployment, lower inflation and lower wage growth. In these historical examples, the Fed also raised interest rates well above the inflation rate – unlike today, where inflation is at 8.5% and interest rates are projected to remain below 3% through 2023 – and explicitly acted early to preempt inflation from spiraling, rather than waiting for inflation to already be excessive.

Why is the Labor Market
Relevant for Inflation?

One reason the Fed’s challenge is particularly difficult today is that the labor market is unprecedentedly tight, meaning the demand for workers is far outpacing the available supply of them. A tight labor market implies that companies need to raise wages to attract new workers.

Usually, the unemployment rate is used as an indicator for labor market tightness. Unemployment is very low today, and the Fed expects it to go even lower. But our research shows that the pressure to raise wages is even higher than indicated by the unemployment rate. The number of job openings are at all an all-time high, and workers are quitting at record rates – both of which are significant for driving up wages.

In a sense, wages are the ultimate measure of core inflation – more than two-thirds of business costs go back to labor – so rising wages put significant upward pressure on inflation. Wage growth today is running at a historic rate of 6.6% and accelerating.

With wages rising so fast, there is little basis for optimism that inflation can slow to the 2% range targeted by the Fed. Our analysis shows that current wage growth implies sustained inflation above 5%, and that historically wage growth does not slow without significant increases in unemployment and a recession.

The U.S. economy today is facing additional inflationary pressures from higher grain and energy prices due to the Ukraine war and more supply-chain disruptions as COVID-19 forces new lockdowns in China. These factors threaten to exacerbate inflation even more over the coming year.

In our assessment, the inflation problem facing the Fed today is substantial and unlikely to be resolved without a significant economic slowdown. Overall, the combination of an overheating economy, surging wages, policy delay by the Fed and recent supply shocks means that a recession in the next couple of years is certainly more likely than not.


Suggested Reading


Can the Fed Successfully do What Has Never Been Done Before?


The Detrimental Impact of Fed Policy on Savers


Will Investors Rework their Positions in Response to Fed Statements?


Did the Stock Market Already Overshoot to the Downside in 2022?


Stay up to date. Follow us:


Ocugen (OCGN) – First Quarter Reported With Gene Therapy Programs Making Progress

Monday, May 09, 2022

Ocugen (OCGN)
First Quarter Reported With Gene Therapy Programs Making Progress

Ocugen, Inc. is a biotechnology company focused on discovering, developing, and commercializing novel gene therapies, biologicals and vaccines that improve health and offer hope for people and global communities. We are making an impact through courageous innovation, taking science in new directions in service of patients. Our breakthrough modifier gene therapy platform has the potential to treat multiple diseases with one drug and we are advancing research in other therapeutic areas to offer new options for people with unmet medical needs.

Robert LeBoyer, Vice President, Research Analyst, Life Sciences , Noble Capital Markets, Inc.

Refer to the full report for the price target, fundamental analysis, and rating.

Ocugen Reports 1Q22 Within Expectations.   Ocugen reported a loss of $18.0 million or $(0.09) per share, larger than our expected loss of $15.8 million or $(0.06) per share.  During the quarter, the company continued to work with US and Canadian regulators toward Covaxin approval.  The Phase 1/2 OCU400 gene therapy trial continues to enroll patients.  Cash balance at the end of 1Q was $129.9 million.

Ocugen Continues To Work Toward Covaxin Approval.  The US bioequivalence Phase 2/3 immuno-bridging study stopped new enrollment due to undisclosed issues at Bharat Biotech’s manufacturing plant.  As these issues are being addressed, the company continues to speak with the FDA to lift the clinical hold and to determine requirements for the BLA submission….

This Company Sponsored Research is provided by Noble Capital Markets, Inc., a FINRA and S.E.C. registered broker-dealer (B/D).

*Analyst certification and important disclosures included in the full report. NOTE: investment decisions should not be based upon the content of this research summary. Proper due diligence is required before making any investment decision. 

Genco Shipping (GNK) – Reaping the benefits of a favorable environment

Friday, May 06, 2022

Genco Shipping (GNK)
Reaping the benefits of a favorable environment

Genco Shipping & Trading Limited, incorporated on September 27, 2004, transports iron ore, coal, grain, steel products and other drybulk cargoes along shipping routes through the ownership and operation of drybulk carrier vessels. The Company is engaged in the ocean transportation of drybulk cargoes around the world through the ownership and operation of drybulk carrier vessels. As of December 31, 2016, its fleet consisted of 61 drybulk carriers, including 13 Capesize, six Panamax, four Ultramax, 21 Supramax, two Handymax and 15 Handysize drybulk carriers, with an aggregate carrying capacity of approximately 4,735,000 deadweight tons (dwt). Of the vessels in its fleet, 15 are on spot market-related time charters, and 27 are on fixed-rate time charter contracts. As of December 31, 2016, additionally, 19 of the vessels in its fleet were operating in vessel pools.

Michael Heim, CFA, Senior Research Analyst, Noble Capital Markets, Inc.

Refer to the full report for the price target, fundamental analysis, and rating.

Revenues benefit from a favorable shipping environment. Revenues rose 55% to $136.2 million, slightly above our forecast of $133.8 million. EBITDA of $58.0 million, up 181%, was slightly below our $60.4 million estimate due to higher operating costs. Net income for the quarter was $41.9 million ($0.97 per share) versus $2.0 million ($0.05) last year, slightly below our estimate of $44.0 million ($1.03). 

Management is making good use of higher cash flow. The company took delivery of two vessels in the quarter, reduced debt by $48.75 million and raised the quarterly dividend 18% to $0.79 per share (14% yield). …

This Research is provided by Noble Capital Markets, Inc., a FINRA and S.E.C. registered broker-dealer (B/D).

*Analyst certification and important disclosures included in the full report. NOTE: investment decisions should not be based upon the content of this research summary. Proper due diligence is required before making any investment decision. 

Leveraged and Inverse ETF Do’s and Mostly Don’ts


Image Credit: Ross Edwin Thompson (Flickr)


Leveraged and Inverse ETFs Contain Extra Costs for Buy-and-Hold Investors

Exchange traded funds are a popular way to invest to gain exposure to an index or an industry sector. If you’re bullish on a sector, they take the work out of selecting individual stocks within that sector. Instead, an ETF allows you to be exposed to many stocks and earn the mixed return of its holdings (less mgmt. fee). This is a valid, and for some, prudent way to invest. It would seem to stand to reason then, with the market’s recent performance, that if you think the equitiies may be weak for a long period that you could invest in an inverse ETF, or even a 2x or 3x inverse. However, it isn’t that easy. There is great danger in these so-called “geared ETFs.” Traders should fully understand this danger so they don’t get caught.

Leveraged or geared ETFs are not invested the same way an index mimicking 1x ETF is. This difference limits their usefulness; they can serve effectively as a hedging tool short term but are likely to fail as a long-term investment play.

Background

The underlying financial tools in a leveraged or inverse ETF are reworked each day to deliver a set positive or negative multiple of the performance of an index. Individually their objective may be to attain the goal over a given time period, such as one day or one month. The most common of the currently listed geared ETFs, leverage factors are 1.5x, 2x, and 3x and inverse factors are -0.5x, -1x, -2x and -3x.

The vast majority of geared ETFs reset their exposure factors each day. This means that the stated leverage or inverse objective they aim for is within a single trading day, generally measured from the close of trading on one day to the close of trading on the next day.

The objective of a geared ETF with a daily reset is to provide that degree of leveraged or inverse exposure for that single period – not over longer (or even shorter) periods. (Similarly, a geared ETP with a monthly objective is designed to provide that leveraged or inverse exposure for a specified monthly period.)

Holding a geared ETF for a period that is shorter or longer than its objective can lead to performance that may deviate significantly from the daily objective. In other words, if you are invested in a 2x inverse S&P 500 ETF, and the benchmark falls 1% in 24 hours, the security should provide you with 2% in return. However if you hold the inverse leveraged ETF for two months and the S&P 500 average decline is 1%, you may have several percentage points eroded from your account assets. I’ll explain below. The investment product is not designed to provide twice the positive or inverse return of the index over longer periods.

Another example is an inverse ETF that seeks to deliver negative 1x the performance of the Nasdaq 100 Index. This ETF aims to deliver a return that is exactly the opposite of what the index returns (whether positive or negative) on a given day. If the Nasdaq 100 closes up 1.5 percent, the inverse ETF would aim to return a loss of 1.5 percent. If the index closes down 2 percent, the ETF should return a gain of 2 percent.

Why Don’t they Function Longer Term?

To achieve their expected returns, leveraged and inverse ETFs employ a range of investment strategies, including swaps, futures, and other derivatives in addition to possible long or short positions in securities.

Since geared ETFs are only designed to accomplish the stated leveraged or inverse objective on a daily basis, they don’t orchestrate their underlying financial instruments to accomplish anything different than that objective. It simply isn’t their goal. In fact, returns often differ significantly from the performance (or inverse of the performance) of their pegged benchmark over an extension beyond the stated period of time. This makes these products risky if they are held medium or long term, especially in volatile markets. While these ETFs can be held for periods that don’t align with their stated objective, generally, the position should be monitored closely and used by investors who understand what the products are designed for and how they incur costs to the longer-term holder – that performance is warped over extended periods.

The fund manager incurs a large daily cost by resetting the underlying instruments, far greater than a straight 1x ETF. Also, most of the underlying instruments incur futures decay as they move closer to their expiration date. Over one day this decay is accounted for in the daily mix, over a longer time period it is felt by the investor.

Things to Consider

Before committing money to any of these ETFs, clearly understand the specific leveraged or inverse ETF before investing in it. Be sure about your own purpose in committing money. Could the ETF accomplish or undermine your goal? Read the prospectus, and understand the objectives, risks, and costs.

When Might You Use a Geared ETF

Most of these ETFs are created to be used to hedge a portfolio or trading position overnight. Trading desks, institutional managers, and savvy retail investors with overnight positions may wish to protect against a large change in portfolio value while they are sleeping or through  weekend.

For example: If a trading desk is long $600,000 in stocks that would be expected to roughly track the Russell 2000, before the close they may protect the position from any big moves overnight by committing $200,000 to a 3x ETF of the index.  

Take-Away

Leveraged and inverse ETFs are designed as very short-term hedging and risk management tools. Investors that are considering a strategy to implement either short ETFs or leveraged should read the prospectus and understand the particular ETF thoroughly. Review the performance over a year versus the expected index.

Paul Hoffman

Managing Editor, Channelchek

Suggested Content


Will the SEC Double Down on Triple Leveraged ETFs?


Index Funds Still May Fall Apart over Time


Is the Index Bubble Michael Burry Warned About Still Looming?


Did the Stock Market Already Overshoot to the Downside in 2022?

Sources

https://www.sec.gov/investor/pubs/leveragedetfs-alert.htm#:~:text=As%20discussed%20above%2C%20because%20leveraged,the%20index%20showed%20a%20gain.

https://www.finra.org/investors/insights/lowdown-leveraged-and-inverse-exchange-traded-products


Stay up to date. Follow us:


Lee Enterprises (LEE) – Results Validate Its Digital Growth Strategy

Friday, May 06, 2022

Lee Enterprises (LEE)
Results Validate Its Digital Growth Strategy

Lee Enterprises, Incorporated provides local news, information, and advertising primarily in midsize markets in the United States. It publishes 49 daily newspapers, as well as offers 300 weekly newspapers and specialty publications in 23 states. The company also provides online advertising and services; and online infrastructure and online publishing services for approximately 1,500 daily and weekly newspapers and shoppers. In addition, it offers commercial printing services. The company has a strategic alliance with Yahoo!, Inc. to provide its classified employment advertising customer base the opportunity to post job listings and other employment products on Yahoo!s HotJobs national platform. Lee Enterprises, Incorporated was founded in 1890 and is based in Davenport, Iowa.

Michael Kupinski, Director of Research, Noble Capital Markets, Inc.

Patrick McCann, Research Associate, Noble Capital Markets, Inc.

Refer to the full report for the price target, fundamental analysis, and rating.

A little light, but not worrisome. Fiscal Q2 revenues of $190.0 million was slightly less than our $191.2 million estimate. The results reflected better-than-expected growth in its Digital businesses and weaker results in its print advertising business. Adj. EBITDA was $16.9 million versus our $17.8 million estimate. 

Digital excels. Total Digital revenues were $58.1 million, 7% better than our expectation, and represented 31% of total company revenues, up from 27% in fiscal Q1. The strong results were driven by Digital Only Subscription revenue, up 44.7% to $32.9 million, an impressive 26% above expectations. Amplified, its digital agency business, increased revenues 108%. We believe that the strong Digital growth validates the company’s Digital investments and its growth strategy. …

This Company Sponsored Research is provided by Noble Capital Markets, Inc., a FINRA and S.E.C. registered broker-dealer (B/D).

*Analyst certification and important disclosures included in the full report. NOTE: investment decisions should not be based upon the content of this research summary. Proper due diligence is required before making any investment decision. 

RCI Hospitality Holdings (RICK) – Sweet Home Alabama

Friday, May 06, 2022

RCI Hospitality Holdings (RICK)
Sweet Home Alabama

Joe Gomes, Senior Research Analyst, Noble Capital Markets, Inc.

Joshua Zoepfel, Research Associate, Noble Capital Markets, Inc.

Refer to the full report for the price target, fundamental analysis, and rating.

Adding more Restaurants. RCI Hospitality announced the signing of a franchise agreement for Bombshells Restaurant & Bar that brings three franchise locations of the restaurant to the state of Alabama. The franchisee of the locations will be a newly established entity by Jerry Westland, a hospitality entrepreneur who owns nightclubs, bars, and restaurants. These locations will be opening over the next five years, with the first one being placed in Huntsville.

Continuing to Grow Bombshells. This announcement is a testament to RCI’s strategy of expanding Bombshells into various states as well as expanding on the franchising model for the restaurant. Recall, management’s goal is to have 80-100 locations over the next five years, and the Company is actively looking at different areas of Texas and Florida in which to expand the brand….

This Company Sponsored Research is provided by Noble Capital Markets, Inc., a FINRA and S.E.C. registered broker-dealer (B/D).

*Analyst certification and important disclosures included in the full report. NOTE: investment decisions should not be based upon the content of this research summary. Proper due diligence is required before making any investment decision.