Release – Bowlero Corp Announces Agreement to Acquire Three Bowling Centers in Wichita, Kansas


Bowlero Corp Announces Agreement to Acquire Three Bowling Centers in Wichita, Kansas

Research, News, and Market Data on Bowlero

05/23/2022

Bowlero Corp to expand in the state of Kansas

NEW YORK, May 23, 2022 (GLOBE NEWSWIRE) — Bowlero Corp. (“Bowlero” or the “Company”), the world’s largest owner and operator of bowling centers, as well as the owner of the Professional Bowlers Association (PBA), announced today that it had entered into an agreement to acquire three bowling centers in Wichita, Kansas – Northrock Lanes, West Acres Bowling Center and The Alley Indoor Entertainment, expanding the company’s footprint in the state to four locations.

Northrock Lanes, one of the three locations, is the largest bowling center in the state of Kansas and is located at 3232 N Rock Road. This center features 48 lanes, an interactive arcade, a banquet hall that fits more than 120 guests, a sports grill and snack bar.

The second location, West Acres Bowling Center is located at 749 N Ridge Road. This center features 36 lanes, cosmic bowling, an on-site pro shop and a full-service bar.

The third center, The Alley Indoor Entertainment, is located at 11413 E 13th Street N. This center is equipped with 32 lanes, indoor electric go karts, a Laser Maze, an interactive arcade, virtual reality, a sports grill and an escape room.

“Bowlero Corp is committed to delivering a world class bowling experience to the guests we serve each year and we’re thrilled to welcome these three new centers to our portfolio,” said Tom Shannon, Chairman and CEO of Bowlero Corp.

The three locations will officially operate under Bowlero Corp management upon completion of the acquisition, introducing new offers and exclusive promotions to the centers from Bowlero. The acquisition is expected in the next three months.

About Bowlero Corp
Bowlero Corp. is the worldwide leader in bowling entertainment, media, and events. With more than 300 bowling centers across North America, Bowlero Corp. serves more than 26 million guests each year through a family of brands that includes Bowlero, Bowlmor Lanes, and AMF. In 2019, Bowlero Corp. acquired the Professional Bowlers Association, the major league of bowling, which boasts thousands of members and millions of fans across the globe. For more information on Bowlero Corp., please visit BowleroCorp.com.

For Media:
Bowlero Corp. Public Relations
pr@bowlerocorp.com  

For Investors:
ICR, Inc.
Ryan Lawrence
Ryan.Lawrence@icrinc.com

Ashley DeSimone
Ashely.desimone@icrinc.com


Release – Euroseas Ltd. Reports Results for the Quarter Ended March 31, 2022, Announces Share Repurchase Program and Declares Quarterly Common Stock Dividend


Euroseas Ltd. Reports Results for the Quarter Ended March 31, 2022, Announces Share Repurchase Program and Declares Quarterly Common Stock Dividend

Research, News, and Market Data on Euroseas Ltd


ATHENS, Greece, May 23, 2022 (GLOBE NEWSWIRE) — Euroseas Ltd. (NASDAQ: ESEA, the “Company” or “Euroseas”), an owner and operator of container carrier vessels and provider of seaborne transportation for containerized cargoes, announced today its results for the three-month period ended March 31, 2022 and a share repurchase program and declared a common stock dividend.

First Quarter 2022
Financial Highlights:

  • Total net revenues of $45.4 million. Net income and net income attributable to common shareholders of $29.9 million or $4.15 and $4.13 earnings per share basic and diluted, respectively. Adjusted net income attributable to common shareholders1 for the period was $26.8 million or $3.71 and $3.70 per share basic and diluted, respectively.
  • Adjusted EBITDA
    1 was $31.1 million.

  • An average of 16.0 vessels were owned and operated during the first quarter of 2022 earning an average time charter equivalent rate of $33,986 per day. 
  • The Board of Directors has approved a share repurchase program for up to a total of $20 million of the Company’s common stock. The Board will review the program after a period of 12 months. Share repurchases will be made from time to time for cash in open market transactions at prevailing market prices or in privately negotiated transactions. The timing and amount of purchases under the program will be determined by management based upon market conditions and other factors. The program does not require the Company to purchase any specific number or amount of shares and may be suspended or reinstated at any time at the Company’s discretion and without notice.
  • Declared a quarterly dividend of $0.50 per share for the first quarter of 2022 payable on or about June 16, 2022 to shareholders of record on June 9, 2022. This dividend reinstates the Company’s common stock dividend plan.

Recent developments

  • At the beginning of May we agreed to acquire M/V “Rena P” (ex. Seaspan Melbourne) and M/V “Emmanuel P” (ex. Seaspan Manila), both intermediate size container vessels with capacity of 4,250 teu each, built in 2007 and 2005, respectively. The vessels are being acquired for a combined price of $37 million and are expected to be delivered to the Company within May and June 2022, respectively. The Company will also assume the existing charter arrangements of the vessels as noted in the fleet profile below. Both acquisitions will be initially financed with the Company’s own funds.
  • In mid-May the Company exercised its option to proceed with the construction of two additional eco design fuel efficient containerships. The vessels will have a carrying capacity of about 2,800 teu each and will be built at Hyundai Mipo Dockyard Co. in South Korea. The two newbuildings are scheduled to be delivered during the fourth quarter of 2024. The total consideration for these two newbuilding contracts is approximately $86 million and will be financed with a combination of debt and equity.

Aristides Pittas,
Chairman and CEO of Euroseas commented: 
“Despite their recent small correction, the containership feeder charter rates have remained at levels near historical highs resulting in increased profitability for Euroseas. In parallel, expectations of continuing strength of the charter market have allowed us to charter forward the first two newbuildings of our 9-vessel newbuilding program at rates that will allow us to fully recover their construction cost over the 3-year duration of the charters. While the inefficiencies of the transportation system introduced by the COVID pandemic, that effectively reduce supply of ships, remain, uncertainties have been introduced by the on-going Ukraine-Russia conflict and increased levels of inflation that could affect economic growth and, thus, demand for shipping.   We expect the market to remain strong in the near and medium term and are monitoring the above trends which alongside with new regulation on greenhouse gas emissions and expected increased new vessel deliveries will shape our markets.

“Within this environment, we continuously look for investment and other opportunities that will allow us to maximize returns to our shareholders. Our investment strategy is focused either on placing newbuilding orders that also enhance the environmental footprint of our company, or, secondhand vessels with simultaneous charters that bring their cost basis to below historical average levels by the end of the charter, thus, providing us the option for upsized returns.

“Overall, we are determined to remain a significant participant in the feeder containership market and grow the company. Our charter coverage provides earnings visibility well into 2024. Despite that, our stock trades at levels that do not reflect the mere value of our contracted earnings let alone the net asset value of the company, thus, representing one of the most attractive investment opportunities for us. In that spirit, our Board of Directors has authorized a $20 million stock repurchase program which management may use at its discretion. Our Board believes that our increased profitability and earnings visibility should be used to restore our dividend policy which had run continuously from 2005 until 2013 and had been paused during the tough last decade. Our Board decided to use a small part of our contracted earnings which will not alter our growth philosophy to reward our shareholders and declared a common stock dividend of $0.50 per share.

“We are very pleased with these developments and we look forward to continuing to chart a very profitable future for our shareholders and investors.”

Tasos Aslidis, Chief
Financial Officer of Euroseas commented: 
“The results of the first quarter of 2022 reflect the strong market charter rates our vessels earned compared to the same period of last year. Our net revenues increased to $45.4 million in the first quarter of 2022 compared to $14.3 million during the same period of last year due to the higher number of vessels we operated in the first quarter of 2022 and the higher market rates earned by our vessels. During the first quarter of 2022 we operated 16.0 vessels versus 14.0 vessels during the same period of last year.

“On a per-vessel-per-day basis, our vessels earned a 180.1% higher average charter rate in the first quarter of 2022 as compared to the same period of 2021. Again, on a per-vessel-per-day basis, the sum of vessel operating expenses, management fees and general and administrative expenses increased by 5.3% during the first quarter of 2022 as compared to the same period in 2021 which was attributable mainly to an increase in hull and machinery insurance premiums, the increased crewing costs resulting from difficulties in crew rotation due to COVID-19 related restrictions and the increased lubricants oil costs as a result of the war in Ukraine for our vessels compared to the same period of 2021. We believe that we continue to maintain one of the lowest operating cost structures amongst the public shipping companies which is one of our competitive advantages.

“Adjusted EBITDA during the first quarter of 2022 was $31.1 million compared to $5.6 million achieved for the first quarter of 2021.

“Finally, as of March 31, 2022, our outstanding debt (excluding the unamortized loan fees) is about $112.1 million versus restricted and unrestricted cash of about $54.1 million.”
        

First Quarter 2022 Results:
For the first quarter of 2022, the Company reported total net revenues of $45.4 million representing a 217.1% increase over total net revenues of $14.3 million during the first quarter of 2021. On average, 16.0 vessels were owned and operated during the first quarter of 2022 earning an average time charter equivalent rate of $33,986 per day compared to 14.0 vessels in the same period of 2021 earning on average $12,134 per day. The Company reported a net income and a net income attributable to common shareholders for the period of $29.9 million, as compared to a net income of $3.8 million and a net income attributable to common shareholders of $3.6 million for the first quarter of 2021.

Vessel operating expenses for the first quarter of 2022 amounted to $8.4 million as compared to $6.9 million for the same period of 2021. The increased amount is due to the higher number of vessels owned and operated in the first quarter of 2022 compared to the corresponding period of 2021, partly offset by the increased crewing costs, for our vessels compared to the same period of 2021, resulting from difficulties in crew rotation due to COVID-19 related restrictions, the higher prices in the supply of lubricants and the increase in hull and machinery insurance premiums. Depreciation expense for the first quarter of 2022 amounted to $3.7 million compared to $1.6 million for the same period of 2021 due to the increased number of vessels in the Company’s fleet and the fact that the new vessels acquired in the fourth quarter of 2021 have a higher average daily depreciation charge as a result of their higher acquisition price compared to the remaining vessels. Related party management fees for the first quarter of 2022 increased to $1.2 million from $1.1 million for the same period of 2021 for the same reason. In the first quarter of 2022 two of our vessels completed their intermediate survey in water and one of our vessels completed her special survey with drydock for a total cost of $1.8 million. In the same period of 2021, none of our vessels underwent drydocking and certain expenses were incurred in connection with upcoming drydockings. Finally, during the first quarter of 2022 and 2021, we had other operating expenses of $0.35 million and other operating income of $0.2 million, respectively, relating to settlement of accounts with charterers.

Interest and other financing costs for the first quarter of 2022 amounted to $1.0 million compared to $0.7 million for the same period of 2021. This increase is due to the increased amount of debt and the increase in the weighted average LIBOR rate in the current period compared to the same period of 2021. For the three months ended March 31, 2022 the Company recognized a $2.34 million gain on its interest rate swap contracts, comprising a $0.04 million realized loss and a $2.38 million unrealized gain. For the three months ended March 31, 2021 the Company recognized a $0.48 million loss on its interest rate swap contract, comprising a $0.52 million unrealized loss and a $0.04 million realized gain.

Adjusted EBITDA1 for the first quarter of 2022 was $31.1 million, compared to $5.6 million achieved for the first quarter of 2021. Please see below for Adjusted EBITDA reconciliation to net income.

Basic and diluted earnings per share for the first quarter of 2022 was $4.15 and $4.13, respectively, calculated on 7,221,941 basic and 7,254,593 diluted weighted average number of shares outstanding compared to basic and diluted earnings per share of $0.53 for the first quarter of 2021, calculated on 6,711,408 basic and 6,749,393 diluted weighted average number of shares outstanding.

Excluding the effect on the income attributable to common shareholders for the quarter of the unrealized gain on derivatives, the amortization of below market time charters acquired and the depreciation charged due to the increased value of the vessel acquired with below market time charter, the adjusted earnings per share for the quarter ended March 31, 2022 would have been $3.71 and $3.70 per share basic and diluted, respectively, compared to adjusted earnings of $0.45 per share basic and diluted for the first quarter of 2021, after excluding unrealized gain on derivatives and loss on sale of a vessel. Usually, security analysts do not include the above items in their published estimates of earnings per share.

Fleet Profile:
The Euroseas Ltd. fleet profile is as follows:

Vessels
under construction

Type

Dwt

TEU

To be delivered

Employment

TCE Rate ($/day)

GREGOS (*) (H4201)

Feeder

37,237

2,800

Q1 2023

TC until Mar-26

$48,000

TERATAKI (*) (H4202)

Feeder

37,237

2,800

Q2 2023

TC until Jun-26

$48,000

TENDER SOUL (H4236)

Feeder

37,237

2,800

Q4 2023


LEONIDAS Z (H4237)

Feeder

37,237

2,800

Q1 2024


MONICA (H4248)

Feeder

22,262

1,800

Q1 2024


STEPHANIA K (H4249)

Feeder

22,262

1,800

Q2 2024


PEPI STAR (H4250)

Feeder

22,262

1,800

Q2 2024


DEAR PANEL (H4251)

Feeder

37,237

2,800

Q4 2024


SYMEON P (H4252)

Feeder

37,237

2,800

Q4 2024


Total
under construction

9

290,208

22,200


Note: (*)(+) TC denotes time charter. Charter duration indicates the earliest redelivery date; All dates listed are the earliest redelivery dates under each TC unless the contract rate is lower than the current market rate in which cases the latest redelivery date is assumed; vessels with the latest redelivery date shown are marked by (+).

(**) The CONTEX (Container Ship Time Charter Assessment Index) has been published by the Hamburg and Bremen Shipbrokers’ Association (VHBS) since October 2007. The CONTEX is a company-independent index of time charter rates for containerships. It is based on assessments of the current day charter rates of six selected containership types, which are representative of their size categories: Type 1,100 TEU and Type 1,700 TEU with a charter period of one year, and the Types 2,500, 2,700, 3,500 and 4,250 TEU all with a charter period of two years.

(***) Rate is net of commissions (which are typically 5-6.25%)


Summary Fleet Data:


Three Months Ended
March 31,2021

Three Months Ended
March 31,2022


Revenues


Time charter revenue

14,916,567

47,119,092

Commissions

(607,249)

(1,745,554)

Net revenues

14,309,318

45,373,538


Operating
expenses / (income)


Voyage expenses

127,409

354,024

Vessel operating expenses

6,864,353

8,398,893

Drydocking expenses

82,209

1,787,926

Vessel depreciation

1,596,543

3,721,116

Related party management fees

1,086,405

1,172,032

Loss on sale of vessel

9,417

General and administrative expenses

760,977

983,072

Other operating (income) / expenses

(216,496)

350,000

Total operating expenses, net

10,310,817

16,767,063


Operating
income

3,998,501

28,606,475


Other
income / (expenses)


Interest and other financing costs

(694,307)

(1,014,431)

Gain on derivatives, net

484,910

2,342,517

Foreign exchange (loss) / gain

(241)

1,052

Interest income

1,214

681

Other (expenses) / income, net

(208,424)

1,329,819


Net income

3,790,077

29,936,294

Dividend Series B Preferred shares

(138,269)

Preferred deemed dividend

(86,356)

Net income attributable to common
shareholders

3,565,452

29,936,294

Earnings per share, basic

0.53

4.15

Weighted average number of shares, basic

6,711,408

7,221,941

Earnings per share, diluted

0.53

4.13

Weighted average number of shares, diluted

6,749,393

7,254,593


Euroseas Ltd.
Unaudited Consolidated Condensed Balance Sheets
(All amounts expressed in U.S. Dollars – except number of shares)


Three Months
Ended March 31,
2021

Three Months
Ended March 31,
2022


Cash
flows from operating activities:


Net income

3,790,077

29,936,294

Adjustments to reconcile net income to net cash provided by operating activities:


Vessel depreciation

1,596,543

3,721,116

Amortization of deferred charges

49,280

83,496

Share-based compensation

28,765

214,559

Loss on sale of vessel

9,417

Unrealized gain on derivatives

(527,775)

(2,383,764)

Amortization of fair value of below market time charters acquired

(1,218,240)

Changes in operating assets and liabilities

1,422,694

(130,692)

Net
cash provided by operating activities

6,369,001

30,222,769


Cash
flows from investing activities:


Cash paid for vessels under construction

(1,732)

Cash paid for vessels acquisitions and capitalized expenses

(281,300)

Cash paid for vessel improvements

(208,457)

(403,928)

Net
cash used in investing activities

(208,457)

(686,960)


Cash flows from financing activities:


Redemption of Series B preferred shares

(2,000,000)

Proceeds from issuance of common stock, net of commissions paid

743,552

Preferred dividends paid

(91,607)

Repayment of long-term bank loans

(2,185,460)

(6,885,460)

Repayment of related party loan

(2,500,000)

Offering expenses paid

(60,357)

(27,838)

Net
cash used in financing activities

(6,093,872)

(6,913,298)


Net increase in cash, cash equivalents, and restricted cash

66,672

22,622,511

Cash, cash equivalents, and restricted cash at beginning of period

6,338,177

31,498,229

Cash,
cash equivalents, and restricted cash at end of period

6,404,849

54,120,740

Cash
breakdown


Cash and cash equivalents

3,629,150

49,151,500

Restricted cash, current

341,432

169,240

Restricted cash, long term

2,434,267

4,800,000

Total
cash, cash equivalents, and restricted cash shown in the statement of cash
flows

6,404,849

54,120,740


Euroseas Ltd.
Reconciliation of Adjusted EBITDA to
Net Income
(All amounts expressed in U.S. Dollars)


Three Months Ended
March 31, 2021

Three Months Ended
March 31, 2022

Net
income

3,790,077


29,936,294


Unrealized gain on derivatives

(527,775

)

(2,383,764

)

Loss on sale of vessel

9,417


Amortization of below market time charters acquired


(1,218,240

)

Depreciation charged due to increase in vessel value from below market time charter acquired


494,808


Adjusted
net income

3,271,719


26,829,098


Preferred dividends

(138,269

)


Preferred deemed dividend

(86,356

)


Adjusted
net income attributable to common shareholders

3,047,094


26,829,098


Adjusted earnings per share, basic

0.45


3.71


Weighted average number of shares, basic

6,711,408


7,221,941


Adjusted earnings per share, diluted

0.45


3.70


Weighted average number of shares, diluted

6,749,393


7,254,593


Adjusted net income and Adjusted earnings per share Reconciliation:
Euroseas Ltd. considers Adjusted net income to represent net income before unrealized gain on derivatives, loss on sale of vessel, amortization of below market time charters acquired and depreciation charged due to increase in vessel value from below market time charter acquired. Adjusted net income and Adjusted earnings per share is included herein because we believe it assists our management and investors by increasing the comparability of the Company’s fundamental performance from period to period by excluding the potentially disparate effects between periods of unrealized gain on derivatives, loss on sale of vessel, amortization of below market time charters acquired and depreciation charged due to increase in vessel value from below market time charter acquired, which items may significantly affect results of operations between periods.

Adjusted net income and Adjusted earnings per share do not represent and should not be considered as an alternative to net income or earnings per share, as determined by GAAP. The Company’s definition of Adjusted net income and Adjusted earnings per share may not be the same as that used by other companies in the shipping or other industries.

About Euroseas Ltd.
Euroseas Ltd. was formed on May 5, 2005 under the laws of the Republic of the Marshall Islands to consolidate the ship owning interests of the Pittas family of Athens, Greece, which has been in the shipping business over the past 140 years. Euroseas trades on the NASDAQ Capital Market under the ticker ESEA.

Euroseas operates in the container shipping market. Euroseas’ operations are managed by Eurobulk Ltd., an ISO 9001:2008 and ISO 14001:2004 certified affiliated ship management company, which is responsible for the day-to-day commercial and technical management and operations of the vessels. Euroseas employs its vessels on spot and period charters and through pool arrangements.

The Company has a fleet of 18 vessels, including 10 Feeder containerships and 8 Intermediate containerships. Euroseas 18 containerships have a cargo capacity of 58,871 teu. After the delivery of nine feeder containership newbuildings in 2023 and 2024, Euroseas’ fleet will consist of 27 vessels with a total carrying capacity of 81,071 teu.

Forward Looking Statement
This press release contains forward-looking statements (as defined in Section 27A of the Securities Act of 1933, as amended, and Section 21E of the Securities Exchange Act of 1934, as amended) concerning future events and the Company’s growth strategy and measures to implement such strategy; including expected vessel acquisitions and entering into further time charters. Words such as “expects,” “intends,” “plans,” “believes,” “anticipates,” “hopes,” “estimates,” and variations of such words and similar expressions are intended to identify forward-looking statements. Although the Company believes that the expectations reflected in such forward-looking statements are reasonable, no assurance can be given that such expectations will prove to have been correct. These statements involve known and unknown risks and are based upon a number of assumptions and estimates that are inherently subject to significant uncertainties and contingencies, many of which are beyond the control of the Company. Actual results may differ materially from those expressed or implied by such forward-looking statements. Factors that could cause actual results to differ materially include, but are not limited to changes in the demand for containerships, competitive factors in the market in which the Company operates; risks associated with operations outside the United States; and other factors listed from time to time in the Company’s filings with the Securities and Exchange Commission. The Company expressly disclaims any obligations or undertaking to release publicly any updates or revisions to any forward-looking statements contained herein to reflect any change in the Company’s expectations with respect thereto or any change in events, conditions or circumstances on which any statement is based.

Visit the Company’s
website 
www.euroseas.gr


Release – Entravision Announces Participation in Upcoming Investor Conferences


Entravision Announces Participation in Upcoming Investor Conferences

Research, News, and Market Data on Entravision

Company Release – 5/23/2022 4:15 PM ET

SANTA MONICA, Calif.–(BUSINESS WIRE)– Entravision (NYSE: EVC), a leading global advertising solutions, media and technology company, today announced Chris Young, Chief Financial Officer and Treasurer, will participate in the following upcoming investor conferences:

  • Singular Research’s Spring Select Webinar to be held Wednesday, May 25, 2022 from 6:00 a.m. to 4:00 p.m. PT. Management is scheduled to present that day at 1:45 p.m. PT.
  • The Gabelli 14th Annual Entertainment & Broadcasting Symposium to be held Thursday, June 2, 2022 in New York, New York. Management is scheduled to present on Thursday, June 2, 2022 at 10:00 a.m. ET and will participate in meetings with investors throughout the day.
  • The 12th Annual East Coast IDEAS Investor Conference to be held virtually on June 22-23, 2022. Management will host meetings on Wednesday, June 22, 2022, and Entravision’s presentation will be available beginning on Wednesday, June 22, 2022 at 6:00 a.m. ET.

The presentations will be webcast live over the Internet, and links to the live webcasts and replays will be available on Entravision’s Investor Relations website at investor.entravision.com.

About Entravision Communications Corporation

Entravision is a leading global advertising solutions, media and technology company connecting brands to consumers. Our dynamic portfolio includes digital, television and audio offerings. Digital, our largest revenue segment, is comprised of four business units: our digital sales representation business; Smadex, our programmatic ad purchasing platform; our branding and mobile performance solutions business; and our digital audio business. Through our digital sales representation business, we connect global media companies such as Meta, Twitter, TikTok and Spotify with advertisers in primarily emerging growth markets worldwide. Smadex is our mobile-first demand side platform, enabling advertisers to execute performance campaigns using machine learning. We also offer a branding and mobile performance solutions business, which provides managed services to advertisers looking to connect with global consumers, primarily on mobile devices, and our digital audio business provides digital audio advertising solutions for advertisers in the Americas. In addition to digital, Entravision has 49 television stations and is the largest affiliate group of the Univision and UniMás television networks. Entravision also manages 46 primarily Spanish-language radio stations that feature nationally recognized, Emmy award-winning talent. Shares of Entravision Class A Common Stock trade on the NYSE under ticker: EVC. Learn more about our offerings at entravision.com or connect with us on LinkedIn and Facebook.

View source version on businesswire.comhttps://www.businesswire.com/news/home/20220523005892/en/

Christopher T. Young
Chief Financial Officer
Entravision

310-447-3870

Kimberly Esterkin
Addo Investor Relations
310-829-5400

evc@addo.com

Source: Entravision Communications Corporation


Seanergy Maritime (SHIP) – Fine tuning numbers as we take over coverage

Friday, May 20, 2022

Seanergy Maritime (SHIP)
Fine tuning numbers as we take over coverage

Seanergy Maritime Holdings Corp., an international shipping company, provides marine dry bulk transportation services through the ownership and operation of dry bulk vessels. The company owns a modern fleet of 11 dry bulk carriers consisting of 9 Capesizes and 2 Supramaxes with a combined cargo-carrying capacity of approximately 1,682,582 dwt and an average fleet age of 8.1 years. The company was formerly known as Seanergy Maritime Corp. and changed its name to Seanergy Maritime Holdings Corp. in January 2009. The company was founded in 2008 and is headquartered in Athens, Greece with an office in Hong Kong

Michael Heim, CFA, Senior Research Analyst, Noble Capital Markets, Inc.

Refer to the full report for the price target, fundamental analysis, and rating.

We are making modest adjustments to our models as we take over research coverage of SHIP. We are lowering our TCE rate/day assumption for the 2022-1Q to $19,000 from $19,500 to reflect declines in dry bulk shipping prices at the end of the first quarter. We now project total revenues of $30.3 million and TCE revenues of $28.1 million based on 1500 operating days. We are also factoring in a $1.3 million, nonrecurring, non-cash loss as per company guidance. We  now project adjusted EBITDA for the quarter to be $13.3 million (down from $16.5 million) and adjusted net income to be $4.3 million (down from $6.0 million). The company will report results near the end of May.

Our adjustments to future quarters are less significant, rating is unchanged. We have lowered our TCE rates for the remaining quarters of the year as well. The impact on revenues, cash flow and earnings is fairly muted and does not affect our rating or overall opinion of the company. We continue to rate the shares outperform with a $1.50 per share price target. Our price target equates to a Total Enterprise Value (TEV) multiple of close to 4.0x estimated 2022 EBITDA. While the Cape market remains volatile and financial leverage remains a risk factor, we believe that SHIP is attractive due to high-operating leverage and moves to improve the capital structure. …

This Research is provided by Noble Capital Markets, Inc., a FINRA and S.E.C. registered broker-dealer (B/D).

*Analyst certification and important disclosures included in the full report. NOTE: investment decisions should not be based upon the content of this research summary. Proper due diligence is required before making any investment decision. 

Release – BOWLERO CORP. COMPLETES REDEMPTION OF ALL OUTSTANDING WARRANTS AND PROVIDES AN UPDATE ON ITS SHARE REPURCHASE PROGRAM


BOWLERO CORP. COMPLETES REDEMPTION OF ALL OUTSTANDING WARRANTS AND PROVIDES AN UPDATE ON ITS SHARE REPURCHASE PROGRAM

Research, News, and Market Data on Bowlero

05/19/2022

  • As of 5:00 PM
    New York City time on May 18, 2022, all outstanding publicly and privately
    held warrants have been exercised or redeemed.

  • 2,040 warrants
    were exercised for cash and 14,524,679 warrants were exercised on a
    cashless basis.

  • 4,264,399 Class
    A Shares were issued for the cashless exercise; however, on a fully
    diluted basis, at a share price of $20, the share count would now be lower
    by approximately 2 million shares.

  • Following the
    end of Q3 FY ’22 and through May 11, 2022, the company repurchased 465,667
    shares of Class A common stock for $4,305,750.

RICHMOND, Va., May 19, 2022 (GLOBE NEWSWIRE) — Bowlero Corp. (NYSE:BOWL), (“Bowlero” or the “Company”) today announced the completion of its redemption of all publicly traded warrants (the “Public Warrants”) and privately held warrants (the “Private Warrants”, together with the Public Warrants, the “Warrants”) to purchase shares of the Bowlero’s Class A common stock, par value $0.0001 per share (the “Common Stock”), that were issued under the Warrant Agreement (the “Warrant Agreement”), dated March 2, 2021, by and between the Company and Continental Stock Transfer & Trust Company (“CST”), as warrant agent (“the Warrant Agent”), that remained outstanding at 5:00 p.m. New York City time on May 16, 2022 (the “Redemption Date”), for a redemption price of $0.10 per Warrant.

“By retiring all of the Warrants and continuing our share purchases, we were able to return capital to shareholders, reduce the prospects of future dilution and simplify our capital structure. This was all done in a very cash efficient manner, and is in line with our plans to opportunistically allocate capital to maximize returns for shareholders,” said Brett Parker, President and CFO of Bowlero Corp.

On April 14, 2022, the Company issued a press release stating that, pursuant to the terms of the Warrant Agreement, on the Redemption Date it would redeem all of the outstanding Warrants at a redemption price of $0.10 per Warrant.

Of the 9,137,592 Public Warrants that were outstanding as of the quarter ended on March 27, 2022, 2,040 Public Warrants were exercised for cash at an exercise price of $11.50 per share of Common Stock and 9,126,851 Public Warrants were exercised on a cashless basis in exchange for an aggregate of 2,679,597 shares of Common Stock, in each case in accordance with the terms of the Warrant Agreement, representing approximately 99.9% of the outstanding Public Warrants.

In addition, all 5,397,828 Private Warrants that were outstanding as of the closing of the Business Combination were exercised on a cashless basis in exchange for an aggregate of 1,584,802 shares of Common Stock in accordance with the terms of the Warrant Agreement. Total cash proceeds to the Company generated from exercises of the Public Warrants for cash were approximately $23,000. 8,701 Public Warrants were redeemed by the Company for the redemption price of $0.10 per warrant, for a total of $870.10. Following the Redemption Date, the Company had no Public Warrants or Private Warrants outstanding.

In total, as a result of the completion of the redemption of the Public and Private Warrants, the Company issued 4,264,399 shares of Common Stock for exercise on a cashless basis, in which the exercising holders received 0.2936 shares of Common Stock per warrant exercised. If the Company were to have conducted such redemption when the price of its Common Stock were equal to $20 per share, the Company estimates that it would have had to issue approximately 2 million additional shares of Common Stock for exercise on a cashless basis, assuming that all holders chose to exercise their Warrants on a cashless basis.

The Company also announced that, as of May 11, 2022 it has repurchased 465,667 shares of Common Stock for an average cost of $9.25 or $4,305,750 since the end of its third fiscal quarter ended March 27, 2022 under its previously authorized program for the repurchase of up to an aggregate amount of $200 million of its shares of Common Stock and Warrants, which was announced on February 7, 2022. After the cumulative share and Warrant repurchases, the Company has approximately $189 million remaining under the program.  

The Company will continue to review the authorized share repurchase program and may repurchase additional shares of Common Stock depending upon market conditions, corporate liquidity requirements and priorities, debt agreement limitations and other factors in its sole discretion. The share repurchase program does not obligate the Company to repurchase any particular amount of Common Stock and may be suspended or discontinued at any time without notice.

In connection with the redemption, the Warrants ceased trading on the New York Stock Exchange and were delisted, with the trading halt announced after close of market on May 16, 2022. The Common Stock continues to trade on the New York Stock Exchange under the symbol “BOWL.”

Forward Looking Statements

Some of the statements contained in this press release are forward-looking statements within the meaning of Section 27A of the Securities Act of 1933, as amended, and Section 21E of the Securities Exchange Act of 1934, as amended. These forward-looking statements are generally identified by the use of words such as “anticipate,” “believe,” “could,” “estimate,” “expect,” “intend,” “may,” “plan,” “potential,” “predict,” “project,” “should,” “target,” “will,” “would” and, in each case, their negative or other various or comparable terminology. These forward-looking statements reflect our views with respect to future events as of the date of this release and are based on our management’s current expectations, estimates, forecasts, projections, assumptions, beliefs and information. Although management believes that the expectations reflected in these forward-looking statements are reasonable, it can give no assurance that these expectations will prove to have been correct. All such forward-looking statements are subject to risks and uncertainties, many of which are outside of our control, and could cause future events or results to be materially different from those stated or implied in this document. It is not possible to predict or identify all such risks. These risks include, but are not limited to: the impact of COVID-19 or other adverse public health developments on our business; our ability to grow and manage growth profitably, maintain relationships with customers, compete within our industry and retain our key employees; changes in consumer preferences and buying patterns; the possibility that we may be adversely affected by other economic, business, and/or competitive factors; the risk that the market for our entertainment offerings may not develop on the timeframe or in the manner that we currently anticipate; general economic conditions and uncertainties affecting markets in which we operate and economic volatility that could adversely impact our business, including the COVID-19 pandemic and other factors described under the section titled “Risk Factors” in the registration statement on Form S-1 filed with the U.S. Securities and Exchange Commission (the “SEC”) by the Company, as well as other filings that the Company will make, or has made, with the SEC, such as Annual Reports on Form 10-K, Quarterly Reports on Form 10-Q and Current Reports on Form 8-K. These factors should not be construed as exhaustive and should be read in conjunction with the other cautionary statements that are included in this press release and in other filings. We expressly disclaim any obligation to publicly update or review any forward-looking statements, whether as a result of new information, future developments or otherwise, except as required by applicable law.

No Offer or Solicitation

This press release shall not constitute an offer to sell or the solicitation of an offer to buy any Bowlero securities, and shall not constitute an offer, solicitation or sale in any jurisdiction in which such offer, solicitation or sale would be unlawful.

About Bowlero

Bowlero Corp. is the worldwide leader in bowling entertainment, media, and events. With more than 300 bowling centers across North America, Bowlero Corp. serves more than 26 million guests each year through a family of brands that includes Bowlero, Bowlmor Lanes, and AMF. In 2019, Bowlero Corp. acquired the Professional Bowlers Association, the major league of bowling, which boasts thousands of members and millions of fans across the globe. For more information on Bowlero Corp., please visit BowleroCorp.com.

Contacts:

For Media:
ICR, Inc.


Energy Fuels (UUUU) – UUUU locks up Rare Earth Element Supplies

Friday, May 20, 2022

Energy Fuels (UUUU)
UUUU locks up Rare Earth Element Supplies

Energy Fuels is a leading U.S.-based uranium mining company, supplying U3O8 to major nuclear utilities. Energy Fuels also produces vanadium from certain of its projects, as market conditions warrant, and is ramping up commercial-scale production of REE carbonate. Its corporate offices are in Lakewood, Colorado, near Denver, and all its assets and employees are in the United States. Energy Fuels holds three of America’s key uranium production centers: the White Mesa Mill in Utah, the Nichols Ranch in-situ recovery (“ISR”) Project in Wyoming, and the Alta Mesa ISR Project in Texas. The White Mesa Mill is the only conventional uranium mill operating in the U.S. today, has a licensed capacity of over 8 million pounds of U3O8 per year, has the ability to produce vanadium when market conditions warrant, as well as REE carbonate from various uranium-bearing ores. The Nichols Ranch ISR Project is on standby and has a licensed capacity of 2 million pounds of U3O8 per year. The Alta Mesa ISR Project is also on standby and has a licensed capacity of 1.5 million pounds of U3O8 per year. In addition to the above production facilities, Energy Fuels also has one of the largest NI 43-101 compliant uranium resource portfolios in the U.S. and several uranium and uranium/vanadium mining projects on standby and in various stages of permitting and development. The primary trading market for Energy Fuels’ common shares is the NYSE American under the trading symbol “UUUU,” and the Company’s common shares are also listed on the Toronto Stock Exchange under the trading symbol “EFR.” Energy Fuels’ website is www.energyfuels.com.

Michael Heim, CFA, Senior Research Analyst, Noble Capital Markets, Inc.

Refer to the full report for the price target, fundamental analysis, and rating.

Energy Fuels signed purchase agreements to acquire mineral concessions in Bahia, Brazil believed to include monazite sand, which contains both rare earth elements (REE) and uranium. The project has yet to be mined, but over 3,300 holes have been drilled indicating the presence of monazite. The monazite is close to the surface and should be a low-cost source of supply. The monazite will be shipped to UUUU’s milling operations in the United States where it is developing and expanding REE extraction and separation operations. Management indicated that building a Brazil milling plant is possible, although we do not view that as a near-term project. Energy Fuels will pay $27.5 million for the concessions, an amount easily funded with its $106 million of cash and marketable securities.

Management believes the project could supply 3,000-10,000 per year of monazite containing 1,500-5,000 of total rare earth oxides (TREO). The company had previously stated a goal of eventually producing 10,000 tons of REE annually, implying processing 20,000-25,000 tons of monazite. To date, production ramp up has been hampered by an inability to secure sufficient monazite sand. If management is correct about the potential of the Brazil project, it could represent 25-50% of supply at full production (which we model to be in 2026). As such, the agreement represents a significant step in locking up supply. We expect the company to continue to look to sign additional supply agreements….

This Company Sponsored Research is provided by Noble Capital Markets, Inc., a FINRA and S.E.C. registered broker-dealer (B/D).

*Analyst certification and important disclosures included in the full report. NOTE: investment decisions should not be based upon the content of this research summary. Proper due diligence is required before making any investment decision. 

Cypress Development (CYDVF) – Recent Share Price Weakness Offers Investors an Attractive Entry Point

Friday, May 20, 2022

Cypress Development (CYDVF)
Recent Share Price Weakness Offers Investors an Attractive Entry Point

Mark Reichman, Senior Research Analyst, Natural Resources, Noble Capital Markets, Inc.

Refer to the full report for the price target, fundamental analysis, and rating.

Well positioned to meet growing demand for lithium. Cypress Development is advancing its 100%-owned Clayton Valley Lithium Project near Silver Peak, Nevada. Cypress intends to mine Nevada claystone, produce a high-grade lithium concentrate solution and apply a licensed lithium extraction process based on ion-exchange to produce lithium carbonate or hydroxide. Clayton Valley could go into production as early as 2025, following the completion of a feasibility study by year-end 2022, a two-year permitting period which could begin mid-year 2022, and one-year construction period. We have assumed commercial production commences in 2026.

Enertopia acquisition closed. Cypress Development recently completed its acquisition of Enertopia’s lithium claystone project adjacent and at the northwest end of its own Clayton Valley lithium project. The acquisition adds seventeen unpatented mining claims totaling 160 contiguous acres and will be rolled into Cypress’ own resource model and feasibility study which is expected by year-end 2022. The acquired property could extend the pit outline to the northeast and provide material that could enhance the production schedule in the early years.  …

This Company Sponsored Research is provided by Noble Capital Markets, Inc., a FINRA and S.E.C. registered broker-dealer (B/D).

*Analyst certification and important disclosures included in the full report. NOTE: investment decisions should not be based upon the content of this research summary. Proper due diligence is required before making any investment decision. 

What is an IPO? (In 500 Words or Less)


Initial Public Offerings (IPO) Can be Considered a Ground Floor Opportunity

When a private company, one not yet traded on any stock exchange, first offers shares of its company for purchase, this process is known as an initial public offering (IPO). It is a transfer of ownership which provides a method for the company to raise capital by selling all or part of the business by becoming a publicly traded corporation.

The IPO process is sometimes referred to as “going public.”

To bring a company public through an IPO, management chooses a lead underwriter, often an investment bank. The underwriter provides expertise with the securities (stock shares) registration process and distribution of the shares to the public. The lead underwriter then assembles a group of investment banks and broker-dealers (a syndicate) that is responsible for selling shares of the IPO to institutional and individual investors.

Participating in an IPO

To participate in an IPO, you agree to purchase shares of the stock at the offering price before it trades on the secondary market. Your indication of interest as a potential investor helps set the initial offering price.

Your broker will require standard guidelines to be met to determine if you meet SEC rules to qualify as a “qualified investor.” If you are eligible, you may be asked if you’d like to be signed up for new IPO alerts. 

If an investor has done their own due diligence and has been allocated shares in an IPO, it is important to understand that while they are free to sell shares obtained through an IPO whenever they deem appropriate, many firms will restrict eligibility to participate in future offerings to those that sell within the first several days of trading. The practice of quickly selling IPO shares is known as “flipping,” and it is something most firms discourage.


Considerations

Before investing, be sure to do basic research. This can be challenging because of the lack of information on non-public companies. The company’s preliminary prospectus is provided by the issuer and lead underwriter. It includes information on the company’s management team, target market, competitive landscape, recent financials, who is selling shares in the offering, who currently owns shares, anticipated price range, potential risks, and the number of shares to be issued.

Qualified Investor

The overall guidelines as to who qualifies to participate in IPOs are fairly standard. One way to determine if you may meet the guidelines is by providing confidential information here.

Paul Hoffman

Managing Editor, Channelchek

Suggested Content


Placing a Bid to Own a Public Company


Small-Cap Stocks and How They’re Different


Stay up to date. Follow us:


Bowlero (BOWL) – Cleans Up Capital Structure

Friday, May 20, 2022

Bowlero (BOWL)
Cleans Up Capital Structure

Bowlero Corp. is the worldwide leader in bowling entertainment, media, and events. With more than 300 bowling centers across North America, Bowlero Corp. serves more than 26 million guests each year through a family of brands that includes Bowlero, Bowlmor Lanes, and AMF. In 2019, Bowlero Corp. acquired the Professional Bowlers Association, the major league of bowling, which boasts thousands of members and millions of fans across the globe. For more information on Bowlero Corp., please visit BowleroCorp.com.

Michael Kupinski, Director of Research, Noble Capital Markets, Inc.

Patrick McCann, Research Associate, Noble Capital Markets, Inc.

Refer to the full report for the price target, fundamental analysis, and rating.

Warrants off the books. The company announced that all of its outstanding warrants have been either redeemed or exercised. As of March 31, the company had a total of roughly 14.5 million outstanding warrants, a combination of public and privately held. The company also announced the repurchase of 0.46 million shares since the last quarter-end for roughly $4.3 million.

Cashless Exercise. The company received roughly $23,000 in connection with the exercise of some of the publicly held warrants. However, the vast majority of the warrants were exercised on a cashless basis. In total, the company issued approximately 4.26 million shares for the exercise of the remaining warrants.

This Company Sponsored Research is provided by Noble Capital Markets, Inc., a FINRA and S.E.C. registered broker-dealer (B/D).

*Analyst certification and important disclosures included in the full report. NOTE: investment decisions should not be based upon the content of this research summary. Proper due diligence is required before making any investment decision. 

Is the Move Toward ESG Funds and Sustainability Fading?


Image Credit: Wallumrod (Pexels)


Sustainability and ESG Investing May Not be a Top Priority for those Hiring Portfolio Managers

A few of the winning categories in the stock market over the past two years have fallen from grace. The slide suggests that they had either been overbought or the demand changed for their products; it’s also possible they are now oversold. For example, high tech and disruptive tech were high flyers; they now are underperforming and seem to be “out of the rotation” of where investor money is flowing. Another category that saw money piling into it was ESG (Environmental, Social, Governance). This is a relatively new category that was so much in demand that many new funds were created to capitalize on the flow of cash. Many publicly traded companies even altered their business and their branding to capitalize on the expanded demand for stocks in these funds.

With the overall market declining and investors challenged to find companies on an upswing, are ESG labeled investments still getting attention?


ESG Scores

ESG scores are based on environmental, social, and governance factors that take into account corporate energy use, land use, emissions, employee satisfaction, business practices, and executive compensation. The popularity of funds that invest in ESG ranked companies had escalated as the new administration entered the White House in 2021. This is in part because there were big plans to recover from the pandemic-related slowdown with financial support for green or sustainable projects. ESG funds then experienced large and growing inflows of assets. With the increase in assets and a limited field of stocks to choose from, the category outperformed. As the above-average performance was recognized and reported on, it attracted more assets.

This caused companies that didn’t fit into the category to make changes that would provide them a decent ESG score. The list of acceptable companies from which fund managers can choose is still growing.  This creates a situation where there is an increasing number of names, while the amount going into these funds has slowed.

The ESG ratings themselves are provided by private companies that have earned a reputation in the business. They wield a lot of power as they dictate who can be included in a fund and who cannot. The better-known firms are MSCI (MSCI), the largest ESG rating company, Standard & Poor’s (SPGI) and Sustainalytics, owned by Morningstar (MORN). Investors, including fund managers, use these as a guide to screen stocks for inclusion in ESG and sustainable portfolios.

Performance

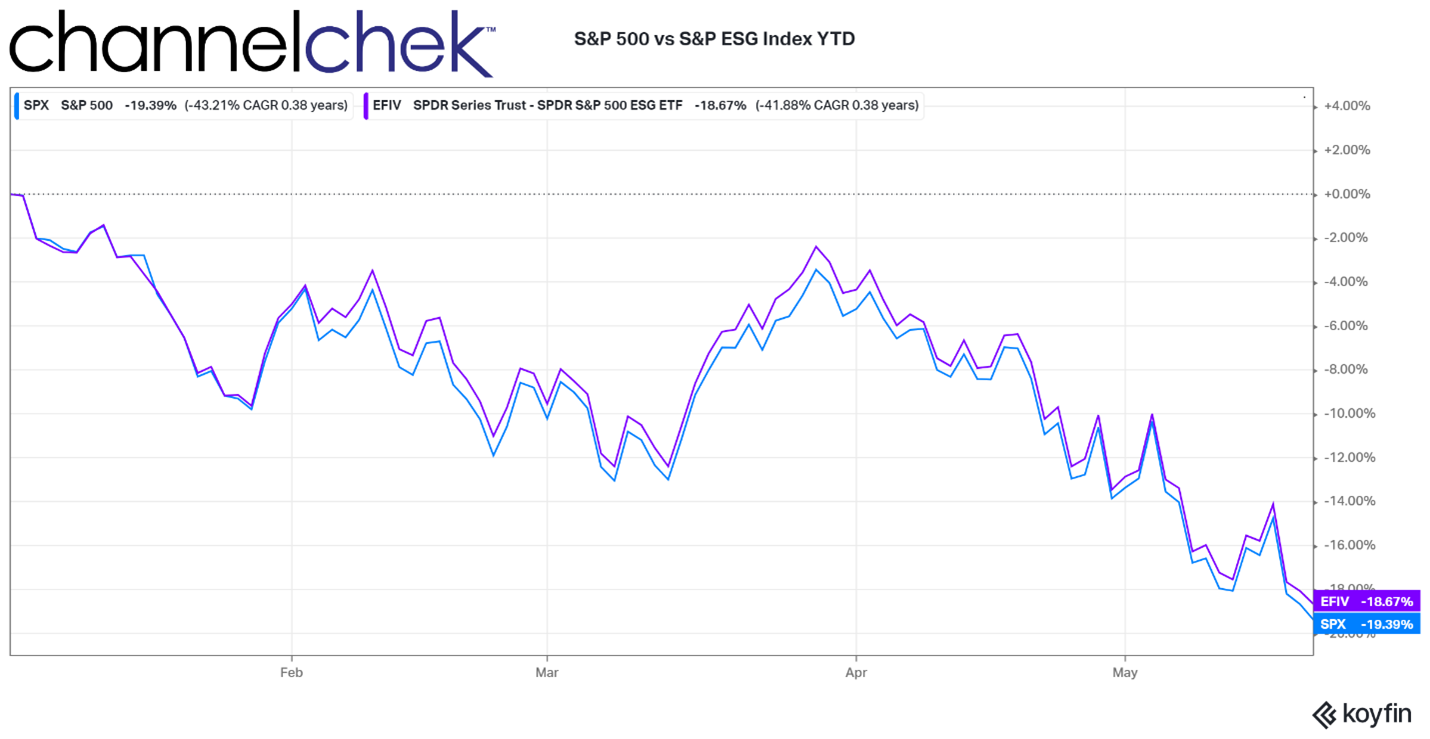
The year-to-date (YTD) S&P ESG Index (308 stocks) and the S&P 500 performance have tracked pretty close since the beginning of the year. There has only been a slight benefit to those earning the ESG index which is down 18.7% vs. 19.4% for the S&P 500.


Source: Koyfin

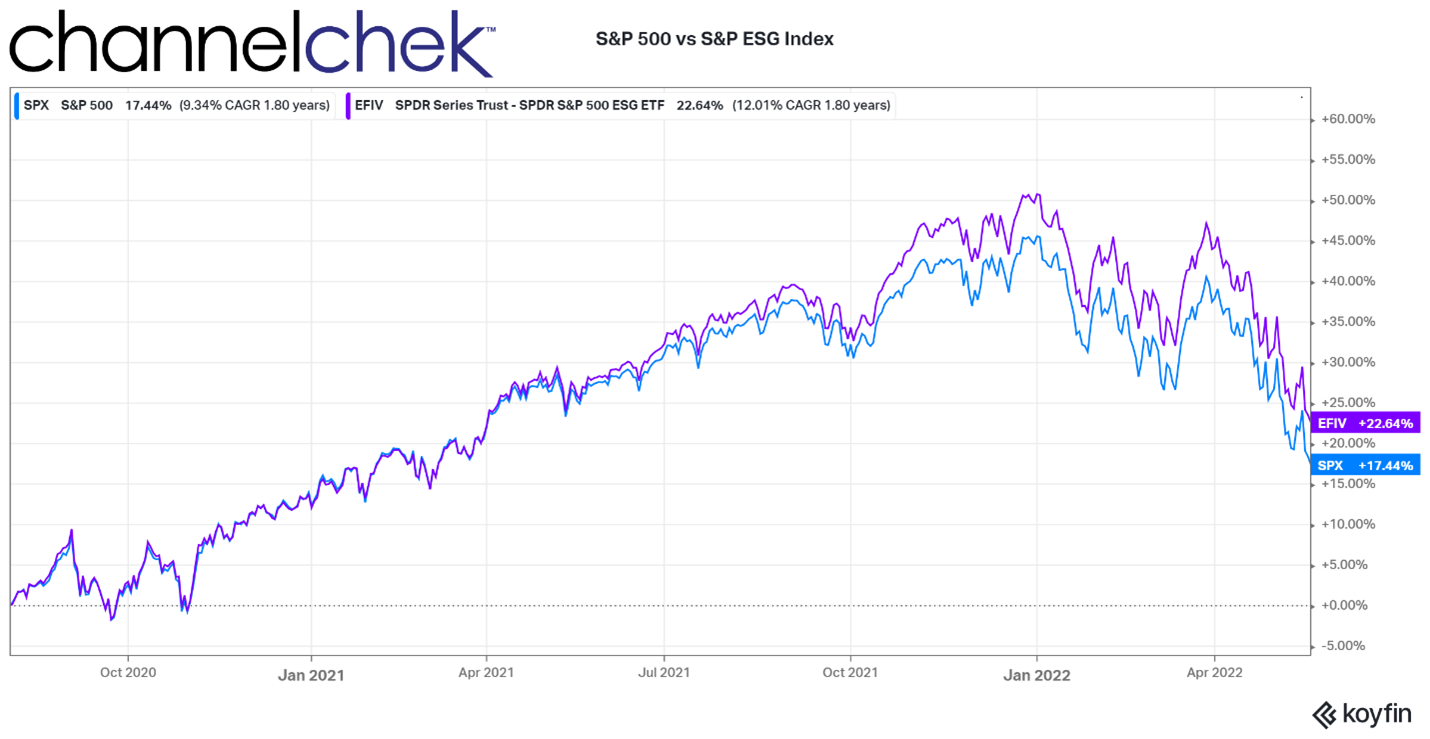
The YTD performance difference of just over 1%  represents a narrowing of the performance spread for the two indexes. As the graph below indicates since August 1, 2021, (one year after launch of the index) there is more than a 5% difference in return, favoring the ESG fund.


Source: Koyfin

Mood Change?

ESG funds and ratings have been under fire in 2022. This is in part related to the attention the Russian invasion of Ukraine brought to the category. Some critics question why ESG-labeled funds own companies such as Russia’s state-backed energy company Gazprom.

In a recent study by Seeward & Kissel they surveyed funds-of-funds, family offices, endowments, seeders, and other investors, the law firm discovered ESG considerations rank low as a priority when hiring managers. The Seeward & Kissel’s 2022 Alternative Investment
Allocator Survey
indicated, that overwhelmingly the main criteria used are investment strategies and a track record of performance.

According to the survey over 40% said ESG and investment team diversity were the least important issues when sourcing portfolio managers. A full 90% answered that investment strategy was the most important factor and track record also ranked high on the list.

Daniel Bresler, a partner at Seeward & Kissel said, “We don’t think ESG is going away anytime soon, but it has been placed on the backburner because of concerns with Ukraine and markets going crazy.” Bresler also indicated he was surprised by the results showing how low the ESG category ranked in importance.

This week’s announcement that Tesla (TSLA) was ineligible and therefore cut from the S&P DJI ESG, has also caused confusion among onlookers who viewed the electric car company as the ESG “poster child.” At the same time, the strong position of Exxon Mobil (XOM) which moved up within the same S&P index has raised questions about methodology.


Take-Away

ESG is maturing and will have its place. The attention it received as the Biden Administration was laying plans for greener projects while helping rebuild infrastructure provided a high level of enthusiasm for the category. The overall market has turned somewhat sour and returns are now a stronger driver than an often misunderstood ESG and sustainability category. Along with the market weakness, the nature of rewarding some companies with a high ESG score and other seemingly less destructive companies with a lower score has reduced enthusiasm.

These perceived problems are likely just part of the growing pains of a category that will likely ebb and flow as the other investment categories, sectors, and companies do.

Paul Hoffman

Managing Editor, Channelchek

Suggested Content


Avoiding the Noise and Focusing on Managing Your Investments


What Would Failure Look Like to Elon Musk if He Buys Twitter?


Can Mining be Green and Sustainable?


The World is Hot Right Now! NobleCon18 Panel Presentation

Sources

https://www.investmentnews.com/major-outflows-hit-most-asset-classes-as-recession-woes-mount-221753

https://etfdb.com/esg-channel/how-long-will-esg-funds-rake-in-capital/

https://www.buyoutsinsider.com/strategy-and-performance-outpace-esg-and-diversity-in-manager-selection-survey-finds/

https://etfgi.com/news/press-releases/2022/04/etfgi-reports-esg-etfs-listed-globally-gathered-net-inflows-7-billion

Stay up to date. Follow us:


Maple Gold Mines (MGMLF) – Stepping Out and Drilling Deep

Friday, May 20, 2022

Maple Gold Mines (MGMLF)
Stepping Out and Drilling Deep

Mark Reichman, Senior Research Analyst, Natural Resources, Noble Capital Markets, Inc.

Refer to the full report for the price target, fundamental analysis, and rating.

Exploration to include deep drilling programs. The joint venture between Maple Gold and Agnico Eagle Mines Limited will increase its 2022 exploration budget by C$4.8 million to support a deep drilling program at the Douay and Joutel Gold projects in Quebec. Goals for the more aggressive step-out and deep drilling program include defining a larger gold system at Douay and extending higher-grade mineralization along the entire past-producing Eagle-Telbel mine trend at Joutel. The deep drilling program is expected to include four to six drill holes and/or drill hole extensions totaling roughly 10,000 meters across Douay and Joutel.

Updating estimates. The C$4.8 million supplemental exploration budget provides additional funding beyond Agnico’s second year JV spending commitment of C$4 million. Therefore, the partners will each contribute C$2.4 million on a pro-rata basis. While our per share estimates are unchanged, we have increased our 2022 and 2023 exploration expenditure estimates to C$10.4 million and C$10.65 million, respectively, from C$8.0 million and C$8.25 million….

This Company Sponsored Research is provided by Noble Capital Markets, Inc., a FINRA and S.E.C. registered broker-dealer (B/D).

*Analyst certification and important disclosures included in the full report. NOTE: investment decisions should not be based upon the content of this research summary. Proper due diligence is required before making any investment decision. 

Is Crumbling Trust in the Financial System Leading to a Flight to Real Assets?


Image Credit: Federal Reserve History


Inflation, War, and Oil: How Today’s Crises Are Rehashing the 1970s

Consumer price inflation has risen to 8.3 percent in April 2022 in the United States and 7.5 percent in the euro area. This raises the question of who is responsible. In the US, President Joe Biden has argued that 70 percent of inflation in March is attributable to Russian president Vladimir Putin. The European Central Bank has suggested that the high inflation should be seen in the context of the pandemic and the Ukraine war. ECB president Christine Lagarde sees steeply rising energy prices as unrelated to the monetary policy of the ECB. But is inflation only due to the war and the pandemic?

According to Milton Friedman, inflation is “always and everywhere a monetary phenomenon” and thereby the responsibility of central banks. Given that in all industrialized countries money supply has for a long time grown much faster than output, the resulting huge monetary overhang should be at the root of rising inflation. Whereas since the turn of the millennium stock and real estate prices have grown fast, consumer price inflation only started picking up in mid-2021, boosted by energy prices. There are five reasons why rising energy prices are linked to the global monetary overhang, which was further strongly increased during the pandemic.

About the Author:

Gunther Schnabl is a professor of international economics and economic policy in the department of economics at Leipzig University, Germany.

First, because of eroding trust in the dollar and the euro, a flight to real assets has set in. Tangible assets include not only real estate and stocks, but also shares in commodity mines and raw materials, including oil and gas. Secondly, the ultraloose monetary policy of the major central banks has—together with expansionary fiscal policies—fueled aggregate demand and thus also demand for energy and raw materials. When corporations—thirdly—assume that the price increases will be permanent, they hoard raw materials, which further increases demand and prices.

Fourth, energy- and commodity-exporting countries hold large dollar and euro reserves, which are devalued by inflation in the US and the euro area. Since they are often oligopolists, energy- and commodity-exporting countries can hedge against this depreciation by raising prices. Recently, some Arab countries have refused to expand the production of oil and natural gas to lower world market prices. Fifth, energy and commodities are predominantly traded in dollars. If the euro depreciates due to the ECB’s ongoing loose monetary policy, prices of raw materials and energy rise in the euro area.

This leads to the question of the extent to which there are parallels with the 1970s, when high and persistent inflation was accompanied by war in the oil-rich Middle East. Global inflationary pressures emerged even before the first oil crisis in 1971, as they are today. Since the second half of the 1960s, the US had financed the Vietnam War and growing social spending partly through the printing press. Inflation was exported to the many countries whose currency was pegged to the dollar. Then as now, energy- and commodity-exporting countries had an incentive to compensate for real losses in the value of their dollar reserves through price increases. This can be seen as the origin of the cartel policy of the Organization of the Petroleum Exporting Countries and the first oil crisis in 1971.

Persistently loose monetary policies always have negative growth and distributional effects that impair political stability. In extreme cases, there are civil wars, as evidenced by the Arab Spring, or there are armed conflicts between countries. The Yom Kippur War in 1971 was—inter alia—triggered by the Egyptian president Anwar el-Sadat’s desire to distract from domestic political tensions. Since 2014, falling oil prices have been depressing growth in Russia. It cannot be ruled out that one of Putin’s major motivations to go to war was securing his power in Russia. Finally, as in the 1970s, the growing international political instability has further increased global inflationary pressure via rising oil and commodity prices.

In the 1970s, inflation only came to an end when, starting in 1979, the new US Federal Reserve chairman Paul Volcker rigorously raised interest rates to 20 percent (Volcker shock). As a result, oil prices started to fall. Both the Fed and the ECB are still far from taking similar steps. The Fed has decisively announced interest rate hikes, but a rise in interest rates above the inflation rate is still a long way off. In the euro area, President Lagarde has kept all options open despite high inflation.

A decisive defense of price stability looks different. This implies that inflationary pressure will persist for longer, particularly in the euro area, as the high level of government debt can be melted down by inflation, helping to financially stabilize the heavily indebted euro area countries. As this process is likely to come along with persistent economic instability, however, the Ukraine crisis may not be the last political crisis in Europe.

Suggested Reading


The Basket of Goods Will Become Financially Heavier


Since 2008, Monetary Policy Has Cost American Savers about $4 Trillion


Money Supply Drives Stock Market Performance


Avoiding the Noise and Focusing on Managing Your Investments


Stay up to date. Follow us:


Release – InPlay Oil Corp. Announces Annual Meeting Voting Results for Election of Directors


InPlay Oil Corp. Announces Annual Meeting Voting Results for Election of Directors

News and Market Data on InPlay Oil Corp


CALGARY, Alberta, May 19, 2022 (GLOBE NEWSWIRE) — InPlay Oil Corp. (TSX: IPO) (OTCQX: IPOOF) (“InPlay” or the “Company”) announced today the voting results for the election of directors at its annual meeting of shareholders held on May 19, 2022 (the “Meeting”). The following five nominees were elected as directors of InPlay to serve until the next annual meeting of shareholders or until their successors are elected or appointed, with common shares represented at the Meeting voting in favour of individual nominees as follows:

Director


Percentage Approval


Percentage Withheld


Douglas J. Bartole


99.8

%


0.2

%

Joan E. Dunne


99.6

%


0.4

%

Craig Golinowski


99.5

%


0.5

%

Stephen C. Nikiforuk


99.7

%


0.3

%

Dale O. Shwed


99.4

%


0.6

%


For complete voting results, please see our Report of Voting Results which is available through SEDAR at www.sedar.com.

InPlay is based in Calgary, Alberta and the common shares of InPlay are traded on The Toronto Stock Exchange under the trading symbol “IPO”. For further information about the Corporation, please visit our website at www.inplayoil.com.

For further information please contact:

Doug Bartole
President and Chief Executive Officer
InPlay Oil Corp.
Telephone: (587) 955-0632


Darren Dittmer
Chief Financial Officer
InPlay Oil Corp.
Telephone: (587) 955-0634