The Choppy Road to Tomorrows Energy Solutions


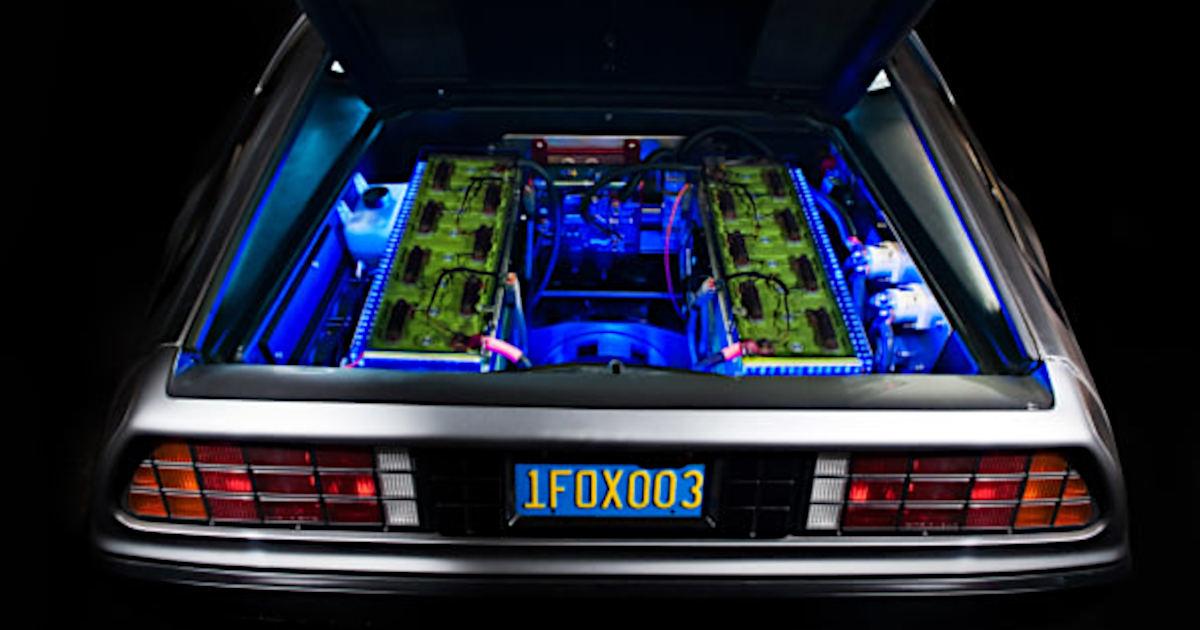
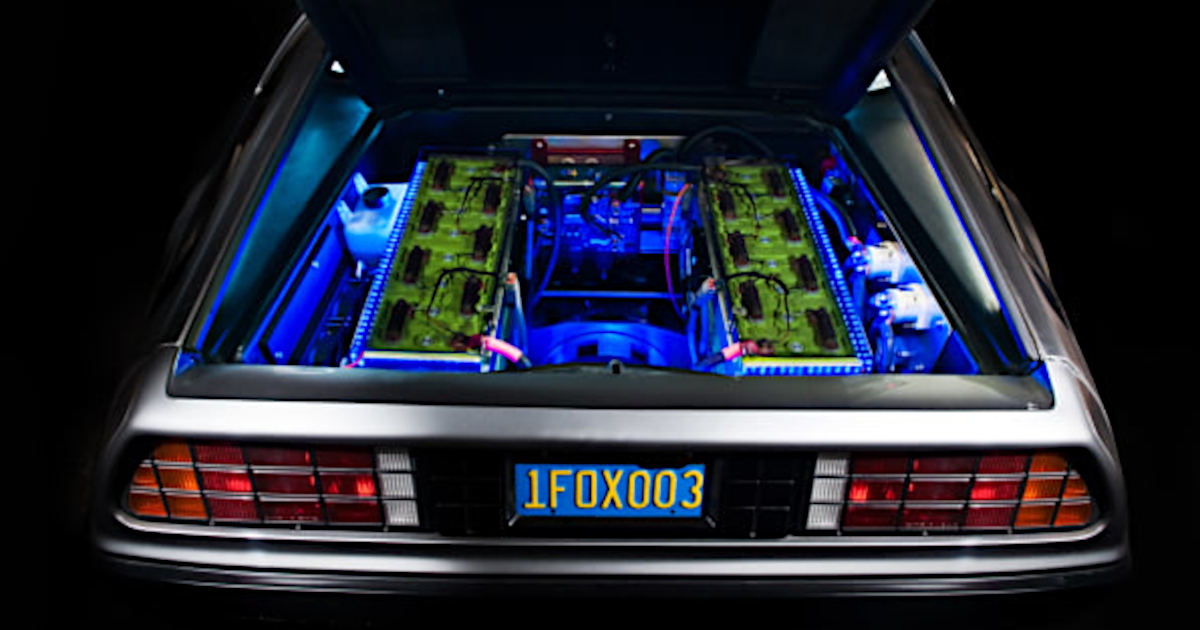
Image Credit: The Pop Culture Geek Network (Flickr)

How Troubling Energy Shortages Could Be Handled in a Few Short Years


Last week we reported that five
gas-powered
generating plants would be added to California’s electric grid. During the prior week, the headlines read the White House called on OPEC to pump
more oil
to help reduce gasoline prices.  Both of these were met by many with shock, or at a minimum, confusion. After all, California had been aggressively reducing its reliance on fossil fuels for power generation, and the U.S. had become more-or-less energy independent four or five years ago. Strangely, if supply was a problem last year, it was because there was a massive glut of oil — so large that there was essentially no place to store the commodity.


Change of Path?

There was a good reason for each of these diversions from the stated plan. There aren’t too many things that move in a straight line, there will always be bumps along the way. Think about the last stock you held that did well over a long period of time, were there down days?  Sure. Did this mean a change of overall direction? No.

What it does mean in the above cases is that there is some trial and error and unforeseen factors that will come up that aren’t counted on. In the case of California, an exceedingly dry summer has left many of the dams unable to create power via hydroelectric generators. As for the plea for OPEC to help us with our rising gasoline prices, the demand has been so uneven, due to pandemic-related economic gyrations, that it should come as little surprise that there are large imbalances.

Just in Time Solutions

As the current energy initiatives, new technology, and proposed “greener” solutions unfold, there will be new ways, even better solutions to quickly overcome unexpected shortfalls of energy.

One that may soon be a reality is the “nuclear battery.” The nuclear battery or microreactor is a proposed system that could have more quickly assisted California with its problem. The natural gas-powered generating ability that is now being installed will take just over a month to be up and running. However, we were told this is a temporary solution. The microreactor as envisioned, could install in the same or fewer days then run unattended for five or ten years. Similarly, these shipping container-sized, uranium-powered, generators could reduce oil consumption from electric generation allowing imbalances in petroleum demand to be corrected for without calling upon foreign nations.

The flexibility in power that the future holds will be necessary. As demonstrated in California (and last year’s Texas freeze), relying on nature is a risky proposition; having acceptable, just-in-time solutions available reduces this risk.

Take-Away

New power generating designs and technology rely on many non-fossil fuel solutions. Part of the growing need is flexibility, another is the consistency of nuclear generation and the flexibility being designed in new options.

The number of ways the future may include uranium as a power source is increasing.  Add microreactors to the list — they could be well suited to provide for the needs of industry and many other sectors of the economy by producing a steady, dependable source of carbon-free electricity.


Noble Capital Markets Uranium Power Players Investor Forum – August 31, 2021 Starting at 9am EDT

The Noble Uranium Power Players Investor Forum is a virtual conference bringing together leading companies involved in the exploration and production of uranium.

Registration is fast and free.


Sources:

Nuclear
Powers New Paradigm Includes Microreactors

Traditional
Energy Resources Have Been Shrinking

Contango
and the Unknown Risks to ETFs

California
to Add Five Natural Gas Power Plants


Stay up to date. Follow us:


Release – Ceapro Inc. Reports 2021 Second Quarter and Six-Month Financial Results and Operational Highlights


Ceapro Inc. Reports 2021 Second Quarter and Six-Month Financial Results and Operational Highlights


– Company continues to increase R&D activities to advance clinical and preclinical programs 

– Second quarter sales of $4,409,000 compared to $4,666,000 for second quarter 2020 –

– Cash generated from operations of $2,128,000 in Q2 2021 compared to $2,195,000 in Q2 2020 –

 Maintained production operations during COVID-19 pandemic, providing customers with essential products while ensuring the health and safety of our employees –

EDMONTON, Alberta, Aug. 26, 2021 (GLOBE NEWSWIRE) — Ceapro Inc. (TSX-V: CZO; OTCQX: CRPOF) (“Ceapro” or the “Company”), a growth-stage biotechnology company focused on the development and commercialization of active ingredients for healthcare and cosmetic industries, today announced financial results and operational highlights for the second quarter and six months ended June 30, 2021.

“Progress continues on all fronts from production operations to research and development, allowing us to advance our pipeline while expanding our business model. With our newly formed network of highly renowned experts from University of Alberta, McMaster University, the Montreal Heart Institute, and the Angiogenesis Foundation, we have implemented a comprehensive strategic research plan that we believe enables us to address immune/inflammation-based and lifestyle diseases at various stages and from all angles. Additionally, with upcoming results expected in the fourth quarter of this year for Ceapro’s very first clinical trial, I believe we are well positioned for the next steps in becoming a premier life sciences company. The Company has exciting things on the horizon and we are committed to building on momentum,” stated Gilles Gagnon, M.Sc., MBA, President and CEO.

Corporate and Operational Highlights

Pipeline Development:

  • Announced successful completion of collaborative research and development program with University of Alberta. The program developed several new chemical complexes as potential delivery systems and demonstrated the possibility of drying peptides using Pressurized Gas eXpanded (PGX) Technology.
  • Initiated bioavailability studies with University of Alberta for new chemical complexes yeast beta glucan-CoQ10 and alginate-CoQ10.
  • Resumed research activities with McMaster University to develop an inhalable therapeutic for COVID-19 using yeast beta glucan.
  • Completed patient enrollment in clinical study evaluating beta glucan as a cholesterol-lowering agent. Last patient last visit is expected by end of September 2021, followed by locking of data base, unblinding of the study and topline results expected in Q4 2021.

Technology:

  • Pursued technical upgrades of PGX demo plant in Edmonton including initiation of commercial scale up of impregnation unit to produce chemical complexes.
  • Initiated engineering design for PGX commercial scale unit. Final decision on the type and location of future commercial scale PGX unit to be announced during Q4 2021.

Production Operations:

  • Successfully passed thorough audits conducted by two major customers for the Edmonton facility, which is now housing all production operations for the Company.

Corporate:

  • Pursued out-licensing discussions for PGX-processed new chemical complexes.

Subsequent to Quarter:

  • Announced research agreement with Montreal Heart Institute for a Phase 1 clinical trial assessing safety and tolerability of pharmaceutical grade avenanthramides.
  • Announced research agreement with Boston-based Angiogenesis Foundation to assess in vivo bioefficacy of oat beta glucan and avenanthramides in angiogenesis, blood vessel repairs, wound healing and tissue regeneration in various inflammation-based diseases and conditions like COVID-19 presenting damages of the lung blood vessels.

Financial Highlights for the Second Quarter and the Six-Month Period Ended June 30, 2021

  • Total sales of $4,409,000 for the second quarter of 2021 and $9,110,000 for the first six months of 2021 compared to $4,666,000 and $8,939,000 for the comparative periods in 2020.

    Sales being made in USA dollars and then reported in CDN dollars, it is noteworthy to look at the impact of the exchange rate (USD/CDN) from year to year. In fact, the Company has recorded respective sales in USD of $3.6M and USD $7.3M for the second quarter and the first six months of 2021 as compared to USD $3.4M and USD $6.5M for the comparative periods of 2020, representing a year-to-date effective increase of 12% in 2021.
  • Net profit of $676,000 for the second quarter of 2021 and $1,191,000 for the first six months of 2021 compared to a net profit of $1,077,000 and $2,203,000 for the comparative periods in 2020.

  • Cash flows generated from operations of $2,433,000 for the first six months of 2021 vs $2,727,000 in 2020.

  • Positive working capital balance of $9,303,000 as of June 30, 2021.

“The ability of our business to successfully navigate through the challenging second quarter business environment is a testament to the commitment and hard work of our dedicated employees, and a measurable indication of the operational improvements generated by our strategic investments of the past few years,” continued Mr. Gagnon. “Looking ahead, while considering the ongoing potential economic impact related to the new surge of COVID-19, we believe Ceapro is well-positioned to once again deliver solid growth in 2021. With a strong and very clean balance sheet, a group of dedicated people, and a solid base business coupled with the innovative technologies and products that we have developed to enable us to expand, Ceapro is poised to emerge as a successful life science company.”

CEAPRO INC.    
Consolidated Balance Sheets    
Unaudited    
     
  June 30, December 31,
  2021 2020
  $ $
     
ASSETS    
Current Assets    
Cash and cash equivalents 7,269,428 5,369,029
Trade receivables 1,801,568 2,019,723
Other receivables 45,913 102,224
Inventories (note 3) 1,168,163 1,210,079
Prepaid expenses and deposits 236,932 348,845
     
  10,522,004 9,049,900
Non-Current Assets    
Investment tax credits receivable 607,700 607,700
Deposits 82,124 82,124
Licences (note 4) 17,032 18,514
Property and equipment (note 5) 18,029,316 18,591,189
Deferred tax assets 874,304 874,304
     
  19,610,476 20,173,831
     
TOTAL ASSETS 30,132,480 29,223,731
     
LIABILITIES AND EQUITY    
Current Liabilities    
Accounts payable and accrued liabilities 857,731 1,067,622
Current portion of lease liabilities (note 6) 283,204 250,658
Current portion of CAAP loan (note 8) 77,855 72,263
     
  1,218,790 1,390,543
Non-Current Liabilities    
Long-term lease liabilities (note 6) 2,505,623 2,648,917
Deferred tax liabilities 874,304 874,304
     
  3,379,927 3,523,221
     
TOTAL LIABILITIES 4,598,717 4,913,764
     
Equity    
Share capital (note 7 (b)) 16,555,619 16,511,067
Contributed surplus (note 7 (e)) 4,670,289 4,682,393
Retained earnings 4,307,855 3,116,507
     
  25,533,763 24,309,967
     
TOTAL LIABILITIES AND EQUITY 30,132,480 29,223,731


CEAPRO INC.        
Consolidated Statements of Net Income and Comprehensive Income
Unaudited        
     
     
  Quarters Ended June 30,   Six Months Ended June 30,
  2021   2020   2021   2020
  $   $   $   $
         
Revenue (note 14) 4,408,631   4,665,971   9,110,374   8,939,345
Cost of goods sold 1,770,153   2,079,270   4,213,953   3,980,493
         
Gross margin 2,638,478   2,586,701   4,896,421   4,958,852
         
Research and product development 830,511   399,797   1,647,358   902,339
General and administration 952,847   838,263   1,665,054   1,703,297
Sales and marketing 16,362   29,207   29,600   77,435
Finance costs (note 11) 38,344   44,583   132,254   146,192
         
Income from operations 800,414   1,274,851   1,422,155   2,129,589
         
Other (expenses) income (note 10) (123,942 ) (197,812 ) (230,807 ) 73,505
         
Income before tax 676,472   1,077,039   1,191,348   2,203,094
         
Income taxes      
         
Total comprehensive income for the period 676,472   1,077,039   1,191,348   2,203,094
         
Net income per common share (note 17):        
Basic 0.01   0.01   0.02   0.03
Diluted 0.01   0.01   0.02   0.03
         
Weighted average number of common shares outstanding (note 17):        
Basic 77,673,832   77,608,341   77,662,495   77,573,327
Diluted 78,684,303   77,980,876   78,684,344   77,930,529


CEAPRO INC.    
Consolidated Statements of Cash Flows    
Unaudited    
     
     
  2021   2020  
Six Months Ended June 30, $   $  
OPERATING ACTIVITIES    
Net income for the period 1,191,348   2,203,094  
Adjustments for items not involving cash    
Finance costs 71,662   79,674  
Transaction costs   1,108  
Depreciation and amortization 937,356   920,521  
Accretion 5,592   10,410  
Share-based payments 6,828   108,147  
Net income for the period adjusted for non-cash items 2,212,786   3,322,954  
CHANGES IN NON-CASH WORKING CAPITAL ITEMS    
Trade receivables 218,155   600,990  
Other receivables 56,311   (43,599 )
Inventories 41,916   (592,489 )
Prepaid expenses and deposits 51,179   (33,088 )
Accounts payable and accrued liabilities relating to operating activities (75,337 ) (448,200 )
Total changes in non-cash working capital items 292,224   (516,386 )
         
Net income for the period adjusted for non-cash and working capital items 2,505,010   2,806,568  
Interest paid (71,662 ) (79,674 )
CASH GENERATED FROM OPERATIONS 2,433,348   2,726,894  
INVESTING ACTIVITIES    
Purchase of property and equipment (277,062 ) (38,230 )
Purchase of leasehold improvements (19,472 )  
Deposits relating to investment in equipment (16,733 ) (50,203 )
Accounts payable and accrued liabilities relating to investing activities (134,554 )  
CASH USED IN INVESTING ACTIVITIES (447,821 ) (88,433 )
FINANCING ACTIVITIES    
Stock options exercised 25,620    
Repayment of long-term debt   (97,507 )
Repayment of lease liabilities (110,748 ) (130,829 )
CASH USED IN FINANCING ACTIVITIES (85,128 ) (228,336 )
Increase in cash and cash equivalents 1,900,399   2,410,125  
     
Cash and cash equivalents at beginning of the period 5,369,029   1,857,195  
     
Cash and cash equivalents at end of the period 7,269,428   4,267,320  
     

The complete financial statements are available for review on SEDAR at https://sedar.com/Ceapro and on the Company’s website at www.ceapro.com.

About Ceapro Inc.

Ceapro Inc. is a Canadian biotechnology company involved in the development of proprietary extraction technology and the application of this technology to the production of extracts and “active ingredients” from oats and other renewable plant resources. Ceapro adds further value to its extracts by supporting their use in cosmeceutical, nutraceutical, and therapeutics products for humans and animals. The Company has a broad range of expertise in natural product chemistry, microbiology, biochemistry, immunology and process engineering. These skills merge in the fields of active ingredients, biopharmaceuticals and drug-delivery solutions. For more information on Ceapro, please visit the Company’s website at www.ceapro.com.

For more information contact:

Jenene Thomas
JTC Team, LLC
Investor Relations and Corporate Communications Advisor
T (US): +1 (833) 475-8247
E: czo@jtcir.com

Neither TSX Venture Exchange nor its Regulation Services Provider (as that term is defined in the policies of the TSX Venture Exchange) accepts responsibility for the adequacy or accuracy of this release.

Source: Ceapro Inc.

Release – Comtech Telecommunications Corp. Awarded $2.1 Million of Funding


Comtech Telecommunications Corp. Awarded $2.1 Million of Funding for EEE Parts Management, Procurement and Engineering Services


MELVILLE, N.Y.–(BUSINESS WIRE)–Aug. 26, 2021– 
August 26, 2021— 
Comtech Telecommunications Corp. (NASDAQ: CMTL), a leading global provider of next-generation 911 emergency systems and secure wireless communications technologies, announced today, that during its fourth quarter of fiscal year 2021, it was awarded 
$2.1 million of additional funding from a major 
U.S. prime contractor in support of NASA’s Space Launch System (“SLS”) 
Control System Electronics. The contract consolidates requirements for high reliability electrical, electronic and electromechanical (“EEE”) parts and engineering services. The total contract value is now 
$10.3 million and fully funded.

“This most recent award demonstrates that our customer continues to recognize the unique value of Comtech’s space level electronic parts supply chain management and engineering services expertise for this critical manned space program,” said  Fred Kornberg, Chairman of the Board and Chief Executive Officer of 
Comtech Telecommunications Corp.

The contract was awarded to Comtech’s Space & Component Technology (“SCT”) division, which specializes in ground station systems and life cycle management, as well as the supply of high reliability microelectronics (“EEE parts”) for use in satellite, launch vehicle and manned space applications.

Satellite tracking antennas are manufactured from 30cm to 13m, as well as RF feeds, radomes and carbon fiber reflectors, for LEO, MEO and GEO orbits, for customers worldwide, for all frequency bands. This encompasses all aspects of use including requirements definition and analysis, design, development, and integration of turnkey systems from antenna to data processing, civil works and construction, software, station installation and verification, operations and maintenance, and decommissioning at end of life. For more information, visit www.comtechspace.com.

Comtech Telecommunications Corp. is a leading global provider of next-generation 911 emergency systems and secure wireless communications technologies to commercial and government customers around the world. Headquartered in 
Melville, New York and with a passion for customer success, 
Comtech designs, produces and markets advanced and secure wireless solutions to customers in more than 100 countries. For more information, please visit www.comtechtel.com.

Certain information in this press release contains statements that are forward-looking in nature and involve certain significant risks and uncertainties. Actual results could differ materially from such forward-looking information. The Company’s 
Securities and Exchange Commission filings identify many such risks and uncertainties. Any forward-looking information in this press release is qualified in its entirety by the risks and uncertainties described in such 
Securities and Exchange Commission filings.

Comtech Investor Relations:
631-962-7005
investors@comtech.com

Source: 
Comtech Telecommunications Corp.

Release – Gevo Files for Environmental Permits in South Dakota for the Net-Zero 1 Project


Gevo Files for Environmental Permits in South Dakota for the Net-Zero 1 Project


ENGLEWOOD, Colo., Aug. 26, 2021 (GLOBE NEWSWIRE) — Gevo, Inc. (NASDAQ: GEVO) is pleased to announce that the air quality and wastewater permit applications for the company’s Net-Zero 1 project have been filed with the South Dakota Department of Agriculture & Natural Resources.

“These permit applications are on schedule and represent the first of the permits necessary for the construction of Net-Zero 1,” commented Dr. Chris Ryan, Gevo’s President and Chief Operating Officer. “We are happy to work closely with Pinnacle Engineering, a world-class engineering firm known for specializing in environmental permitting, to draft our permits. These combined efforts are focused on minimizing environmental impact and establishing the lowest CI (Carbon Intensity) score possible,” continued Dr. Ryan.

“It’s a pleasure to work with the Gevo team and we look forward to our continued collaborations on this exciting project,” stated Steve Schleicher, Pinnacle Engineering, Partner and Vice President, Industrial Services.

About Gevo

Gevo’s mission is to transform renewable energy and carbon into energy-dense liquid hydrocarbons. These liquid hydrocarbons can be used for drop-in transportation fuels such as gasoline, jet fuel and diesel fuel, that when burned have potential to yield net-zero greenhouse gas emissions when measured across the full life cycle of the products. Gevo uses low-carbon renewable resource-based carbohydrates as raw materials, and is in an advanced state of developing renewable electricity and renewable natural gas for use in production processes, resulting in low-carbon fuels with substantially reduced carbon intensity (the level of greenhouse gas emissions compared to standard petroleum fossil-based fuels across their life cycle). Gevo’s products perform as well or better than traditional fossil-based fuels in infrastructure and engines, but with substantially reduced greenhouse gas emissions. In addition to addressing the problems of fuels, Gevo’s technology also enables certain plastics, such as polyester, to be made with more sustainable ingredients. Gevo’s ability to penetrate the growing low-carbon fuels market depends on the price of oil and the value of abating carbon emissions that would otherwise increase greenhouse gas emissions. Gevo believes that its proven, patented technology enabling the use of a variety of low-carbon sustainable feedstocks to produce price-competitive low-carbon products such as gasoline components, jet fuel and diesel fuel yields the potential to generate project and corporate returns that justify the build-out of a multi-billion-dollar business.

Gevo believes that the Argonne National Laboratory GREET model is the best available standard of scientific-based measurement for life cycle inventory or LCI.

Learn more at Gevo’s website: www.gevo.com

Forward-Looking Statements

Certain statements in this press release may constitute “forward-looking statements” within the meaning of the Private Securities Litigation Reform Act of 1995. These forward-looking statements relate to a variety of matters such as, without limitation, statements regarding Pinnacle Engineering; the Net-Zero 1 project, including the permits necessary for the Net-Zero 1 project, whether Gevo will receive the permits, Gevo’s ability to produce products with a “net-zero” greenhouse gas footprint; Gevo’s plans and strategy and other statements that are not purely statements of historical fact. These forward-looking statements are made on the basis of the current beliefs, expectations and assumptions of the management of Gevo and are subject to significant risks and uncertainty. Investors are cautioned not to place undue reliance on any such forward-looking statements. All such forward-looking statements speak only as of the date they are made, and Gevo undertakes no obligation to update or revise these statements, whether as a result of new information, future events or otherwise. Although Gevo believes that the expectations reflected in these forward-looking statements are reasonable, these statements involve many risks and uncertainties that may cause actual results to differ materially from what may be expressed or implied in these forward-looking statements. For a further discussion of risks and uncertainties that could cause actual results to differ from those expressed in these forward-looking statements, as well as risks relating to the business of Gevo in general, see the risk disclosures in the Annual Report on Form 10-K of Gevo for the year ended December 31, 2020, and in subsequent reports on Forms 10-Q and 8-K and other filings made with the U.S. Securities and Exchange Commission by Gevo.

Investor and Media Contact

+1 720-647-9605

IR@gevo.com

Release – 1-800-FLOWERS.COM Inc. Reports Record Revenues for its Fiscal 2021 Fourth Quarter and Full Year


1-800-FLOWERS.COM, Inc. Reports Record Revenues for its Fiscal 2021 Fourth Quarter and Full Year; Company Guides to Continued Double-Digit Revenue Growth in its Current Fiscal 2022 Full Year


Fourth Quarter Highlights:

  • Total Net Revenues increased 16.5 percent to $487.0 million, compared with $418.0 million in the prior year period.
  • Net Income and Adjusted Net Income1 was $13.3 million, or $0.20 per diluted share, compared with Net Income of $9.8 million, or $0.15 per diluted share, and Adjusted Net Income1 of $15.1 million, or $0.23 per diluted share in the prior year period.
  • Adjusted EBITDA1 was $30.2 million, compared with $32.5 million in the prior year period, primarily reflecting historically low digital marketing rates related to the onset of the COVID-19 pandemic in the prior year period.

Full Year Highlights:

  • Total Net Revenues increased 42.5 percent to a record $2.12 billion, compared with $1.49 billion in the prior year, reflecting strong growth across the Company’s three business segments.
  • Net Income was $118.7 million, or $1.78 per diluted share, compared with Net Income of $59.0 million, or $0.89 per diluted share, in the prior year period. Adjusted Net Income1 increased 88.6 percent to $122.6 million, or $1.84 per diluted share, compared with $65.0 million, or $0.98 per diluted share, in the prior year.
  • Adjusted EBITDA1 increased 64.5 percent to a record $213.1 million, compared with $129.5 million in the prior year.

(1 Refer to “Definitions of Non-GAAP Financial Measures” and the tables attached at the end of this press release for reconciliation of Non-GAAP (“Adjusted”) results to applicable GAAP results.)

JERICHO, N.Y.–(BUSINESS WIRE)– 1-800-FLOWERS.COM, Inc. (NASDAQ: FLWS), a leading e-commerce provider of products and services designed to inspire more human expression, connection, and celebration, today reported results for its Fiscal 2021 fourth quarter and full year ended June 27, 2021.

Chris McCann, CEO of 1-800-FLOWERS.COM, Inc., said, “We are very proud of our record top and bottom-line results for fiscal 2021. These achievements, in what was both an incredibly dynamic and challenging year, reflect the dedication of our associates across the Company who worked diligently to overcome the unprecedented hurdles of the global pandemic to help millions of customers stay connected and express themselves to the important people in their lives.” For the year, McCann noted that the Company had achieved a significant milestone, surpassing 
$2 billion in revenues and it expects to continue to drive sustainable, long-term revenue growth, as well as strong cash flows, both organically and through strategic acquisitions that can help expand its unique ecommerce platform. “Our guidance for double-digit revenue growth in fiscal 2022 is based on several factors, including the significant shift of consumers to ecommerce shopping, which we anticipate will continue, the tremendous growth and positive behaviors we have seen in our customer files and our significantly expanded product offering.”

McCann said the Company’s customer file grew at an unprecedented level in fiscal 2021 with new-to-file customers increasing 62 percent, adding more than 6.5 million new customers, and helping to bring the Company’s 12-month active customer file to approximately 14 million. “Equally important,” he said, “was that, even with strong new customer growth, existing customers represented approximately 64 percent of our total revenue in fiscal 2021.”

“Looking ahead into fiscal 2022, we will continue to focus on engaging with our customers through increasingly personalized content, enhanced customer care initiatives, and a growing range of experiential programs designed to deepen our relationships and build a true customer community,” he said.

Fiscal 2021 Fourth Quarter Results:

For the fourth quarter of 2021, total net revenues increased 16.5 percent to 
$487.0 million compared with 
$418.0 million in the prior year period. Excluding contributions from PersonalizationMall.com®, which the Company acquired in August of 2020, total revenue for the quarter increased 3.8 percent. Revenues for the quarter increased 87.7 percent compared with total revenues of 
$259.4 million in the fourth quarter of fiscal 2019.

Gross profit margin for the quarter increased 20 basis points to 40.7 percent, compared with gross profit margin of 40.5 percent in the prior year period. Operating expenses as a percent of total revenues improved 10 basis points to 37.5 percent, compared with 37.6 percent in the prior year period. Excluding the impact of the Company’s non-qualified deferred 401k compensation plan and, in fiscal 2020, the costs associated with the closing of its Harry & David® retail stores and its acquisition of PersonalizationMall.com, operating expenses as a percentage of total revenues increased 180 basis points to 37.2 percent compared with 35.4 percent in the prior year. This reflects higher digital marketing and advertising rates compared with the prior year period.

As a result, Adjusted EBITDA1 for the quarter was 
$30.2 million compared with 
$32.5 million in the prior year period. Net Income and Adjusted Net Income1 for the quarter was 
$13.3 million, or 
$0.20 per diluted share, compared with Net Income of 
$9.8 million, or 
$0.15 per diluted share and Adjusted Net Incomeof 
$15.1 million, or 
$0.23 per diluted share in the prior year period.

Fiscal 2021 Full Year Results:

Total net revenues for the full year increased 42.5 percent to 
$2.12 billion, compared with 
$1.49 billion in the prior year, reflecting strong growth across the Company’s three business segments as well as contributions from PersonalizationMall.com which the Company acquired in August of 2020. Excluding the contribution from PersonalizationMall.com, total net revenues grew 26.6 percent compared with the prior year. Gross profit margin for the year increased 40 basis points to 42.2 percent, compared with 41.8 percent in the prior year. Operating expense as a percent of total revenues improved 120 basis points to 35.2 percent, compared with 36.4 percent in the prior year. Excluding the impact of the Company’s non-qualified deferred 401k compensation plan and costs associated with the closing of its Harry & David retail stores and its acquisition of PersonalizationMall.com, operating expenses as a percentage of total revenues improved 110 basis points to 34.7 percent compared with 35.8 percent in the prior year. Strong revenue growth and enhanced operating leverage resulted in Adjusted EBITDA1 growth of 64.5 percent to 
$213.1 million, compared with 
$129.5 million in the prior year. Net Income for the year was 
$118.7 million, or 
$1.78 per diluted share, compared with 
$59.0 million, or 
$0.89 per diluted share, in the prior year. Adjusted Net Income1 for the year was 
$122.6 million, or 
$1.84 per diluted share, compared with 
$65.0 million, or 
$0.98 per diluted share in the prior year.

SEGMENT RESULTS:

The Company provides fiscal 2021 fourth quarter and full year selected financial results for its Gourmet Foods and Gift Baskets, Consumer Floral and Gifts, and BloomNet® segments in the tables attached to this release and as follows:

  • Gourmet Foods and Gift Baskets: Revenue for the quarter was 
    $152.2 million, down 1.1 percent compared with the prior year period. Revenue for the quarter was up 110.0 percent compared to the same period in the Company’s fiscal 2019 fourth quarter. Gross profit margin was 38.9 percent, down 160 basis points, compared with 40.5 percent in the prior year period. Segment contribution margin was 
    $4.2 million, down 58.4 percent compared with 
    $10.1 million in the prior year period and down 72.5 percent compared with adjusted contribution margin of 
    $15.3 million in the prior year period. This primarily reflected higher year-over-year marketing rates as well as higher labor and shipping costs. For the year, revenue in this segment increased 21.6 percent to 
    $955.6 million, compared with 
    $785.5 million in the prior year. Gross profit margin for the year increased 40 basis points to 42.9 percent, compared with 42.5 percent in the prior year. As a result of these factors, along with leveraging operating expenses, adjusted segment contribution margin1 for the year increased 28.6 percent to 
    $148.9 million, compared with 
    $115.8 million in the prior year.
  • Consumer Floral & Gifts: Revenues for the quarter increased 27.2 percent to 
    $297.7 million, compared with 
    $234.1 million in the prior year period. This primarily reflects the contributions from PersonalizationMall.com, which the Company acquired in August of 2020, combined with growth for the Mother’s Day holiday period. Excluding the contributions from PersonalizationMall.com, growth in this segment was 4.4 percent for the quarter. Revenue for the quarter, excluding PersonalizationMall.com, was up 53.0 percent compared to the same period in the Company’s fiscal 2019 fourth quarter. Gross profit margin increased 120 basis points to 41.1 percent, compared with 39.9 percent in the prior year period. Segment contribution margin1 increased 5.8 percent to 
    $41.2 million, compared with 
    $39.0 million in the prior year period. For the year, revenues increased 72.8 percent to 
    $1.03 billion, compared with 
    $593.2 million in the prior year. Excluding contributions from PersonalizationMall.com, revenue in this segment grew 33.0 percent for the year. Gross margin increased 170 basis points to 41.1 percent compared with 39.4 percent in the prior year. Segment contribution margin1 increased 74.3 percent to 
    $128.6 million, compared with 
    $73.8 million in the prior year. The strong growth in contribution margin reflects contributions from PersonalizationMall.com combined with continued robust performance in the segment’s flagship 1-800-Flowers.com® consumer floral brand.
  • BloomNet: Revenues for the quarter increased 23.5 percent to 
    $37.3 million, compared with 
    $30.2 million in the prior year period. Revenue for the quarter was up 36.8 percent compared to the same period in the Company’s fiscal 2019 fourth quarter. Gross profit margin was 43.2 percent, down 210 basis points, compared with 45.3 percent in the prior year period, primarily reflecting product mix. Segment contribution margin1 increased 48.4 percent to 
    $11.3 million, compared with 
    $7.6 million in the prior year period, in part due to the Company’s decision in the year-ago period to waive certain fees. For the year, revenue increased 27.9 percent to 
    $142.9 million, compared with 
    $111.8 million in the prior year. Gross profit margin was 45.5 percent, down 300 basis points compared with 48.5 percent in the prior year, primarily reflecting product mix. Segment contribution margin1 for the year increased 30.7 percent to 
    $45.9 million, compared with 
    $35.1 million in the prior year.

COMPANY GUIDANCE

  • For the fiscal 2022 full year, the Company is providing the following guidance:
    • Total revenue growth of 10.0 percent-to-12.0 percent compared with the prior year;
    • Adjusted EBITDA growth of 5.0 percent-to-8.0 percent;
    • EPS in line with fiscal 2021 as improved EBITDA is offset by higher depreciation and a higher effective tax rate; and
    • Free Cash Flow to exceed 
      $100 million
  • The Company’s guidance for the year is based on several factors including:
    • The significant increase in consumers shopping online where the Company’s broad product offering and brand portfolio makes it a leading destination for customers looking for solutions to help them connect, express themselves and celebrate – sentiments that have become more important than ever;
    • Significant expansion of the Company’s product offering, both organically and through strategic acquisitions like Shari’s Berries and PersonalizationMall.com;
    • Continued strong growth and positive behaviors in the Company’s customer file, including strong new-to-file customer growth as well as increased demand from existing customers; and
    • Continued strong growth in the Company’s Celebrations Passport® loyalty program, which is helping drive increased frequency, retention, and cross-category/cross-brand purchases.
  • The Company is also aware of several headwinds affecting its business, including:
    • a challenging labor market with both limited availability and rising wage rates; and
    • significant increases in both inbound and outbound shipping rates as well as higher commodity costs.

Definitions of non-GAAP Financial Measures:

We sometimes use financial measures derived from consolidated financial information, but not presented in our financial statements prepared in accordance with 
U.S. generally accepted accounting principles (“GAAP”). Certain of these are considered “non-GAAP financial measures” under the 
U.S. Securities and Exchange Commission rules. Non-GAAP financial measures referred to in this document are either labeled as “non-GAAP” or designated as such with a “1”. See below for definitions and the reasons why we use these non-GAAP financial measures. Where applicable, see the Selected Financial Information below for reconciliations of these non-GAAP measures to their most directly comparable GAAP financial measures.

EBITDA and Adjusted EBITDA

We define EBITDA as net income (loss) before interest, taxes, depreciation, and amortization. Adjusted EBITDA is defined as EBITDA adjusted for the impact of stock-based compensation, Non-Qualified Plan Investment appreciation/depreciation, and for certain items affecting period-to-period comparability. See Selected Financial Information for details on how EBITDA and Adjusted EBITDA were calculated for each period presented. The Company presents EBITDA and Adjusted EBITDA because it considers such information meaningful supplemental measures of its performance and believes such information is frequently used by the investment community in the evaluation of similarly situated companies. The Company uses EBITDA and Adjusted EBITDA as factors to determine the total amount of incentive compensation available to be awarded to executive officers and other employees. The Company’s credit agreement uses EBITDA and Adjusted EBITDA to determine its interest rate and to measure compliance with certain covenants. EBITDA and Adjusted EBITDA are also used by the Company to evaluate and price potential acquisition candidates. EBITDA and Adjusted EBITDA have limitations as analytical tools and should not be considered in isolation or as a substitute for analysis of the Company’s results as reported under GAAP. Some of the limitations are: (a) EBITDA and Adjusted EBITDA do not reflect changes in, or cash requirements for, the Company’s working capital needs; (b) EBITDA and Adjusted EBITDA do not reflect the significant interest expense, or the cash requirements necessary to service interest or principal payments, on the Company’s debts; and (c) although depreciation and amortization are non-cash charges, the assets being depreciated and amortized may have to be replaced in the future and EBITDA does not reflect any cash requirements for such capital expenditures. EBITDA and Adjusted EBITDA should only be used on a supplemental basis combined with GAAP results when evaluating the Company’s performance.

Segment Contribution Margin and Adjusted Segment Contribution Margin

We define Segment Contribution Margin as earnings before interest, taxes, depreciation, and amortization, before the allocation of corporate overhead expenses. Adjusted Contribution Margin is defined as Contribution Margin adjusted for certain items affecting period-to-period comparability. See Selected Financial Information for details on how Segment Contribution Margin and Adjusted Segment Contribution Margin were calculated for each period presented. When viewed together with our GAAP results, we believe Segment Contribution Margin and Adjusted Segment Contribution Margin provide management and users of the financial statements meaningful information about the performance of our business segments. Segment Contribution Margin and Adjusted Segment Contribution Margin are used in addition to and in conjunction with results presented in accordance with GAAP and should not be relied upon to the exclusion of GAAP financial measures. The material limitation associated with the use of the Segment Contribution Margin and Adjusted Segment Contribution Margin is that they are an incomplete measure of profitability as they do not include all operating expenses or non-operating income and expenses. Management compensates for these limitations when using this measure by looking at other GAAP measures, such as Operating Income and Net Income.

Adjusted Net Income (Loss) and Adjusted or Comparable Net Income (Loss) Per Common Share:

We define Adjusted Net Income (Loss) and Adjusted or Comparable Net Income (Loss) Per Common Share as Net Income (Loss) and Net Income (Loss) Per Common Share adjusted for certain items affecting period to period comparability. See Selected Financial Information below for details on how Adjusted Net Income (Loss) and Adjusted or Comparable Net Income (Loss) Per Common Share were calculated for each period presented. We believe that Adjusted Net Income (Loss) and Adjusted or Comparable EPS are meaningful measures because they increase the comparability of period-to-period results. Since these are not measures of performance calculated in accordance with GAAP, they should not be considered in isolation of, or as a substitute for, GAAP Net Income (Loss) and Net Income (Loss) Per Common share, as indicators of operating performance and they may not be comparable to similarly titled measures employed by other companies.

Free Cash Flow:

We define Free Cash Flow as net cash provided by operating activities less capital expenditures. The Company considers Free Cash Flow to be a liquidity measure that provides useful information to management and investors about the amount of cash generated by the business after the purchases of fixed assets, which can then be used to, among other things, invest in the Company’s business, make strategic acquisitions, strengthen the balance sheet and repurchase stock or retire debt. Free Cash Flow is a liquidity measure that is frequently used by the investment community in the evaluation of similarly situated companies. Since Free Cash Flow is not a measure of performance calculated in accordance with GAAP, it should not be considered in isolation or as a substitute for analysis of the Company’s results as reported under GAAP. A limitation of the utility of free cash flow as a measure of financial performance is that it does not represent the total increase or decrease in the company’s cash balance for the period.

About 1-800-FLOWERS.COM, Inc.

1-800-FLOWERS.COM, Inc. is a leading provider of gifts designed to help customers express, connect and celebrate. The Company’s e-commerce business platform features an all-star family of brands, including: 1-800-Flowers.com®, 1-800-Baskets.com®, Cheryl’s Cookies®, Harry & David®, PersonalizationMall.com®, Shari’s Berries®, FruitBouquets.com®, Moose Munch®, The Popcorn Factory®, Wolferman’s Bakery®, Stock Yards® and Simply Chocolate®. Through the Celebrations Passport® loyalty program, which provides members with free standard shipping and no service charge across our portfolio of brands, 1-800-FLOWERS.COM, Inc. strives to deepen relationships with customers. The Company also operates BloomNet®, an international floral and gift industry service provider offering a broad-range of products and services designed to help members grow their businesses profitably; Napco?, a resource for floral gifts and seasonal décor; and DesignPac Gifts, LLC, a manufacturer of gift baskets and towers. 1-800-FLOWERS.COM, Inc. was recognized among the top 5 on the National Retail Federation’s 2021 Hot 25 Retailers list, which ranks the nation’s fastest-growing retail companies. Shares in 1-800-FLOWERS.COM, Inc. are traded on the NASDAQ Global Select Market, ticker symbol: FLWS. For more information, visit 1800flowersinc.com or follow @1800FLOWERSInc on Twitter.

Special Note Regarding Forward Looking Statements:

This press release contains forward-looking statements within the meaning of the Private Securities Litigation Reform Act of 1995. These forward-looking statements represent the Company’s current expectations or beliefs concerning future events and can generally be identified using statements that include words such as “estimate,” “expects,” “project,” “believe,” “anticipate,” “intend,” “plan,” “foresee,” “forecast,” “likely,” “will,” “target” or similar words or phrases. These forward-looking statements are subject to risks, uncertainties, and other factors, many of which are outside of the Company’s control which could cause actual results to differ materially from the results expressed or implied in the forward-looking statements, including, but not limited to, statements regarding the Company’s ability to achieve its guidance for fiscal-year 2021 first quarter and the key holiday season; the impact of the Covid-19 pandemic on the Company; its ability to leverage its operating platform and reduce operating expense ratio; its ability to successfully integrate acquired businesses and assets; its ability to successfully execute its strategic initiatives; its ability to cost effectively acquire and retain customers; the outcome of contingencies, including legal proceedings in the normal course of business; its ability to compete against existing and new competitors; its ability to manage expenses associated with sales and marketing and necessary general and administrative and technology investments; its ability to reduce promotional activities and achieve more efficient marketing programs; and general consumer sentiment and industry and economic conditions that may affect levels of discretionary customer purchases of the Company’s products. Reconciliations for forward looking figures would require unreasonable efforts at this time because of the uncertainty and variability of the nature and amount of certain components of various necessary GAAP components, including for example those related to compensation, tax items, amortization or others that may arise during the year, and the Company’s management believes such reconciliations would imply a degree of precision that would be confusing or misleading to investors. The lack of such reconciling information should be considered when assessing the impact of such disclosures. The Company undertakes no obligation to publicly update any of the forward-looking statements, whether because of new information, future events or otherwise, made in this release or in any of its SEC filings. Consequently, you should not consider any such list to be a complete set of all potential risks and uncertainties. For a more detailed description of these and other risk factors, refer to the Company’s SEC filings, including the Company’s Annual Reports on Form 10-K and its Quarterly Reports on Form 10-Q.

Conference Call:

The Company will conduct a conference call to discuss the above details and attached financial results today, Thursday, August 26, 2021, at 8:00 a.m. (ET). The conference call will be webcast from the Investor Relations section of the Company’s website at www.1800flowersinc.com. A recording of the call will be posted on the Investor Relations section of the Company’s website within two hours of the call’s completion. A replay of the call can be accessed beginning at 2:00 p.m. (ET) on the day of the call through September 2, 2021, at: (US) 1-877-344-7529; (
Canada) 855-669-9658; (International) 1-412-317-0088; enter conference ID #: 10159487. If you have any questions regarding the above information, please contact the Investor Relations office at invest@1800flowers.com.

Note: The following tables are an integral part of this press release without which the information presented in this press release should be considered incomplete.

1-800-FLOWERS.COM, Inc. and Subsidiaries
Condensed Consolidated Balance Sheets
(in thousands)


June 27, 2021


June 28, 2020


(unaudited)


Assets


Current assets:


Cash and cash equivalents


$

173,573


$

240,506


Trade receivables, net


20,831


15,178


Inventories


153,863


97,760


Prepaid and other


51,792


25,186


Total current assets


400,059


378,630


Property, plant and equipment, net


215,287


169,075


Operating lease right-of-use assets


86,230


66,760


Goodwill


208,150


74,711


Other intangibles, net


139,048


66,273


Other assets


27,905


18,986


Total assets


$

1,076,679


$

774,435


Liabilities and Stockholders’ Equity


Current liabilities:


Accounts payable


$

57,434


$

25,306


Accrued expenses


178,512


141,741


Current maturities of long-term debt


20,000


5,000


Current portion of long-term operating lease liabilities


9,992


8,285


Total current liabilities


265,938


180,332


Long-term debt


161,512


87,559


Long-term operating lease liabilities


79,375


61,964


Deferred tax liabilities


34,162


28,632


Other liabilities


26,622


16,174


Total liabilities

567,609


374,661


Total stockholders’ equity


509,070


399,774


Total liabilities and stockholders’ equity


$

1,076,679


$

774,435


1-800-FLOWERS.COM, Inc. and Subsidiaries
Selected Financial Information
Consolidated Statements of Operations
(in thousands, except for per share data)
(unaudited)


Three Months Ended


Years Ended


June 27, 2021

June 28, 2020

June 27, 2021

June 28, 2020


Net revenues:


E-Commerce


$

438,109


$

382,400


$

1,879,550


$

1,230,385


Other


48,874


35,556


242,695


259,252


Total net revenues


486,983


417,956


2,122,245


1,489,637


Cost of revenues


288,979


248,530


1,225,816


867,441


Gross profit


198,004


169,426


896,429


622,196


Operating expenses:


Marketing and sales


130,364


100,378


533,268


363,227


Technology and development


14,491


14,262


54,428


48,698


General and administrative


27,176


33,207


117,136


97,394


Depreciation and amortization


10,718


9,245


42,510


32,513


Total operating expenses


182,749


157,092


747,342


541,832


Operating income


15,255


12,334


149,087


80,364


Interest expense, net


1,340


711


5,860


2,438


Other income (expense), net


1,687


1,630


5,888


(84

)

Income before income taxes


15,602


13,253


149,115


77,842


Income tax expense


2,292


3,479


30,463


18,844


Net income


$

13,310


$

9,774


$

118,652


$

58,998


Basic net income per common share


$

0.20


$

0.15


$

1.83


$

0.92


Diluted net income per common share


$

0.20


$

0.15


$

1.78


$

0.89


Weighted average shares used in the calculation of net income per common share:


Basic


65,023


64,283


64,739


64,463


Diluted


66,477


66,385


66,546


66,408


1-800-FLOWERS.COM, Inc. and Subsidiaries
Selected Financial Information
Consolidated Statements of Cash Flows
(in thousands)
(unaudited)


Years ended


June 27, 2021


June 27, 2020


Operating activities:


Net income


$

118,652


$

58,998


Adjustments to reconcile net income to net cash provided by operating activities:


Depreciation and amortization


42,510


32,513


Amortization of deferred financing costs


1,143


646


Deferred income taxes


5,530


(266

)

Bad debt expense


964


4,143


Stock-based compensation


10,835


8,434


Other non-cash items


645


1,032


Changes in operating items:


Trade receivables


(5,236

)


(6,947

)

Inventories


(39,104

)


(4,371

)

Prepaid and other


(22,850

)


(726

)

Accounts payable and accrued expenses


57,397


44,359


Other assets and liabilities


2,804


1,602


Net cash provided by operating activities


173,290


139,417


Investing activities:


Acquisitions, net of cash acquired


(250,942

)


(20,500

)

Capital expenditures, net of non-cash expenditures


(55,219

)


(34,703

)

Purchase of equity investments


(1,756

)


(1,176

)

Net cash used in investing activities


(307,917

)


(56,379

)


Financing activities:


Acquisition of treasury stock


(22,369

)


(10,680

)

Proceeds from exercise of employee stock options


2,253


285


Proceeds from bank borrowings


265,000


20,000


Repayment of notes payable and bank borrowings


(174,997

)


(25,000

)

Debt issuance cost


(2,193

)


(60

)

Net cash provided by (used in) financing activities


67,694


(15,455

)


Net change in cash and cash equivalents


(66,933

)


67,583


Cash and cash equivalents:


Beginning of period


240,506


172,923


End of period


$

173,573


$

240,506


1-800-FLOWERS.COM, Inc. and Subsidiaries
Selected Financial Information – Category Information
(dollars in thousands) (unaudited)

Segment Information shown below is appended to the Company’s Earnings Release and includes the impact of Stock Based Compensation

Three Months Ended

June 27,

2021

June 28,

2020

Personalization

Mall Litigation

& Transaction

Costs

Harry &

David Store

Closure

Costs

As Adjusted

(non-GAAP)

June 28,

2020

%

Change

Net revenues:

Consumer Floral & Gifts

$

297,719


$

234,094


$

$

$

234,094


27.2

%

BloomNet


37,297


30,189


30,189


23.5

%

Gourmet Foods & Gift Baskets


152,168


153,842


153,842


-1.1

%

Corporate


46


119


119


-61.3

%

Intercompany eliminations


(247

)


(288

)


(288

)

14.2

%

Total net revenues

$

486,983


$

417,956


$


$


$

417,956


16.5

%


Gross profit:

Consumer Floral & Gifts

$

122,403


$

93,404


$


$


$

93,404


31.0

%


41.1

%


39.9

%


39.9

%


BloomNet


16,126


13,673


13,673


17.9

%


43.2

%


45.3

%


45.3

%


Gourmet Foods & Gift Baskets


59,220


62,260


62,260


-4.9

%


38.9

%


40.5

%


40.5

%


Corporate


255


89


89


186.5

%


554.3

%


74.8

%


74.8

%


Total gross profit

$

198,004


$

169,426


$


$


$

169,426


16.9

%


40.7

%


40.5

%


40.5

%


EBITDA (non-GAAP):

Segment Contribution Margin (non-GAAP) (a):

Consumer Floral & Gifts

$

41,195


$

38,953


$


$


$

38,953


5.8

%

BloomNet


11,271


7,595


7,595


48.4

%

Gourmet Foods & Gift Baskets


4,205


10,115


5,177


15,292


-72.5

%

Segment Contribution Margin Subtotal


56,671


56,663


5,177


61,840


-8.4

%

Corporate (b)


(30,698

)


(35,084

)


1,795


(33,289

)

7.8

%

EBITDA (non-GAAP)


25,973


21,579


1,795


5,177


28,551


-9.0

%

Add: Stock-based compensation


2,606


1,993


1,993


30.8

%

Add: Compensation charge related to NQ Plan Investment Appreciation


1,590


2,000


2,000


-20.5


%

Adjusted EBITDA (non-GAAP)

$

30,169


$

25,572


$

1,795


$

5,177


$

32,544


-7.3

%

1-800-FLOWERS.COM, Inc. and Subsidiaries
Selected Financial Information – Category Information
(dollars in thousands) (unaudited)

Segment Information shown below is appended to the Company’s Earnings Release and includes the impact of Stock Based Compensation

Twelve Months Ended

June 27,

2021

Personalization

Mall Litigation

& Transaction

Costs

Harry &

David Store

Closure

Costs

As Adjusted

(non-GAAP)

June 27, 2021

June 28,

2020

Personalization

Mall Litigation

& Transaction

Costs

Harry &

David Store

Closure

Costs

As Adjusted

(non-GAAP)

Jun 28, 2020

%

Change

Net revenues:

Consumer Floral & Gifts

$

1,025,015

$

$

$

1,025,015

$

593,197

$

$

$

593,197

72.8

%

BloomNet


142,919


142,919


111,766


111,766


27.9

%

Gourmet Foods & Gift Baskets


955,607


955,607


785,547


785,547


21.6

%

Corporate


341


341


591


591


-42.3

%

Intercompany eliminations


(1,637

)


(1,637

)


(1,464

)


(1,464

)

-11.8

%

Total net revenues

$

2,122,245


$


$


$

2,122,245


$

1,489,637


$


$


$

1,489,637


42.5

%

Gross profit:

Consumer Floral & Gifts

$

420,860


$


$


$

420,860


$

233,941


$


$


$

233,941


79.9

%


41.1

%


41.1

%


39.4

%


39.4

%


BloomNet


64,978


64,978


54,193


54,193


19.9

%


45.5

%


45.5

%


48.5

%


48.5

%

Gourmet Foods & Gift Baskets


410,208


410,208


333,620


333,620


23.0

%


42.9

%


42.9

%


42.5

%


42.5

%

Corporate


383


383


442


442


-13.3

%


112.3

%


112.3

%


74.8

%


74.8

%

Total gross profit

$

896,429


$


$


$

896,429


$

622,196


$


$


$

622,196


44.1

%


42.2

%


42.2

%


41.8

%


41.8

%

EBITDA (non-GAAP):

Segment Contribution Margin (non-GAAP) (a):

Consumer Floral & Gifts

$

128,625


$


$


$

128,625


$

73,806


$


$


$

73,806


74.3

%

BloomNet


45,875


45,875


35,111


35,111


30.7

%

Gourmet Foods & Gift Baskets


149,377


(483

)


148,894


110,627


5,177


115,804


28.6

%

Segment Contribution Margin Subtotal


323,877


(483

)


323,394


219,544


5,177


224,721


43.9

%

Corporate (b)


(132,280

)


5,403


(126,877

)


(106,667

)


2,706


(103,961

)

-22.0

%

EBITDA (non-GAAP)


191,597


5,403


(483

)


196,517


112,877


2,706


5,177


120,760


62.7

%

Add: Stock-based compensation


10,835


10,835


8,434


8,434


28.5

%

Add: Compensation charge related to NQ Plan Investment Appreciation


5,713


5,713


347


347


1546.4

%

Adjusted EBITDA (non-GAAP)

$

208,145


$

5,403

$

(483

)

$

213,065


$

121,658


$

2,706

$

5,177

$

129,541


64.5

%

1-800-FLOWERS.COM, Inc. and Subsidiaries
Selected Financial Information
(in thousands) (unaudited)

Reconciliation of net income to adjusted net income (non-GAAP):

 Three Months Ended

 Years Ended

June 27,

2021

June 28,

2020

June 27,

2021

June 28,

2020


Net income

$

13,310

$

9,774


$

118,652


$

58,998


Adjustments to reconcile net income to adjusted net income (non-GAAP)

Add: Personalization Mall litigation and transaction costs


1,795


5,403


2,706


Add: Harry & David store closure cost


5,177


(483

)


5,177


Deduct: Income tax benefit on adjustments


33


(1,691

)


(1,005

)


(1,908

)

Adjusted net income (non-GAAP)

$

13,343


$

15,055


$

122,567


$

64,973


Basic and diluted net income per common share

Basic

$

0.20


$

0.15


$

1.83


$

0.92


Diluted

$

0.20


$

0.15


$

1.78


$

0.89


Basic and diluted adjusted net income per common share (non-GAAP)

Basic

$

0.21


$

0.23


$

1.89


$

1.01


Diluted

$

0.20


$

0.23


$

1.84


$

0.98


Weighted average shares used in the calculation of net income and adjusted net income per common share

Basic


65,023


64,283


64,739


64,463


Diluted


66,477


66,385


66,546


66,408


1-800-FLOWERS.COM, Inc. and Subsidiaries
Selected Financial Information
(in thousands) (unaudited)

Reconciliation of net income to adjusted EBITDA (non-GAAP):


Three Months Ended


Years Ended

June 27,

2021

June 28,

2020

June 27,

2021

June 28,

2020


Net income

$

13,310


$

9,774


$

118,652


$

58,998

Add: Interest expense, net


(347

)


(919

)


(28

)


2,522


Add: Depreciation and amortization


10,718


9,245


42,510


32,513


Add: Income tax expense


2,292


3,479


30,463


18,844


EBITDA


25,973


21,579


191,597


112,877


Add: Stock-based compensation


2,606


1,993


10,835


8,434

Add: Compensation charge related to NQ plan investment appreciation

1,590

2,000

5,713

347

Add: Personalization Mall litigation and transaction costs


1,795


5,403


2,706


Add: Harry & David store closure cost


5,177


(483

)


5,177


Adjusted EBITDA

$

30,169


$

32,544


$

213,065


$

129,541


(a)  Segment performance is measured based on segment contribution margin or segment Adjusted EBITDA, reflecting only the direct controllable revenue and operating expenses of the segments, both of which are non-GAAP measurements. As such, management’s measure of profitability for these segments does not include the effect of corporate overhead, described above, depreciation and amortization, other income (net), and other items that we do not consider indicative of our core operating performance.

(b)  Corporate expenses consist of the Company’s enterprise shared service cost centers, and include, among other items, Information Technology, Human Resources, Accounting and Finance, Legal, Executive and Customer Service Center functions, as well as Stock-Based Compensation. In order to leverage the Company’s infrastructure, these functions are operated under a centralized management platform, providing support services throughout the organization. The costs of these functions, other than those of the Customer Service Center, which are allocated directly to the above categories based upon usage, are included within corporate expenses as they are not directly allocable to a specific segment.

Investors:

Joseph D. Pititto

(516) 237-6131

invest@1800flowers.com

Media:

Kathleen Waugh

(516) 237-6028

kwaugh@1800flowers.com

Source: 1-800-FLOWERS.COM, Inc.

Golden Predator Mining (NTGSF)(GPY:CA) – Shareholders Approve Business Combination with Arizona Gold Corp

Thursday, August 26, 2021

Golden Predator Mining (NTGSF)(GPY:CA)
Shareholders Approve Business Combination with Arizona Gold Corp.

Golden Predator Mining Corp is a Canada based exploration stage company engaged in the business of acquiring and exploring mineral properties. It owns properties primarily in Yukon, Canada. Some of the company’s projects located in Yukon are the 3 Aces, Sprogge, Reef, Brewery Creek, Marg, Sonora Gulch, Grew Creek, Upper Hyland and others.

Mark Reichman, Senior Research Analyst of Natural Resources, Noble Capital Markets, Inc.

Refer to the full report for the price target, fundamental analysis, and rating.

    Business combination approved. Golden Predator Mining and Arizona Gold Corp. (TSX: AZG, OTCQB: AGAUF) shareholders overwhelmingly approved the proposed acquisition by Arizona Gold of all the outstanding common shares of Golden Predator by way of a proposed plan of arrangement. Shareholders of Golden Predator will receive 1.65 common shares of Arizona Gold Corp. in exchange for each share of Golden Predator. Upon closing, Golden Predator shareholders will own approximately 45% of the combined company shares.

    Merger expected to close on September 2.  Completion of the business combination is contingent on satisfaction or waiver of remaining conditions to the arrangement, including final approval by the Supreme Court of British Columbia …


This Company Sponsored Research is provided by Noble Capital Markets, Inc., a FINRA and S.E.C. registered broker-dealer (B/D).

*Analyst certification and important disclosures included in the full report. NOTE: investment decisions should not be based upon the content of this research summary.  Proper due diligence is required before making any investment decision. 

Release – Arizona Gold and Golden Predator Shareholders Approve Business Combination


Arizona Gold and Golden Predator Shareholders Approve Business Combination


VANCOUVER, British Columbia, Aug. 25, 2021 (GLOBE NEWSWIRE) — Arizona Gold Corp. (“Arizona”) (TSX: AZG, OTCQB: AGAUF) and Golden Predator Mining Corp. (“Golden Predator”) (TSX.V: GPY, OTCQX: NTGSF) are pleased to announce that shareholders of both Arizona and Golden Predator have overwhelmingly approved all matters voted on at Arizona’s special meeting as well as at Golden Predator’s special meeting held earlier today, including the proposed acquisition by Arizona of all of the outstanding common shares of Golden Predator by way of a proposed plan of arrangement (the “Arrangement”), pursuant to the terms and subject to the conditions of the arrangement agreement between Arizona and Golden Predator dated June 28, 2021.

Subject to the satisfaction or waiver of the remaining conditions to the Arrangement, including approval of the Arrangement by the British Columbia Supreme Court, which application will be heard on August 30, 2021, closing of the Arrangement is expected to occur on September 2, 2021.

Under the terms of the Arrangement, all of the issued and outstanding common shares of Golden Predator will be exchanged for common shares of Arizona on the basis of 1.65 common shares of Arizona per common share of Golden Predator (the “Exchange Ratio”). Following completion of the Arrangement, current Arizona shareholders and former Golden Predator shareholders will own approximately 55% and 45% of the combined company common shares, respectively.

Name Change to Sabre Gold Mines Corp.
Arizona also intends to proceed with a name change to Sabre Gold Mines Corp. (“Sabre Gold”) in connection with the closing of the Arrangement. The common shares of the new Sabre Gold are expected to trade under the ticker symbol ‘SGLD’ on the Toronto Stock Exchange. The company expects to begin trading under its new name on the OTCQB at or about the same time and under a new ticker symbol by the middle of September, 2021, until which time the company will continue to trade under the current OTCQB symbol (AGAUF). A new website for the combined company will also be launched in early September.

Golden Predator shares are expected to be delisted from the TSX Venture Exchange and an application will be made for Golden Predator to cease to be a reporting issuer on the date of closing of the Arrangement.

Arizona Meeting & Voting Results
The issuance by Arizona of common shares of Arizona (“Arizona Shares”) to the shareholders of Golden Predator in exchange for all of the issued and outstanding Golden Predator shares pursuant to the Arrangement was approved by 99.5% of the votes cast by Arizona shareholders present or represented by proxy at Arizona’s special meeting.

All matters presented for approval at the Arizona special meeting were duly authorized and approved as follows:

Total Shares Represented at the meeting: 161,052,465 (46.54%)
     
Share Issuance Resolution:    
Shares Represented by Proxy – Voted For 156,132,570 (99.5%)
Shares Represented by Proxy – Voted Against 759,817 (0.5%)
Share Represented by proxy – Not Voted 4,160,078  
     
Name Change Resolution:    
Shares Represented by Proxy – Voted For 158,113,145 (98.2%)
Shares Represented by Proxy – Voted Against 2,939,320 (1.8%)


Golden Predator Meeting & Voting Results
The Arrangement with Arizona was approved by 99.29% of the votes cast by Golden Predator shareholders present by virtual attendance or represented by proxy at Golden Predator’s special meeting.

All matters presented for approval at the Golden Predator special meeting were duly authorized and approved as follows:

Total Shares Represented at the meeting: 78,461,398 (45.50%)
     
Arrangement Resolution:    
Shares Represented by Proxy – Voted For 77,907,359 (99.29%)
Shares Represented by Proxy – Voted Against 554,029 (0.71%)


About Arizona
Arizona Gold is an emerging American gold producer advancing the restart of production at its 100% owned, fully permitted, past-producing Copperstone mine project, located in mining-friendly Arizona. The Copperstone mine project demonstrates significant upside exploration potential that has yet to be drilled within a 50 km2 land package that includes past production of over 500,000 oz gold by way of an open-pit operation.

The company’s current focus is on maximizing Copperstone’s potential by defining and expanding current resources and further optimizing the mine’s economics for purposes of the restart of gold production in the near-term as a result of the recent project funding transaction with Star Royalties Ltd.

For further information please visit the Arizona website at www.arizona-gold.com.

About Golden Predator
Golden Predator is advancing the past-producing Brewery Creek mine towards a timely resumption of mining activities in Canada’s Yukon. The project has established resources grading over 1.0 g/t gold and both a technical report and Bankable Feasibility Study underway to define the economics of a restart of heap leach operations at the Brewery Creek mine. The 180 km2 brownfield property is located 55 km by road from Dawson City, Yukon and operates under a Socio-Economic Accord with the Tr’ondëk Hwëch’in First Nation. The Company also holds the Marg project, with a NI 43-101 compliant resource, the Gold Dome project and the Grew Creek project.

For additional information on Golden Predator and the Brewery Creek mine, please visit the website at www.goldenpredator.com.

Contact Information

Arizona Gold Corp.
Giulio Bonifacio
CEO & Director
604-318-6760 
gtbonifacio@arizona-gold.com
Golden Predator Mining Corp.
William Sheriff
Executive Chair
972-333-2214
wms@goldenpredator.com


Cautionary Statements

Certain information contained herein constitutes forward-looking information or statements under applicable securities legislation and rules. Such statements include, but are not limited to, statements with respect to the anticipated completion of the Transaction. Forward-looking statements are based on the opinions and estimates of management as of the date such statements are made and are subject to known and unknown risks, uncertainties and other factors that may cause the actual results, level of activity, performance or achievements of Arizona and/or Golden Predator to be materially different from those expressed or implied by such forward-looking statements, including, but not limited to: (i) any inability of the parties to satisfy the conditions to the completion of the transaction on acceptable terms or at all; and (ii) receipt of necessary stock exchange and court approvals. Although management of each of Arizona and Golden Predator has attempted to identify important factors that could cause actual results to differ materially from those contained in forward-looking statements, there may be other factors that cause results not to be as anticipated, estimated or intended. There can be no assurance that such statements will prove to be accurate. Accordingly, readers should not place undue reliance on forward-looking statements. Neither party will update any forward-looking statements or forward-looking information that are incorporated by reference herein, except as required by applicable securities laws. The parties caution readers not to place undue reliance on these forward-looking statements and it does not undertake any obligation to revise and disseminate forward-looking statements to reflect events or circumstances after the date hereof, or to reflect the occurrence of or non-occurrence of any events.

This press release is not and is not to be construed in any way as, an offer to buy or sell securities in the United States. The distribution of the Arizona common shares in connection with the transactions described herein will not be registered under the United States Securities Act of 1933 (the “U.S. Securities Act”) and the Arizona common shares may not be offered or sold in the United States absent registration or an applicable exemption from the registration requirements of the U.S. Securities Act and applicable state securities laws. This press release shall not constitute an offer to sell or the solicitation of an offer to buy the Arizona common shares, nor shall there be any offer or sale of the Arizona common shares in any jurisdiction in which such offer, solicitation or sale would be unlawful.

Neither the TSX, the TSX Venture Exchange nor its Regulation Services Provider (as that term is defined in the policies of the TSX and TSX Venture Exchange) accepts responsibility for the adequacy or accuracy of this release.

QuickChek – August 25, 2021


Great Bear Adds to LP Fault Gold Zone at Both Ends of Drill Grid

Great Bear Resources announced results from its ongoing fully funded $45 million 2021 exploration program at its 100% owned flagship Dixie Project in the Red Lake district of Ontario

Research, News & Market Data on Great Bear Resources

Watch recent presentation from Great Bear Resources


Indonesia Energy Commences Drilling of Second of Three Back-to-Back Wells

Indonesia Energy announced that the company has commenced the drilling of the second of three new back-to-back wells on its 63,000-acre Kruh Block

Research, News & Market Data on Indonesia Energy

Watch recent presentation from Indonesia Energy


Kymeta and Comtech Telecommunications Corp. Announce Technology and Business Development Partnership

Comtech Telecommunications announced a technology and business development partnership with communications company Kymeta

Research, News & Market Data on Comtech

Watch recent presentation from Comtech


Kratos Air Wolf Tactical Drone System Completes Successful Flight at Burns Flat, Oklahoma Range Facility

Kratos Defense & Security Solutions announced that its Air Wolf Tactical Drone System completed a 100 percent successful flight at the recently approved Burns Flat, Oklahoma Range Facility

Research, News & Market Data on Kratos


Aurania Identifies New Epithermal Gold-Silver Target in Ecuador

Aurania Resources announced that a new epithermal target with associated gold enrichment in soil over an area of 0.67 square kilometres has been identified

Research, News & Market Data on Aurania

Watch recent presentation from Aurania


Stay up to date. Follow us:


Release – Great Bear Adds to LP Fault Gold Zone at Both Ends of Drill Grid


Great Bear Adds to LP Fault Gold Zone at Both Ends of Drill Grid: 28.18 g/t Gold Over 4.80 m, Within 3.83 g/t Gold Over 43.10 m in Northwest, 64.30 g/t Gold Over 0.55 m, Within 5.90 g/t Gold Over 8.25 m in Southeast; Gold Controls Confirmed


August 25, 2021 – Vancouver, British Columbia, Canada – Great Bear Resources Ltd. (the “Company” or “Great Bear”, TSX-V: GBR; OTCQX: GTBAF) today reported results from its ongoing fully funded $45 million 2021 exploration program at its 100% owned flagship Dixie Project in the Red Lake district of Ontario.

Key Results

  • Drill holes reported in this release primarily targeted the previously underexplored northwestern and southeastern areas of the 4.2 kilometre Phase 1 drill grid.  Results expand and characterize the zone outboard from the Central LP Fault, which had seen the highest density Phase 1 drilling prior to this release.  Figure 1.
  • High-grade gold controls have been identified along the LP Fault.  Drilling has confirmed these controls in several areas, which will facilitate targeting of high-grade gold during Phase 2 drilling below the current 450 metre drill depth, and elsewhere along strike.
  • Steeply-plunging high-grade gold mineralization has been successfully targeted in the northwestern “Discovery” and southeastern “Viggo” areas of the LP Fault.
  • The number of high-grade gold domains being modeled at the LP Fault has been expanded from 17 to 23.  This includes seven high-grade gold domains which are being modeled in the northwestern “Discovery” area. 
  • Bulk tonnage style gold mineralization has been confirmed as continuous along more than 3 kilometres of strike length of the LP Fault and remains open to extension.  New results from the previously under-drilled northwestern “Discovery” and “Gap” areas illustrate this continuity.

Chris Taylor, President and CEO of Great Bear said, “The confirmation of predictable high-grade gold controls within the LP Fault has clear, positive implications for our ability to target and model higher-grade mineralization, especially at depth.  However, the confirmation of continuous mineralization at shallow depths in the “Gap” area is arguably the more significant development as we progress towards maiden mineral resource estimate publication by early next year.  While clearly not the most strongly mineralized segment of the LP Fault, the “Gap” area contains mineralized intervals with similar grades and widths to those that have been incorporated into mine plans within other Canadian bulk tonnage gold deposits.  These new results confirm the strongly mineralized Central and Discovery areas are connected as a continuously mineralized gold zone with clear bulk tonnage potential over three kilometres of strike length.

With the 73 new drill holes contained in this release, Great Bear has reported 404 of the 440 LP Fault drill holes completed during Phase 1 drilling which will support maiden mineral resource estimation.

Figure 1: Long section showing Phase 1 drill grid results to date and areas discussed in this release.

High-Grade Gold Controls

Recent drilling has included a focus on modeling higher-grade gold mineralization controls within the broad, bulk tonnage style gold system.  Plunge controls to mineralization were interpreted using over 65,000 oriented core measurements, targeting the intersections of foliation fabrics and stratigraphy.  These intersections frequently host increased widths and grades of gold mineralization.

In this release, Great Bear successfully targeted higher grade zones within the LP Fault in both the “Discovery” and “Viggo” areas, and will apply the same criteria beneath currently drilled areas and along 11 kilometres of strike length of the LP Fault (see news release of February 20, 2020) through 2022.

Examples of confirmed and interpreted plunge controls are included in Figure 1.  These and additional interpreted plunge controls will be tested during Phase 2 drilling.

“Discovery” Area Results

Twenty six drill holes were completed in the original LP Fault “Discovery” area, located along the most northwesterly 700 metres of the 4.2 kilometre long Phase 1 drill grid.  This area was the site of LP Fault discovery hole DNW-011 (May 28, 2019; 12.33 g/t gold over 14.00 metres). Highlights include:

  • Drill hole BR-365 extended gold mineralization approximately 100 metres deeper than past drilling on its section, assaying 15.04 g/t gold over 4.00 metres from 545.00 to 549.00 metres downhole, within a broader envelope of 3.13 g/t gold over 29.50 metres from 523.50 to 553.00 metres downhole.  Figure 2.
  • Drill hole BR-394 assayed 150.00 g/t gold over 0.80 metres from 331.60 to 332.40 metres downhole, within a broader interval of 28.18 g/t gold over 4.80 metres from 331.60 to 336.40 metres downhole.  The total mineralized interval was 3.83 g/t gold over 43.10 metres from 311.50 to 354.60 metres downhole.  Figure 3.
  • Newly defined steeply northwest plunging high-grade gold controls were successfully confirmed in both BR-365 and BR-394, and will be targeted at depth below this area during Phase 2 drilling.
  • Most of the drill holes in the “Discovery” area contained multiple mineralized intervals.  An example is drill hole BR-393 which contained four mineralized zones assaying 70.90 g/t gold over 1.00 metre from 110.75 to 111.75 metres, 1.26 g/t gold over 23.00 metres from 209.50 to 232.50 metres downhole, 0.60 g/t gold over 98.35 metres from 237.60 to 335.95 metres downhole, and 16.00 g/t gold over 1.15 metres from 355.25 to 356.40 metres downhole.
  • Drill hole BR-360 assayed 22.80 g/t gold over 1.20 metres from bedrock surface, within a broader interval of 1.66 g/t gold over 34.90 metres from 13.20 to 48.10 metres downhole. A separate interval of 0.88 g/t gold over 14.00 metres was also present from 153.00 to 167.00 metres downhole.
  • Drill hole BR-333 assayed 26.60 g/t gold over 0.80 metres from 130.30 to 131.10 metres downhole, within a broader interval of 0.71 g/t gold over 84.25 metres from 51.00 to 135.25 metres downhole.
  • Great Bear is currently modeling 7 high-grade gold domains within the broader bulk tonnage gold domains in the “Discovery” area of the LP Fault zone.  Results are provided in Table 1, and expand both high-grade and bulk-tonnage style gold mineralization in this area.

Table 1: Drill results from the “Discovery” area of the northwestern LP Fault drill grid.

Drill Hole


From (m)

To (m)

Width* (m)

Gold (g/t)

Section

BR-361


229.40

230.00

0.60

3.01

22500


and

338.00

338.50

0.50

8.21


and

461.10

484.75

23.65

1.00


including

461.10

462.40

1.30

9.81


BR-362


304.50

307.20

5.70

1.45

22500


including

305.00

306.00

1.00

6.42


BR-363


137.60

154.30

16.70

1.01

22500


including

149.80

151.30

1.50

7.91


BR-364


177.90

178.65

0.75

4.51

22500

BR-365


151.00

152.50

1.50

15.10

22425


and

523.50

553.00

29.50

3.13


including

545.00

553.00

8.00

10.24


and including

545.00

549.00

4.00

15.04


BR-366


363.00

397.50

34.50

0.89

22425


including

375.00

376.00

1.00

9.74


BR-368


189.50

207.00

17.50

1.58

22400


including

198.50

205.10

6.60

3.82


and including

204.40

205.10

0.70

22.00


and

315.25

316.75

1.50

4.19


BR-367


352.40

353.85

1.45

4.45

22375


and

372.00

373.50

1.50

3.30


and

472.40

508.30

35.90

0.71


BR-369


245.00

306.35

61.35

0.67

22325

BR-420


315.00

358.90

43.90

1.14

22300


including

331.50

333.00

1.50

6.21


BR-360


13.20

48.10

34.90

1.66

22250


including

13.20

14.40

1.20

22.80


and

153.00

167.00

14.00

0.88


BR-308


150.60

183.00

32.40

0.96

22200


including

171.25

183.00

11.75

2.12


and including

171.25

172.00

0.75

12.50


and

227.60

236.10

8.50

2.11


and

286.40

356.50

70.10

0.52


and

311.80

312.75

0.95

3.30


BR-396


75.10

117.60

42.50

0.73

22200


including

101.00

107.50

6.50

2.25


and

128.20

163.25

35.05

0.74


including

152.90

153.90

1.00

5.21


BR-307


353.00

419.50

66.50

0.71

22150


including

380.00

382.90

2.90

2.29


Table 1 Continued.

Drill Hole


From (m)

To (m)

Width* (m)

Gold (g/t)

Section

BR-397


20.50

50.20

29.70

0.52

22125


and

55.40

68.70

13.30

1.31


and

74.00

80.60

6.60

2.13


and

83.90

123.70

39.80

0.37


BR-395


142.00

201.30

59.30

0.40

22100


and

253.00

275.10

22.10

0.78


including

260.00

261.00

1.00

7.34


BR-391


39.00

55.90

16.90

2.55

22075


including

48.00

54.00

6.00

6.37


and

60.00

101.00

41.00

0.51


including

69.00

70.50

1.50

4.09


and

166.60

167.20

0.60

3.86


BR-392


197.50

233.80

36.30

0.72

22075


and

253.10

256.75

3.65

2.66


BR-393


110.75

111.75

1.00

70.90

22075


and

209.50

232.50

23.00

1.26


and

237.60

335.95

98.35

0.60


and

355.25

356.40

1.15

16.00


BR-394


124.40

125.40

1.00

10.20

22075


and

311.50

354.60

43.10

3.83


and including

331.60

336.40

4.80

28.18


and including

331.60

332.40

0.80

150.00


and

451.20

455.65

4.45

2.34


BR-333


51.00

135.25

84.25

0.71

21975


and including

125.55

131.10

5.55

4.85


and including

130.30

131.10

0.80

26.60


BR-334


220.60

243.80

23.20

0.69

21950


including

228.25

235.50

7.25

1.36


BR-335


180.85

182.20

1.35

3.07

21875


and

235.50

278.75

43.25

0.54


including

271.50

273.00

1.50

4.10


BR-336


334.95

344.00

9.05

0.81

21825


including

338.00

344.00

6.00

1.00


BR-337


215.25

244.10

28.85

0.34

21825

BR-338


125.00

141.00

16.00

0.55

21825


including

132.55

136.80

4.25

1.15


*Represents core length. True mineralization widths range between 65- 95% of reported intervals as they are determined by both structural analyses obtained from oriented drill core data and orientations of individual high grade domains and bulk tonnage domains.  Mineralized domains vary in strike between 340 to 270 degrees and dip between 85 to 65 degrees to the north.  All drillholes intersect both high grade and bulk tonnage domains and often intersect multiple domains resulting in a range of true widths within the same drillhole.

Figure 2: Cross section 22425, located near the northwestern edge of the Phase 1 drill grid in the “Discovery” area.  Drill hole BR-365 extends mineralization by approximately 100 metres vertical depth. Drill core photos are of selected intervals and are not representative of all gold mineralization on the property.  Assay results from past drilling are also provided in the included table.

Figure 3: Cross section 22075 located in the northwestern “Discovery” area of the Phase 1 drill grid. Drill core photos are of selected intervals and are not representative of all gold mineralization on the property. Assay results from past drilling are also provided in the included table.

“Gap” Area Results

Eleven drill holes were completed into the “Gap” area, where bulk tonnage style gold mineralization dominates.  The Gap segment comprises approximately 400 metres of the Phase 1 grid drilling strike length.

Results are provided in Table 2.  Highlights include:

  • Confirmation of bulk tonnage style gold mineralization in all areas tested.  Results establish continuity between the adjacent “Discovery” and “Central” areas of the LP Fault zone, for a currently drilled total of over three kilometres of continuous bulk tonnage gold mineralization in the near surface of the zone.
  • Drill hole BR-410 assayed 23.80 g/t gold over 0.60 metres from 386.10 to 386.70 metres downhole, within a broader interval of 1.29 g/t over 27.50 metres from 367.00 to 394.50 metres downhole.
  • Drill hole BR-356 assayed 0.80 g/t gold over 26.90 metres from 124.10 to 151.00 metres downhole.
  • Drill hole BR-355 intersected a new high-grade target assaying 31.40 g/t gold over 1.00 metre from 271.50 to 272.50 metres downhole, in addition to a separate interval of 0.59 g/t gold over 31.90 metres from 165.00 to 196.90 metres downhole.
  • Great Bear is currently modeling 2 high-grade gold domains within the bulk tonnage gold domains in the Gap area of the LP Fault zone.
  • The “Gap” segment of the LP Fault zone has been found to contain more strongly developed gold mineralization at vertical depths of approximately 750 – 800 metres.  As originally reported on March 29, 2021, deep drill hole BR-260 intersected 15.57 g/t gold over 3.05 metres, within 1.08 g/t gold over 70.25 metres from 906.15 to 976.40 metres downhole.  This remains the deepest drill hole testing the LP Fault to date.

Table 2: Drill results from the “Gap” area of the Northwestern LP Fault drill grid.

Drill Hole


From (m)

To (m)

Width* (m)

Gold (g/t)

Section

BR-350


138.00

187.50

49.50

0.40

21650


including

144.00

171.00

27.00

0.50


BR-351


97.00

105.00

8.00

0.43

21600

BR-352


66.00

80.75

14.75

0.65

21525


and

116.30

129.00

12.70

0.51


and

133.85

138.10

4.25

2.76


and

144.50

145.50

1.00

4.36


BR-353


231.50

271.70

40.20

0.52

21525


including

241.70

243.30

1.60

5.96


BR-354


235.10

236.60

1.50

3.20

21525


and

256.80

324.10

67.30

0.31


BR-355


165.00

196.90

31.90

0.59

21450


and

271.50

272.50

1.00

31.40


BR-356


118.20

155.00

36.80

0.67

21450


and

170.55

174.00

3.45

2.36


including

170.55

171.00

0.45

8.35


BR-357

Anomalous


21425

BR-358


85.10

131.00

45.90

0.50

21400


and

192.70

193.55

0.85

6.96


BR-359


203.75

253.00

49.25

0.31

21400

BR-410


190.80

191.80

1.00

3.73

21325


and

295.50

361.90

66.40

0.32


and

367.00

394.50

27.50

1.29


and including

386.10

386.70

0.60

23.80


*Represents core length. True mineralization widths range between 65- 95% of reported intervals as they are determined by both structural analyses obtained from oriented drill core data and orientations of individual high grade domains and bulk tonnage domains.  Mineralized domains vary in strike between 340 to 270 degrees and dip between 85 to 65 degrees to the north.  All drillholes intersect both high grade and bulk tonnage domains and often intersect multiple domains resulting in a range of true widths within the same drillhole.

“Viggo” Area Results

The most southeasterly kilometre is the least explored section of the Phase 1 drill grid, and is referred to as the “Viggo” area (October 30, 2019). 

Gold mineralization in the “Viggo” area is transitional between the disseminated, bulk tonnage style gold of the central LP Fault in the west, and mesothermal vein-hosted gold with significant mineralized plunges or “shoots” in the east, such as is observed at the adjacent Hinge zone on the Dixie property, and elsewhere in the Red Lake district.  An example of this mineralization is shown in Figure 4.

All (100%) of twenty new drill holes successfully intersected gold mineralization, including newly predicted high-grade gold plunges, which are the main exploration targets in this area.  Gold results and structural data collected from this drilling will be used to target additional high-grade gold plunges during Phase 2 drilling.

New results are provided in Table 3 and include:

  • Drill hole BR-343 intersected the near-surface projection of a high-grade plunge assaying 21.70 g/t gold over 1.25 metres from 27.50 to 28.75 metres downhole, within a broader interval of 6.73 g/t gold over 5.50 metres from 27.50 to 33.00 metres downhole.  Follow-up drilling down plunge from this discovery is now required.
  • Eight hundred fifty metres along strike to the southeast, drill hole BR-371 intersected the at-depth projection of a separate high-grade plunge assaying 64.30 g/t gold over 0.55 metres from 334.75 to 335.30 metres downhole, within a broader interval of 5.90 g/t gold over 8.25 metres from 334.75 to 343.00 metres downhole.
  • BR-371 is the down-plunge continuation of gold mineralization first intersected in drill hole BR-057 (February 13, 2020), which assayed 38.03 g/t gold over 0.50 metres, within a broader interval of 7.35 g/t gold over 3.50 metres.  Additional up- and down-plunge drilling of this discovery is now required.
  • Many of the drill holes in the Viggo area contain multiple gold-bearing vein-like intervals which define priority targets for follow-up drilling.  Great Bear will test for potential structurally thickened plunging zones like those observed in BR-343 and BR-371 in these areas. An example from this release is drill hole BR-343 which intersected three mineralized vein-like intervals assaying 6.14 g/t gold over 0.50 metres from 34.05 to 34.55 metres downhole, 6.61 g/t gold over 0.95 metres from 79.85 to 80.80 metres downhole, and 10.20 g/t gold over 0.55 metres from 174.10 to 174.65 metres downhole. 
  • Other drilling in this area targeted shallow bulk-tonnage style gold mineralization immediately east of the central LP Fault zone, which will inform ongoing resource modeling.  New results include BR-341 which assayed 2.66 g/t gold over 20.90 metres from 61.50 to 82.40 metres downhole.
  • Drill density is currently limited in the Viggo area.  Additional drilling will be required during the Phase 2 program to further define the bulk tonnage style and high-grade gold in this area, and to explore for additional vein-like high-grade gold plunges.

Figure 4: Cross section 18750 located in the southeastern “Viggo” area of the Phase 1 drill grid.  The mineralized zone intersected in BR-371 and BR-057 plunges towards the west, into this view.  Drill core photos are of selected intervals and are not representative of all gold mineralization on the property. Assay results from past drilling are also provided in the included table.

Table 3: Drill results from the southeastern “Viggo” area.

Drill Hole


From (m)

To (m)

Width* (m)

Gold (g/t)

Section

BR-341


49.10

57.00

7.90

2.57

19750


including

52.50

57.00

4.50

4.26


and

61.50

82.40

20.90

2.66


BR-342


34.05

34.55

0.50

6.14

19700


and

79.85

80.80

0.95

6.61


and

174.10

174.65

0.55

10.20


BR-403


166.55

174.00

7.45

1.25

19700


including

173.25

174.00

0.75

9.38


and

302.95

311.50

8.55

0.41


BR-404


193.10

204.00

10.90

0.27

19700


and

212.00

223.50

11.50

0.18


and

256.80

276.70

19.90

0.55


including

270.00

270.70

0.70

3.31


BR-344


38.65

39.15

0.50

2.73

19675


and

173.60

185.25

11.65

0.30


and

215.65

220.35

4.70

0.28


BR-343


27.50

33.00

5.50

6.73

19625


including

27.50

28.75

1.25

21.70


and

155.00

156.00

1.00

4.61


BR-401


285.45

286.35

0.90

7.15

19600

BR-400


217.50

218.00

0.50

3.28

19575

BR-347


108.10

115.10

7.00

0.71

19525

BR-349


170.50

171.50

1.00

6.57

19500

BR-402


256.10

257.10

1.00

4.07

19475


and

269.70

270.20

0.50

4.51


BR-348


91.15

102.00

10.85

0.42

19450

BR-377


259.50

267.00

7.50

1.97

19050


including

261.00

261.60

0.60

16.10


BR-375


436.00

445.55

9.55

0.28

19000

BR-376A


354.25

357.10

2.85

2.00

18975

BR-373


471.60

472.70

1.10

3.32

18925


and

480.00

482.50

2.50

2.57


BR-370


282.35

283.60

1.25

11.85

18900


and

289.50

298.00

8.50

1.22


and including

289.50

290.25

0.75

9.19


BR-372


351.60

360.00

8.40

0.72

18850


including

351.90

352.80

0.90

3.53


and

367.55

368.05

0.50

11.30


BR-374


488.85

493.30

4.45

1.73

18850


including

489.70

490.30

0.60

8.90


BR-371


334.75

343.00

8.25

5.90

18775


including

334.75

335.30

0.55

64.30


*Represents core length. True mineralization widths range between 65- 95% of reported intervals as they are determined by both structural analyses obtained from oriented drill core data and orientations of individual high grade domains and bulk tonnage domains.  Mineralized domains vary in strike between 340 to 270 degrees and dip between 85 to 65 degrees to the north.  All drillholes intersect both high grade and bulk tonnage domains and often intersect multiple domains resulting in a range of true widths within the same drillhole.

Additional Drilling Peripheral to the LP Fault Zone

Fifteen of the 440 Phase 1 LP Fault drill holes were completed outside of the primary drill grid, up to 200 metres to the south of the zone at various locations along its strike length.  Results for these holes are available on the Company ‘s web site at www.greatbearresources.ca.  This drilling was undertaken to assess:

  1. The lateral extent of gold mineralization into the footwall of the LP Fault Zone host rocks,
  2. Geotechnical considerations such as rock density, competency and geochemistry that will be integrated into resource modeling, and
  3. Condemnation drilling that will be integrated into advanced project planning.

Bulk disseminated gold mineralization at the LP Fault generally lacks discrete boundaries and decreases in intensity with increasing distance from the centre of the zone.  As such, despite not targeting the LP Fault zone, all 15 (100%) of the drill holes completed into the periphery of the system still contained anomalous to low-grade gold over various interval widths.

Examples include peripheral drill holes BR-329a which intersected 0.22 g/t gold over 12.30 metres from 64.90 to 77.20 metres downhole, BR-345 which intersected 0.18 g/t gold over 16.35 metres from 21.60 to 37.95 metres downhole, and BR-405 which intersected 0.14 g/t gold over 14.10 metres from 40.90 to 55.00 metres downhole.

Peripheral drill hole BR-380 intersected high-grade gold assaying 23.50 g/t gold over 0.50 metres from 16.55 to 17.05 metres at bedrock surface.  While the hole was drilled away from system, it was collared in the footwall of high-grade zone BR7 (May 19, 2021), and hence intersected a portion of the high-grade domain prior to exiting the system.

On a go-forward basis, drill holes completed outside the LP Fault and other gold zones will be included in a separate table in the data download section of Great Bear’s website.  All LP Fault drill hole highlighted assays, plus drill collar locations and orientations can be downloaded at the Company’s web site.

Drill collar location, azimuth and dip for drill holes targeting the LP Fault zone included in this release are provided in the table below (UTM zone 15N, NAD 83):

Hole ID

Easting

Northing

Elevation

Length

Dip

Azimuth

BR-307

455817

5635200

375

519

-57

227

BR-308

455740

5635191

376

493

-60

227

BR-333

455801

5634900

373

282

-62

222

BR-334

455901

5634950

373

385

-56

222

BR-335

455955

5634906

372

327

-60

223

BR-336

456017

5634922

372

429

-60

221

BR-337

455974

5634868

372

345

-58

223

BR-338

455923

5634828

372

342

-59

214

BR-341

457797

5633930

364

435

-56

209

BR-342

457807

5633855

365

357

-55

208

BR-343

457873

5633787

363

327

-55

207

BR-344

457825

5633807

364

237

-55

209

BR-347

457955

5633730

362

330

-55

210

BR-348

458027

5633717

361

258

-55

211

BR-349

458012

5633799

368

378

-55

210

BR-350

455977

5634606

369

394

-49

39

BR-351

456027

5634582

369

426

-49

39

BR-352

456104

5634532

364

506

-52

37

BR-353

456076

5634490

365

473

-49

40

BR-354

456033

5634433

369

594

-48

39

BR-355

456106

5634447

358

561

-47

39

BR-356

456133

5634459

364

336

-44

38

BR-357

456203

5634502

363

231

-47

36

BR-358

456192

5634448

363

330

-50

37

BR-359

456149

5634403

367

594

-48

37

BR-360

455595

5635046

376

204

-61

227

BR-361

455585

5635497

383

582

-58

225

BR-362

455531

5635440

385

510

-59

224

BR-363

455489

5635381

384

345

-58

225

BR-364

455451

5635336

384

343

-58

225

BR-365

455726

5635551

382

723

-57

225

BR-366

455637

5635459

381

618

-58

223

BR-367

455687

5635426

379

579

-58

227

BR-368

455578

5635311

380

380

-63

226

BR-369

455656

5635260

378

387

-55

227

BR-370

458631

5633678

357

435

-56

210

BR-371

458787

5633652

358

453

-55

210

BR-372

458727

5633695

359

473

-55

212

BR-373

458723

5633841

360

609

-54

216

BR-374

458766

5633800

357

617

-56

213

BR-375

458620

5633844

360

570

-56

214

BR-376A

458583

5633766

358

489

-55

212

BR-377

458494

5633710

360

399

-55

211

BR-391

455720

5634953

376

303

-61

223

BR-392

455775

5635011

376

378

-61

224

BR-393

455818

5635062

374

465

-61

226

BR-394

455847

5635114

375

513

-62

222

BR-395

455751

5635052

374

390

-62

225

BR-396

455660

5635081

376

312

-61

227

BR-397

455679

5634990

375

306

-61

226

BR-400

457965

5633859

368

354

-55

211

BR-401

457961

5633926

369

420

-55

209

BR-402

458068

5633865

366

411

-55

208

BR-403

457857

5633935

364

450

-55

211

BR-404

457902

5634015

364

480

-54

209

BR-410

456193

5634289

369

678

-47

35

BR-420

455687

5635281

377

435

-57

229

About the Dixie Project

The 100% owned flagship Dixie project boasts one of the largest recent gold discoveries in a Canadian mining jurisdiction.  Proximal to major infrastructure near the town of Red Lake, Ontario, the Dixie property comprises over 91.4 square kilometres of contiguous claims that extend over 22 kilometres with a paved highway and provincial power and natural gas lines.  The property also hosts a network of well-maintained logging roads which facilitate access.

To date, Great Bear has completed a total of 630 drill holes (283,000 metres), identifying three high-grade gold discoveries.  The most significant discovery is the large-scale “LP Fault” zone, which comprises high-grade disseminated gold mineralization within broad moderate-to-lower-grade envelopes in felsic volcanic and sediment units.  LP Fault drilling has identified gold mineralization along 11 kilometres of strike length to date, and a detailed drill grid is being completed along approximately 4 kilometres of strike length.  The nearby “Hinge” and “Limb” gold zones are more characteristic of the renowned Red Lake mined deposits, comprising gold-bearing quartz veins and silica-sulphide replacement zones hosted by mafic volcanic units.  Over 80% of the Company’s drill holes into the LP Fault, Dixie Limb and Hinge zones contain visible gold mineralization.  Gold occurs mainly as free gold, neither bound to nor within sulphide minerals.

Great Bear adheres to industry-leading quality assurance / quality control (QA/QC) practices in data collection, analysis and disclosure, and detailed assays including all historical LP Fault drill hole data are available on the Company’s website at https://greatbearresources.ca/projects/overview/dixie-project-data/.

About Great Bear

Great Bear Resources Ltd. is a Vancouver-based gold exploration company focused on advancing its 100% owned Dixie project in Northwestern Ontario, Canada.  A significant exploration drill program is currently underway to define the mineralization within a large-scale, high-grade disseminated gold discovery made in 2019, the LP Fault.  Additional exploration drilling is also in progress to expand and infill nearby high-grade gold zones, as well as to test new regional targets.  The Company is currently in the process of compiling all historical data together with incoming assay results, with the goal of publishing an initial NI 43-101 compliant multi-million ounce mineral resource estimate for the Dixie project in early 2022. 

Great Bear is a committed partner to all stakeholders, with a long-term vision of sustainable exploration to advance the Dixie project in a manner that demonstrates good stewardship of land, operational excellence and accountability.

QA/QC and Core Sampling Protocols

Drill core is logged and sampled in a secure core storage facility located in Red Lake Ontario.  Core samples from the program are cut in half, using a diamond cutting saw, and are sent to Activation Laboratories in Ontario, an accredited mineral analysis laboratory, for analysis. All samples are analysed for gold using standard Fire Assay-AA techniques. Samples returning over 10.0 g/t gold are analysed utilizing standard Fire Assay-Gravimetric methods.  Pulps from approximately 5% of the gold mineralized samples are submitted for check analysis to a second lab.  Selected samples are also chosen for duplicate assay from the coarse reject of the original sample.  Selected samples with visible gold are also analyzed with a standard 1 kg metallic screen fire assay.  Certified gold reference standards, blanks and field duplicates are routinely inserted into the sample stream, as part of Great Bear’s quality control/quality assurance program (QAQC).  No QAQC issues were noted with the results reported herein. 

Qualified Person and NI 43-101 Disclosure

Mr. R. Bob Singh, P.Geo, VP Exploration, and Ms. Andrea Diakow P.Geo, VP Projects for Great Bear are the Qualified Persons as defined by National Instrument 43-101 responsible for the accuracy of technical information contained in this news release.

ON BEHALF OF THE BOARD

“Chris Taylor”

Chris Taylor, President and CEO

Investor Inquiries:
Ms. Jenni Piette,
Director, Sustainability and Stakeholder Relations
Tel: 604-646-8354
info@greatbearresources.ca
www.greatbearresources.ca

Cautionary note regarding forward-looking statements

This release contains certain “forward looking statements” and certain “forward-looking information” as defined under applicable Canadian and U.S. securities laws. Forward-looking statements and information can generally be identified by the use of forward-looking terminology such as “may”, “will”, “should”, “expect”, “intend”, “estimate”, “anticipate”, “believe”, “continue”, “plans” or similar terminology. The forward-looking information contained herein is provided for the purpose of assisting readers in understanding management’s current expectations and plans relating to the future. Readers are cautioned that such information may not be appropriate for other purposes.

Forward-looking information are based on management of the parties’ reasonable assumptions, estimates, expectations, analyses and opinions, which are based on such management’s experience and perception of trends, current conditions and expected developments, and other factors that management believes are relevant and reasonable in the circumstances, but which may prove to be incorrect.

Such factors, among other things, include: impacts arising from the global disruption caused by the Covid-19 coronavirus outbreak, business integration risks; fluctuations in general macroeconomic conditions; fluctuations in securities markets; fluctuations in spot and forward prices of gold or certain other commodities; change in national and local government, legislation, taxation, controls, regulations and political or economic developments; risks and hazards associated with the business of mineral exploration, development and mining (including environmental hazards, industrial accidents, unusual or unexpected formations pressures, cave-ins and flooding); discrepancies between actual and estimated metallurgical recoveries; inability to obtain adequate insurance to cover risks and hazards; the presence of laws and regulations that may impose restrictions on mining; employee relations; relationships with and claims by local communities and indigenous populations; availability of increasing costs associated with mining inputs and labour; the speculative nature of mineral exploration and development (including the risks of obtaining necessary licenses, permits and approvals from government authorities); and title to properties.

Great Bear undertakes no obligation to update forward-looking information except as required by applicable law. Such forward-looking information represents management’s best judgment based on information currently available. No forward-looking statement can be guaranteed and actual future results may vary materially. Accordingly, readers are advised not to place undue reliance on forward-looking statements or information.

Release – Kratos Air Wolf Tactical Drone System Completes Successful Flight at Burns Flat Oklahoma Range Facility


Kratos Air Wolf Tactical Drone System Completes Successful Flight at Burns Flat, Oklahoma Range Facility


SAN DIEGO
Aug. 25, 2021 (GLOBE NEWSWIRE) — 
Kratos Defense & Security Solutions, Inc. (NASDAQ: KTOS), a leading National Security Solutions provider announced today that its Air Wolf Tactical Drone System completed a 100 percent successful flight at the recently approved 
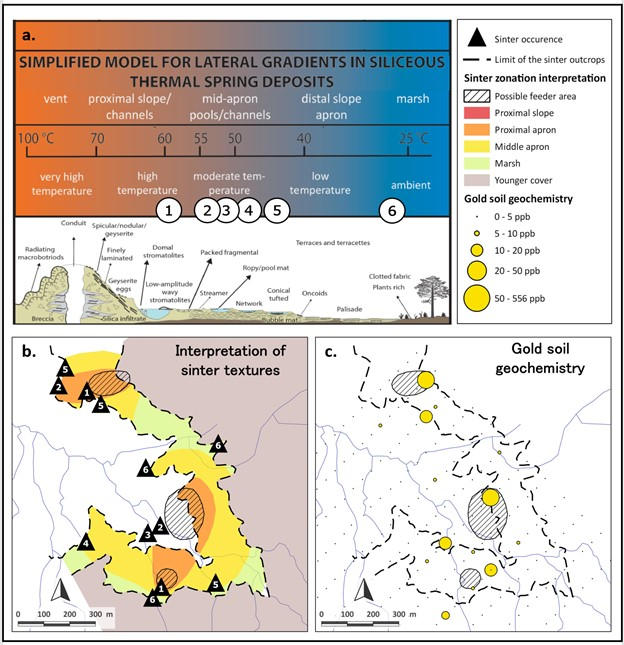
Burns Flat, Oklahoma Range Facility.  
The Kratos Air Wolf Mission, which was the inaugural flight at the 
Burns Flat Range location, included multiple new payloads carried by the Air  Wolf Drone, including a proprietary Kratos artificial intelligence/autonomy system, which has been developed by Kratos specifically for high performance, jet drone aircraft. 

Air Wolf is one of several drones in Kratos’ family of affordable, high-performance jet drones that are flying today, also including the attritable UTAP-22 Mako, XQ-58A Valkyrie, and the reusable X-61A Gremlins drone with the Gremlins Program Prime being with Kratos’ strategic partner Dynetics.  The newly approved 
Burns Flat Test Range and Facility is an important new strategic asset available to Kratos, enabling Kratos to accelerate its drone testing and demonstration, further increasing Kratos’ ability to rapidly develop and demonstrate jet drones, supporting subsystems, and other tactical systems and aircraft.  For competitive, security and other considerations, no additional information will be provided regarding the successful Air Wolf flight and mission.

Steve Fendley, President of Kratos Unmanned Systems Division, said, “This successful Air Wolf flight at the recently approved 
Burns Flat Range facility is the latest example of the teaming approach Kratos routinely takes with its partners at the local, state and federal government levels with the objective of accelerating technology development and a focus on science, technology, engineering, and math advancement.  The Air Wolf drone system that successfully flew today demonstrated a number of new mission systems which we believe are operationally and tactically relevant for Kratos’ government customer set, as our proven commercial development approach and robust digital engineering, modeling and simulation capabilities, and affordability-focused processes continue to successfully rapidly deliver affordable high performance jet aircraft, not just models, surrogates, or renditions.”

Eric DeMarco, President and CEO of Kratos, said, “Kratos thanks  Senator Inhofe, the 
Federal Aviation Administration and all other government stakeholders in bringing the 
Burns Flat Range and Test facility to a reality, and we believe that 
Burns Flat will be an incredibly valuable asset to the 
State of Oklahoma and for companies like Kratos.  Kratos’ Ghost Works played an incredibly important role in today’s successful Air Wolf flight, and with our Valkyrie, Mako, Gremlin and Air Wolf drones, we believe that we are ready now, today, to meet our customers’ requirements with a family of affordable, high performance jet drones in the disposable, reusable and attritable classes.”

About Kratos Defense & Security Solutions

Kratos Defense & Security Solutions, Inc. (NASDAQ:KTOS) develops and fields transformative, affordable technology, platforms and systems for United States National Security related customers, allies and commercial enterprises. Kratos is changing the way breakthrough technology for these industries are rapidly brought to market through proven commercial and venture capital backed approaches, including proactive research and streamlined development processes. At Kratos, affordability is a technology, and we specialize in unmanned systems, satellite communications, cyber security/warfare, microwave electronics, missile defense, hypersonic systems, training, combat systems and next generation turbo jet and turbo fan engine development. For more information, please visit www.KratosDefense.com.
Notice Regarding Forward-Looking Statements
Certain statements in this press release may constitute “forward-looking statements” within the meaning of the Private Securities Litigation Reform Act of 1995. These forward-looking statements are made on the basis of the current beliefs, expectations and assumptions of the management of Kratos and are subject to significant risks and uncertainty. Investors are cautioned not to place undue reliance on any such forward-looking statements. All such forward-looking statements speak only as of the date they are made, and Kratos undertakes no obligation to update or revise these statements, whether as a result of new information, future events or otherwise. Although Kratos believes that the expectations reflected in these forward-looking statements are reasonable, these statements involve many risks and uncertainties that may cause actual results to differ materially from what may be expressed or implied in these forward-looking statements. For a further discussion of risks and uncertainties that could cause actual results to differ from those expressed in these forward-looking statements, as well as risks relating to the business of Kratos in general, see the risk disclosures in the Annual Report on Form 10-K of Kratos for the year ended December 27, 2020, and in subsequent reports on Forms 10-Q and 8-K and other filings made with the SEC by Kratos.

Press Contact:
Yolanda White
858-812-7302 Direct

Investor Information:
877-934-4687
investor@kratosdefense.com

Source: Kratos Defense & Security Solutions, Inc.

Release – Aurania Identifies New Epithermal Gold-Silver Target in Ecuador


Aurania Identifies New Epithermal Gold-Silver Target in Ecuador


Toronto, Ontario, August 25, 2021 – Aurania Resources Ltd. (TSXV: ARU) (OTCQB: AUIAF) (Frankfurt: 20Q) (“Aurania” or the “Company”) reports that a new epithermal target with associated gold enrichment in soil over an area of 0.67 square kilometres, has been identified near the Kuri-Yawi target in the Company’s Lost Cities – Cutucu Project area (“Project”) in southeastern Ecuador.

Sinter blocks and outcrops were found in an area approximately 1 kilometre long at Latorre C target (see Press Release dated February 28, 2018) situated immediately north of the Kuri-Yawi targets. Soil sampling returned gold values up to 0.56 grams per tonne (“g/t”) in close proximity to the Latorre C sinters.  MobileMT geophysical data show that a conductive area is located beneath the sinter area – the conductive area could be due to sulphides in an epithermal system.

Aurania’s Chairman & CEO, Dr. Keith Barron commented, “Our epithermal exploration team has identified a new target while the other teams have been driving our drilling programs in the Tsenken and Tiria-Shimpia areas.  The enrichment of gold in soil is up to 0.56 g/t, which is of considerable significance in soil.    The target therefore is epithermal gold below the sinter – which would have been a Yellowstone-like silica platform around geyser systems at the time of gold deposition approximately 170 million years ago.  We believe that this Latorre C target forms part of the same epithermal system as Kuri-Yawi where other relicts of sinter terraces have been found.


Reconstruction of Sinter Platforms at Latorre C

In exploration for epithermal gold-silver in an area dominated by silica terraces, and where the target mineralization is “blind” and covered, the goal is to find the actual geyser conduit where boiling water or steam would have escaped to the surface.  This is the plumbing system which would have transitioned downward to open fractures, which over time would be filled in by minerals to form veins.

The hottest part of the system, where the vent is located, is too hostile environment for life, other than bacteria, to thrive. The hot water that is ejected can travel considerable distances downslope away from the vent, supporting more diverse life-forms and depositing silica as it cools.  Silica-encrusted bacterial formations, algal mats and reed or bullrush impressions in silica will indicate where you are in relation to the vent.    A close examination of the sinter fossils allows one to vector into the geyser vent, which can be a drill target.

Silica-encrusted, fossilized features have been used to partially reconstruct the sinter platforms to identify the likely position of buried silica veins at Latorre C as shown in Figure 1b.  Three core areas have been identified.  These targets are prioritized on the basis of support from other datasets, including soil geochemistry and MobileMT geophysics, as discussed below.

Figure 1. Interpretation of sinter in the Latorre C area.
a.) Simplified model profile through a sinter system showing the location of the different siliceous features in a hot spring deposit system (from Hamilton et al., 2019).
b.) Interpretation of sinter features in the Kuri-Yawi target area: 1. Domal stromatolite; 2. Packed fragmental; 3. Streamer; 4. Ropy pool mat; 5. Conical tuff; 6. Clotted fabric with plant stems and roots.
c.) Gold in soil relative to the sinters

Soil Geochemistry and Geophysics Data from the Sinter area

MobileMT data show a weakly conductive zone lying beneath the sinter area (Figure 1b) that could be due to limited sulphide content typical of low sulphidation epithermal systems.  Soil samples taken from a soil grid returned gold values up to 0.56g/t in the vicinity of the sinter centres (Figure 1c).

Sample Analysis & Quality Assurance / Quality Control (“QAQC”)

Laboratories: The samples were prepared for analysis at MS Analytical (“MSA”) in Cuenca, Ecuador, and the analyses were done in Vancouver, Canada.

Sample preparation: Soil samples consisted of approximately one kilogram of clay from the iron-rich “B” horizon at each sample point. The soil samples were dried and subsequently screened through 80 mesh (using screens with apertures of approximately 0.18 millimetres).  A 250 gram (“g”) split of the material that passed through 80 mesh was pulverized to 85% passing 0.075mm and was packaged for shipment to the analytical facility.

Analytical procedure:  A 0.5g split of the -0.075mm fraction of soil samples underwent digestion with aqua regia, and the liquid was analyzed for 48 elements by ICP-MS. Apart from being analyzed by ICP-MS, gold was also analyzed by fire assay with an ICP-AES finish.

QAQC: Aurania personnel inserted a certified standard pulp sample, alternating with a field blank, at approximate 20 sample intervals in all sample batches. Aurania’s analysis of results from its independent QAQC samples showed the batches reported on above, lie within acceptable limits.  In addition, the labs reported that the analyses had passed their internal QAQC tests.

Qualified Person

The geological information contained in this news release has been verified and approved by Jean-Paul Pallier, MSc.  Mr. Pallier is a designated EurGeol by the European Federation of Geologists and a Qualified Person as defined by National Instrument 43-101, Standards of Disclosure for Mineral Projects of the Canadian Securities Administrators.

About Aurania

Aurania is a mineral exploration company engaged in the identification, evaluation, acquisition and exploration of mineral property interests, with a focus on precious metals and copper in South America.  Its flagship asset, The Lost Cities – Cutucu Project, is located in the Jurassic Metallogenic Belt in the eastern foothills of the Andes mountain range of southeastern Ecuador.

Information on Aurania and technical reports are available at www.aurania.com and www.sedar.com, as well as on Facebook at https://www.facebook.com/auranialtd/, Twitter at  https://twitter.com/auranialtd, and LinkedIn at https://www.linkedin.com/company/aurania-resources-ltd-.

For further information, please contact:

Carolyn Muir

VP Investor Relations

Aurania Resources Ltd.

(416) 367-3200

carolyn.muir@aurania.com

Dr. Richard Spencer

President

Aurania Resources Ltd.

(416) 367-3200

richard.spencer@aurania.com

Neither the TSX Venture Exchange nor its Regulation Services Provider (as that term is defined in the policies of the TSX Venture Exchange) accepts responsibility for the adequacy or accuracy of this release.

Forward-Looking Statements

This news release may contain forward-looking information that involves substantial known and unknown risks and uncertainties, most of which are beyond the control of Aurania. Forward-looking statements include estimates and statements that describe Aurania’s future plans, objectives or goals, including words to the effect that Aurania or its management expects a stated condition or result to occur. Forward-looking statements may be identified by such terms as “believes”, “anticipates”, “expects”, “estimates”, “may”, “could”, “would”, “will”, or “plan”. Since forward-looking statements are based on assumptions and address future events and conditions, by their very nature they involve inherent risks and uncertainties. Although these statements are based on information currently available to Aurania, Aurania provides no assurance that actual results will meet management’s expectations. Risks, uncertainties and other factors involved with forward-looking information could cause actual events, results, performance, prospects and opportunities to differ materially from those expressed or implied by such forward-looking information. Forward looking information in this news release includes, but is not limited to Aurania’s objectives, goals or future plans, statements, exploration results, potential mineralization, the corporation’s portfolio, treasury, management team and enhanced capital markets profile, the estimation of mineral resources, exploration, timing of the commencement of operations and estimates of market conditions. Factors that could cause actual results to differ materially from such forward-looking information include, but are not limited to, failure to identify mineral resources, failure to convert estimated mineral resources to reserves, the inability to complete a feasibility study which recommends a production decision, the preliminary nature of metallurgical test results, delays in obtaining or failures to obtain required governmental, regulatory, environmental or other project approvals, political risks, inability to fulfill the duty to accommodate indigenous peoples, uncertainties relating to the availability and costs of financing needed in the future, changes in equity markets, inflation, changes in exchange rates, fluctuations in commodity prices, delays in the development of projects, capital and operating costs varying significantly from estimates and the other risks involved in the mineral exploration and development industry, the effects of COVID-19 on the business of the Company including but not limited to the effects of COVID-19 on the price of commodities, capital market conditions, restrictions on labour and international travel and supply chains, and those risks set out in Aurania’s public documents filed on SEDAR. Although Aurania believes that the assumptions and factors used in preparing the forward-looking information in this news release are reasonable, undue reliance should not be placed on such information, which only applies as of the date of this news release, and no assurance can be given that such events will occur in the disclosed time frames or at all. Aurania disclaims any intention or obligation to update or revise any forward-looking information, whether as a result of new information, future events or otherwise, other than as required by law.

Helius Medical Technologies (HSDT)(HSM:CA) – $32 Million Market Cap With A Multi-Billion TAM – Whats The Disconnect?

Wednesday, August 25, 2021

Helius Medical Technologies (HSDT)(HSM:CA)
$32 Million Market Cap With A Multi-Billion TAM – What’s The Disconnect?

Helius Medical Technologies is a neurotech company focused on neurological wellness. The Company’s purpose is to develop, license and acquire unique and non-invasive platform technologies that amplify the brain’s ability to heal itself. The Company’s first commercial product is the Portable Neuromodulation Stimulator (PoNSTM). For more information, visit www.heliusmedical.com.

Joe Gomes, Senior Research Analyst, Noble Capital Markets, Inc.

Refer to the full report for the price target, fundamental analysis, and rating.

    Can’t See the Forest For the Trees? We believe investors are missing the big picture at Helius Medical Technologies. Last week the Company received its second Breakthrough Designation from the U.S. Food and Drug Administration (FDA) for its PoNS device, this time for treatment of stroke patients with dynamic gait and balance deficits. Investors are missing the importance of the announcement, in our view.

    Second Breakthrough Designation.  To put last week’s announcement in perspective, there are over 400 companies with a Breakthrough Device Designation. Only 5.65% have FDA clearance, which Helius is one of them. For a company to have a second BDD puts Helius in rare air …


This Company Sponsored Research is provided by Noble Capital Markets, Inc., a FINRA and S.E.C. registered broker-dealer (B/D).

*Analyst certification and important disclosures included in the full report. NOTE: investment decisions should not be based upon the content of this research summary.  Proper due diligence is required before making any investment decision. 

Sierra Metals (SMTS)(SMT:CA) – Virtual Road Show Take-Aways

Wednesday, August 25, 2021

Sierra Metals (SMTS)(SMT:CA)
Virtual Road Show Take-Aways

As of April 24, 2020, Noble Capital Markets research on Sierra Metals is published under ticker symbols (SMTS and SMT:CA). The price target is in USD and based on ticker symbol SMTS. Research reports dated prior to April 24, 2020 may not follow these guidelines and could account for a variance in the price target.

Sierra Metals Inc is a precious and base metals producer in Latin America. The company acquires, explores, extracts, and produces mineral concentrates consisting of silver, copper, lead, zinc and gold in Mexico and Peru. Its activity includes the operation of the Yauricocha Mine in Peru, and the Bolivar and Cusi mines in Mexico. Yauricocha is an underground polymetallic mine using the sublevel block caving and cut-and-fill mining methods. Bolivar is a copper-silver-zinc-gold underground mine using room-and-pillar mining method. The majority of the revenue is earned by selling of the mineral concentrates to its customers in Peru.

Mark Reichman, Senior Research Analyst of Natural Resources, Noble Capital Markets, Inc.

Refer to the full report for the price target, fundamental analysis, and rating.

    Virtual Roadshow. Noble and Channelchek recently hosted a virtual roadshow featuring Mr. Luis Marchese, Chief Executive Officer, who provided an overview of operations and planned growth initiatives. While the pandemic had reduced the company’s operating work force levels during the first half of 2021, staffing has returned to normal. However, the company is still playing catch up on certain projects that had been planned earlier in the year, including mine development to access higher grade ore bodies. Because the inauspicious start of the new President in Peru has elevated anxiety among investors, the new administration should provide greater certainty with respect to planned mining policies and taxation.

    Strategic growth opportunities.  While Sierra is undergoing a strategic review that could contemplate a sale, the company has significant growth opportunities, including expansion potential at Bolivar utilizing the existing mill, and exploration potential at the Reyna and Batopilas properties in Mexico that could potentially support another mine and mill. Given that Cusi is small and primarily a …


This Company Sponsored Research is provided by Noble Capital Markets, Inc., a FINRA and S.E.C. registered broker-dealer (B/D).

*Analyst certification and important disclosures included in the full report. NOTE: investment decisions should not be based upon the content of this research summary.  Proper due diligence is required before making any investment decision.