Has Bitcoin Lived Up to the Original Vision?


It’s Bitcoin’s 13th Anniversary, Has it Delivered on its Promise?


On the 13th anniversary of the infamous white paper that gave birth to Bitcoin, the question is, “Has Bitcoin lived up to the original vision?”

The short answer is – Absolutely Yes.

The challenge is that there are two sides to Bitcoin

  • Using Bitcoin – what is it and how it works, and
  • Investing in Bitcoin – what it’s worth and where it’s going.

There’s a lot of hype about Bitcoin – but these two things are true.

  • Many people use Bitcoin. Since its launch in 2009, more than 76 million people worldwide have used Bitcoin.
  • Most investors have no idea how it works. One survey says that only about 17% of crypto investors “fully understand” their investment. In contrast, more than 33% have almost no idea how it works. This is not surprising since 40% of all crypto purchases come from new investors.

In this article, we’ll cover, what Bitcoin is and how it works.

We will cover Bitcoin investing in another post (receive Channelchek email updates).


How it All Started – The Birth of Bitcoin
October 31, 2008

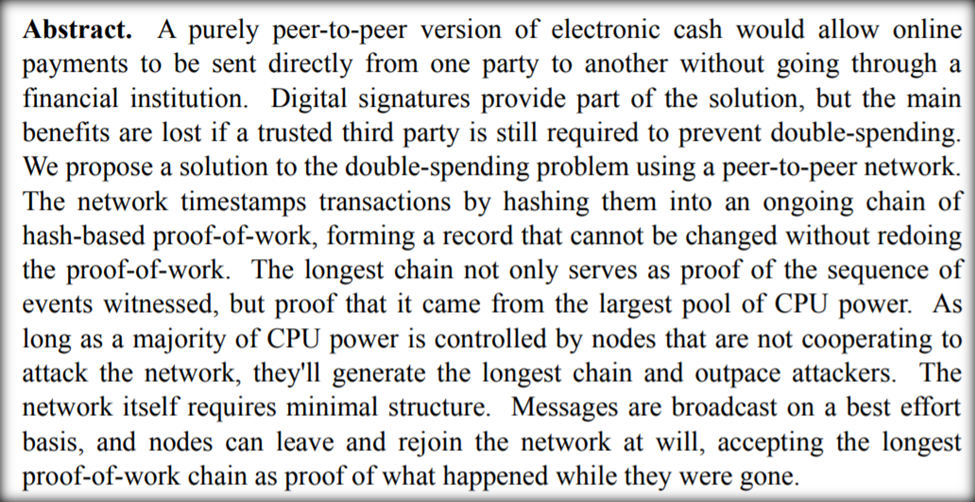
On October 31, 2008, a nine-page white paper titled  “Bitcoin: A Peer-to-Peer Electronic Cash System” was published under the name Satoshi Nakamoto. As anyone familiar with Bitcoin history or legend knows, Nakamoto is a pseudonym. The search for the real “Nakamoto” has been going on since 2008.

The white paper had a brilliant and novel idea to fix an inherent and growing weakness in the current banking system.


Nakamoto Explains the Problem with the Banking System

The majority of commerce on the Internet relied almost exclusively on third-party banks and financial institutions to process electronic payments. This system works well for most transactions. But the weakness is the reliance on a “trust-based model.”

Banks deal with each other by trusting each other to process the transactions – but this trust is not absolute. Bank transactions can be reversed and are also subject to mediation. The increasing cost of mediation and reversal of transactions lead to increase costs.

Merchants hassle customers for information to try and minimize the certain, inevitable, and acceptable amount of fraud that occurs in this system

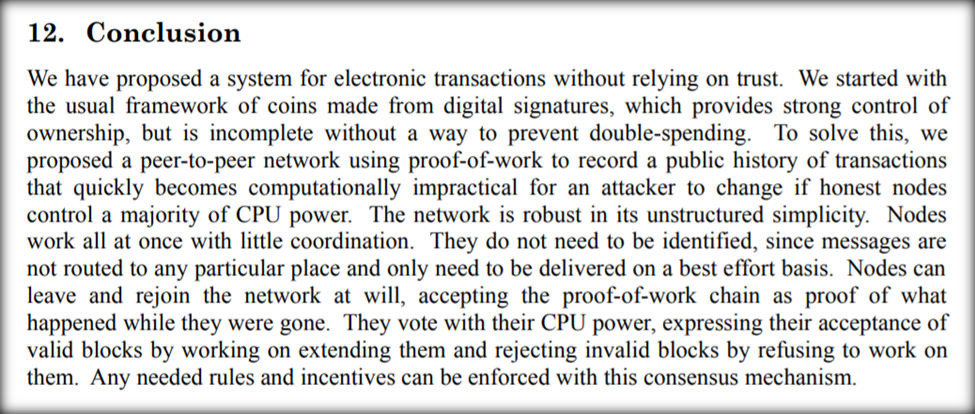
What was needed was a method allowing two willing parties to transact directly with each other without needing a trusted third party, namely banks.

The parties did not need to trust each other or even know each other. The transactions would be protected from fraud because they were “computationally impractical to reverse” and had routine escrow mechanisms.

And there is an impossible-to-change (can you say “blockchain”) timestamp server that generates proof of the chronology of the transaction.


Source: Bitcoin: A Peer-to-Peer Electronic Cash System (October 31, 2008)


So What is Bitcoin and is it a Currency?

Bitcoin is described as a decentralized digital currency.

It is known as a cryptocurrency because it uses cryptography algorithms for security.

That’s what Bitcoin is. Here is what Bitcoin is not:

  • Physical. There are no coins or anything physical, only balances kept on an encrypted ledger.
  • A Currency. The IRS classifies Bitcoin as property, like stocks painting or real estate. Although people use it like currency when they pay in Bitcoin, this can make tax time a bit of a nightmare to figure out. The IRS does a good job of explaining virtual currencies, cryptocurrencies and when a transaction is, or is not, taxable.
  • Backed By Anything. Bitcoin is not backed by banks, gold, or anything of value.  Some people argue that money, like the US dollar, is not backed by anything either. Since the dollar went off the gold standard in 1976, the dollar has been a fiat currency. But it is backed by the “full faith and credit of the US government.” Bitcoins are backed by the full faith and credit on no one, no company, and no government.


An Absolute Limited Number of Bitcoins

Supporters argue that Bitcoins have value because there can only be a limited number of Bitcoins created. Ever.

And that number is 21 million.

When Nakamoto wrote the Bitcoin source code, he set the upper limit at 21 million Bitcoins. He gave no explanation. But supporters argue this gives value to Bitcoin.  They also believe this is a  massive advantage to Bitcoin, the world’s oldest cryptocurrency,  over other cryptocurrencies.

Bitcoins are created when they are “mined.”

“Mining” is done using sophisticated hardware and software to solve an extremely complex computational math problem. Whoever solves the problem first is awarded the next block of Bitcoins, and the process begins again.

According to Nakamoto’s source code, the ability to mine Bitcoins stops after 21 million are mined.


How Many Bitcoins are Currently in Circulation

As of August 2021, 18.7 million Bitcoins have been mined – that’s 83% of the total possible. You would think that the rest of the Bitcoins would be created in the next few years. But that would be wrong.

97% of Bitcoins will likely be mined within the next decade. But it is predicted that the remaining 3% will not be mined entirely until 2140, almost a century later.

This is because the code has an embedded process called “halving.” which reduces the number of Bitcoins released by 50% every four years.

Many investors believe this absolute limited supply creates a “store of value” that will continue to push up the price of Bitcoin. On the other hand, governments can print unlimited amounts of their fiat currencies, like dollars or rupees, which devalues their currencies.


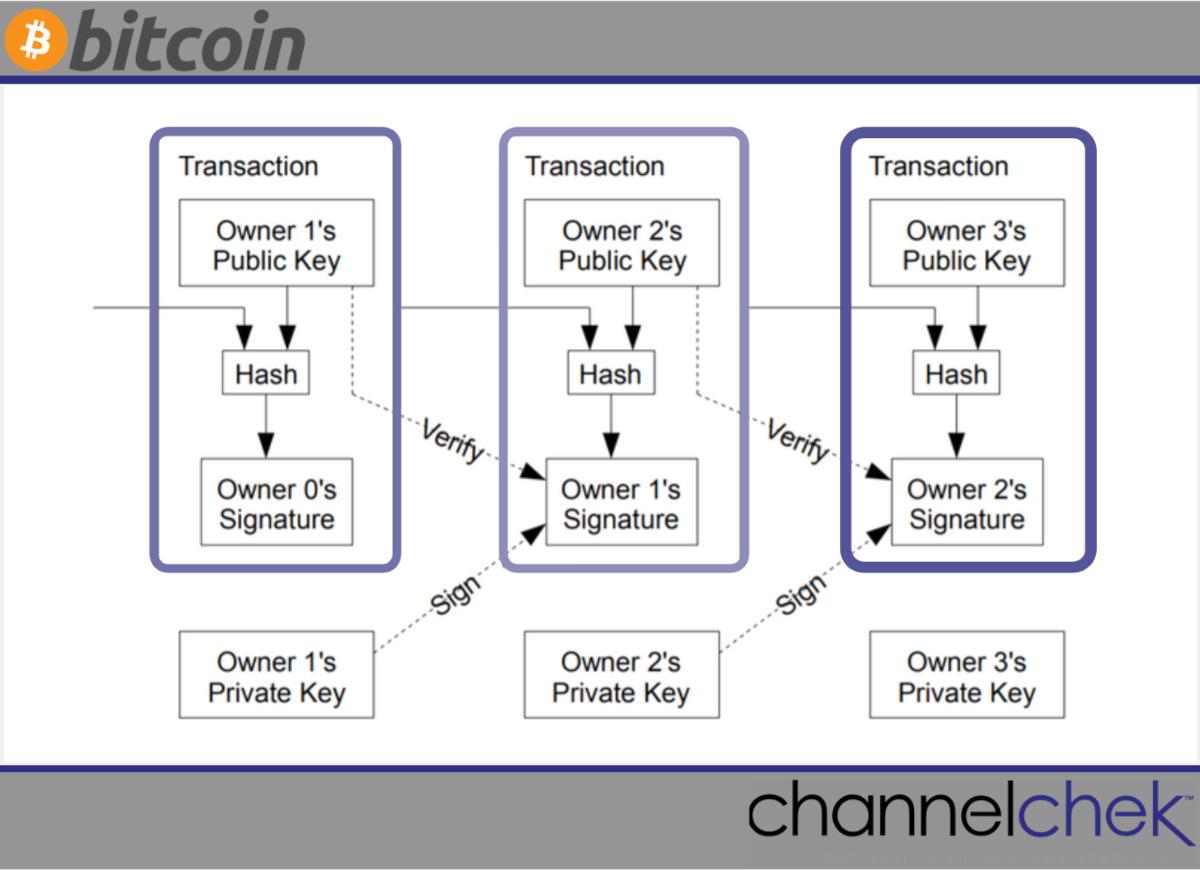
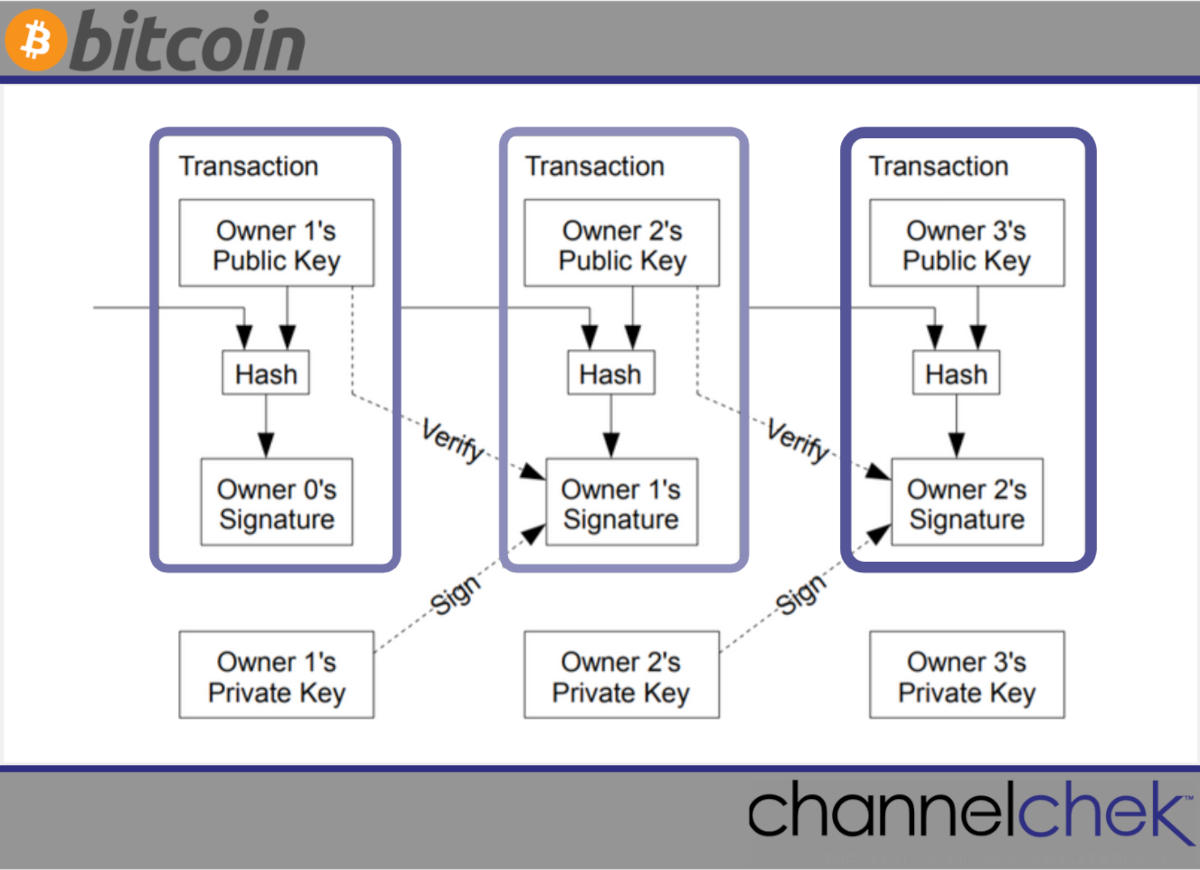
Source: Bitcoin: A
Peer-to-Peer Electronic Cash System (October 31, 2008)


So, Has Bitcoin Lived Up to the Original
Vision?

Nakamoto wanted, “A purely peer-to-peer version of electronic cash would allow online payments to be sent directly from one party to another without going through a financial institution. “

Did he/she/they accomplish this vision?

Absolutely.

As of January 2020, Bitcoin reached 400,000 transactions per day, which is more than any other cryptocurrency.

Nakamoto wanted, “A purely peer-to-peer version of electronic cash that would allow online payments to be sent directly from one party to another without going through a financial institution.”

Did Nakatomi accomplish this vision?

Absolutely.

As of January 2020, Bitcoin reached 400,000 transactions per day, which is more than any other cryptocurrency.

The current price of a Bitcoin is over $60,000, and the market value of all Bitcoins in circulation today is about $866 billion.

Nakamoto reached his vision and more.


Suggested Reading:


Crypto’s Ancillary Businesses as an Opportunity for Investors


Opportunities and Challenges With Yield Farming


Why Researching Investment Ideas is Important


What the Approved Bitcoin ETFs do for the Markets


Sources:

How
Many People Own Blockchain

How
Much do Crypto Investors Know

Whitepaper –
Bitcoin Peer-Peer Electronic Cash System

IRS
– Virtual Currencies

IRS
— FAQ on Virtual Currency

Number
of Bitcoin Transactions Worldwide


Stay up to date. Follow us:


QuickChek – October 28, 2021


Palladium One Reports Four New EM Targets at the Tyko Sulphide Copper- Nickel Project, Ontario, Canada

Palladium One Mining announced that four significant, multi-line, Electromagnetic anomalies have been identified by a 3,100 line-kilometer Versatile Time Domain Electromagnetic airborne (“VTEMmax”) survey conducted during the summer field program

Research, News & Market Data on Palladium One

Watch recent presentation from Palladium One


1-800-FLOWERS.COM, Inc. Reports 9.0 Percent Revenue Growth for Its Fiscal 2022 First Quarter

1-800-FLOWERS.COM announced results for its fiscal 2022 first quarter ended September 26, 2021

See today’s FLWS research report from Michael Kupinski, Director of Research at Noble Capital Markets

Research, News & Market Data on 1-800-FLOWERS.COM


Esports Entertainment Group Submits Transactional Waiver to New Jersey Division of Gaming Enforcement

Esports Entertainment Group announced that its transactional waiver for the New Jersey Division of Gaming Enforcement has been submitted. Once approved, it would allow the Company to begin betting operations in the Garden State

Research, News & Market Data on EEG

Watch recent presentation from EEG


Voyager Digital Secures $75 Million Strategic Investment from Alameda Research

Voyager Digital announced a $75 million investment from Alameda Research

Research, News & Market Data on Voyager Digital

Watch recent presentation from Voyager Digital


Capstone Green Energy (NASDAQ:CGRN) To Power Cutting Edge Microgrid With Integrated Electric Vehicle (EV) Charging Stations In Italy

Capstone Green Energy announced that IBT Connecting Energies GmbH, Capstone’s exclusive distributor in Italy and Greece, secured an order for three C65 microturbines for a cutting edge microgrid with integrated electric vehicle charging stations in Italy

Research, News & Market Data on Capstone Green Energy

Watch recent presentation from Capstone Green Energy


Stay up to date. Follow us:


Release – Palladium One Reports Four New EM Targets at the Tyko Sulphide Copper- Nickel Project Ontario, Canada


Palladium One Reports Four New EM Targets at the Tyko Sulphide Copper- Nickel Project, Ontario, Canada


  • Four significant, multi-line, Electromagnetic (“EM”) anomalies have been identified by a 3,100 line-kilometer Versatile Time Domain Electromagnetic airborne (“VTEMmax”) survey conducted during the summer field program.
  • Several single line EM anomalies were also identified.
  • The first EM anomalies identified in the large mafic-ultramafic Bulldozer Intrusion.

October 28, 2021 – Toronto, Ontario – Preliminary results of the recently completed VTEMmax airborne survey have identified four significant multi-line EM anomalies on the Tyko Copper-Nickel Project, said Palladium One Mining (“Palladium One” or the “Company”) (TSXV: PDM, FRA: 7N11, OTC: NKORF) today.

Derrick Weyrauch, President and CEO “We now have four new multi-line EM anomalies to test, which supports our belief that there are multiple Smoke Lake-type zones yet to be discovered. Of particular interest are two anomalies in the Bulldozer Intrusion. These are the first EM anomalies identified in this large mafic-ultramafic intrusion and hint at potentially large tonnage targets.We are very pleased with these regional results and are awaiting results from the Smoke Lake zone.”

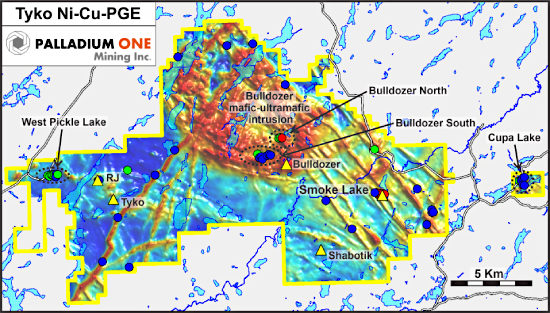
The recently completed 100-meter spaced 3,100 line-kilometer VTEMmax survey is the largest and most sensitive EM survey ever flow on the Tyko Project (Figure 1). The survey easily detected the at surface high-grade Smoke Lake zone producing a 600m (7 lines) EM anomaly (Figure 2). In addition, a weak single line EM anomaly successfully detected the RJ zone, this is noteworthy as the RJ zone hosts blebby to locally net textured sulphide and had not been detected by three previous airborne EM surveys. This speaks to the sensitivity of the VTEMmax system and its potential to identify targets that were missed by less sensitive historic EM surveys.

Bedrock Conductor Picks

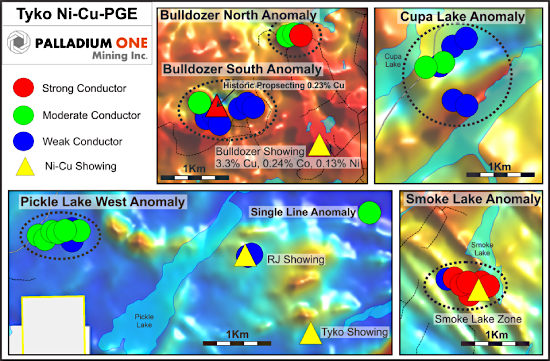
The EM anomalies presented below are bedrock conductors selected by Platform Geoscience Ltd. These represent preliminary interpretations based of the response recorded on each VTEMmax flight line. The difference between strong, moderate and weak conductors is not only a measure of massive vs semi-massive vs net-textured sulphide, but also depth where a weak EM response may simply indicate a deeper stronger conductor, whereas a smaller at surface conductor will have a stronger EM response.

The four new multiline EM anomalies are in new areas with no previously known mineralization or drilling, and are described below:

West Pickle Lake Anomaly

A 600-meter multi-line anomaly is located 2.5 kilometers west of the RJ zone and may represent an extension of the RJ zone. The RJ zone consists of blebby, locally net-textured magmatic sulphide and has returned up to 1.04 % Ni and 0.23% Cu over 16.2 meters in hole TK16-002 (see news release April 12, 2016).

Bulldozer South Anomaly

The composite anomaly consists of two clusters which combined are over 800-meters in length. This anomaly is noteworthy as there is a historic anomalous prospecting sample collected in the vicinity, which returned 0.23% Cu with anomalous nickel (144 ppm) and palladium (18 ppb) in melanogabbro, with 5% finely disseminated pyrite and chalcopyrite (see Ontario Mineral Deposit Index MDI000000001913). This anomaly also correlates with a very strong magnetic portion of the Bulldozer Intrusion suggesting ultramafic rocks may be present at depth.

Bulldozer North Anomaly

This 200-meter multi-line anomaly is noteworthy as one line contains a strong EM anomaly which is comparable in intensity to the anomalies detected over the Smoke Lake zone. The Bulldozer North, like Bulldozer South anomalies correlate with a very strongly magnetic portion of the Bulldozer Intrusion, potentially representing ultramafic rocks.

The Bulldozer North and South Anomalies represent the first EM anomalies detected within the large mafic-ultramafic Bulldozer Intrusion. The Bulldozer intrusion is host to one historic copper-nickel-cobalt showing, which consists of remobilized disseminated chalcopyrite and pyrite in a shear, suggesting that more widespread copper-nickel-cobalt mineralization may occur within the larger intrusion. Sampling by the Company in 2019 at the historic Bulldozer showing returned 0.91% Cu, 0.05% Ni, and 0.05% Co (see press release January 21, 2020) with historic samples returning up to 3.34% Cu, 0.12% Ni, 0.24% Co, 0.38 g/t Pd, 0.08 g/t Pt (see Ontario Mineral Deposit Index MDI000000001901).

Cupa Lake Anomaly

This anomaly consists of a cluster of two multi-line anomalies which when combined cover 400 meters of strike length. These anomalies are present in an area where previous mapping by the Ontario Geological survey has identified metasediments and mafic volcanics representing remnants of greenstone belt material within the Black Pic tonalite batholith, and hence may represent favourable conditions for the perseveration of magmatic copper-nickel sulphide mineralization similar to the Smoke Lake zone, located only 8-kilometers to the west.

Summer Smoke Lake Drill Program

The resumed Phase II drill program at Smoke Lake completed an additional 1,973 meters in 9 holes, assay results are pending. The program included an 800-meter deep hole targeting a large inverted magnetic high located below the Smoke Lake zone. This deep hole was drilled for geophysical surveying and was surveyed by Borehole Electromagnetics (“BHEM”) to help determine the possible presents of massive sulphide mineralization at depth, results are pending. The Company intends to drill additional holes into the inverted magnetic high where it outcrops east of Smoke Lake. An Induced Polarization (“IP”) survey is also planed for the Smoke Lake area to target potential for disseminated Ni-Cu mineralization.

Summer Field Program

Mapping, prospecting, soil sampling, and trenching was completed over the Tyko Project, including the four new high priority multi-line EM anomalies. A total of 1,340 soil samples were collected, results are pending.

Figure 1. Tyko Project, with new airborne magnetic data (total field) showing various new VTEMmax anomalies (new multi-lines EM anomalies are highlighted by dashed black lines) and known Ni-Cu showings (yellow triangles).


Figure 2. Zoom in view of the Smoke Lake and four new high priority multi-line VTEMmax EM anomalies.


*Nickel Equivalent (“Ni_Eq”)

Nickel and copper equivalent is calculated using US$1,600 per ounce for palladium, US$1,100 per ounce for platinum, US$1,650 per ounce for gold, US$3.50 per pound for copper, US$7.50 per pound for nickel and US$20 per pound for Cobalt. This calculation is consistent with the commodity prices used in the Company’s September 2021 NI 43-101 Haukiaho resource estimate.

QA/QC

The Phase II drilling program was carried out under the supervision of Neil Pettigrew, M.Sc., P. Geo., Vice President of Exploration and a director of the Company.

Drill core samples were split using a rock saw by Company staff, with half retained in the core box. The drill core samples were transported by company staff the Company’s core handling facility, to Actlabs laboratory in Thunder Bay, Ontario. Actlabs, is an accredited lab and are ISO compliant (ISO 9001:2015, ISO/IEC 17025:2017). PGE analysis was performed using a 30 grams fire assay with an ICP-MS or ICP-OES finish. Multi-element analyses, including copper and nickel were analysed by four acid digestion using 0.5 grams with an ICP-MS or ICP-OES finish.

Certified standards, blanks and crushed duplicates are placed in the sample stream at a rate of one QA/QC sample per 10 core samples. Results are analyzed for acceptance at the time of import. All standards associated with the results in this press release were determined to be acceptable within the defined limits of the standard used

About Tyko Ni-Cu-PGE Project

The Tyko Ni-Cu-PGE Project, is located approximately 65 kilometers northeast of Marathon Ontario, Canada. Tyko is an early stage, high sulphide tenor, nickel-copper (2:1 ratio) project with the most recent drill hole intercepts returning up to 10.1% Ni_Eq over 3.8 meters (8.1% Ni, 2.9% Cu, 0.1% Co, 0.61g/t Pd, 0.71g/t Pt, and 0.02g/t Au) in hole TK-20-023.

Qualified Person

The technical information in this release has been reviewed and verified by Neil Pettigrew, M.Sc., P. Geo., Vice President of Exploration and a director of the Company and the Qualified Person as defined by National Instrument 43-101.

About Palladium One

Palladium One Mining Inc. is an exploration company targeting district scale, platinum-group-element (PGE)-copper-nickel deposits in Finland and Canada. Its flagship project is the Läntinen Koillismaa or LK Project, a palladium-dominant platinum group element-copper-nickel project in north-central Finland, ranked by the Fraser Institute as one of the world’s top countries for mineral exploration and development. Exploration at LK is focused on targeting disseminated sulfides along 38 kilometers of favorable basal contact and building on an established NI 43-101 open pit resource.

ON BEHALF OF THE BOARD
“Derrick Weyrauch”
President & CEO, Director

For further information contact:
Derrick Weyrauch, President & CEO
Email: info@palladiumoneinc.com

Neither the TSX Venture Exchange nor its Market Regulator (as that term is defined in the policies of the TSX Venture Exchange) accepts responsibility for the adequacy or accuracy of this release.

This press release is not an offer or a solicitation of an offer of securities for sale in the United States of America. The common shares of Palladium One Mining Inc. have not been and will not be registered under the U.S. Securities Act of 1933, as amended, and may not be offered or sold in the United States absent registration or an applicable exemption from registration.

Information set forth in this press release may contain forward-looking statements. Forward-looking statements are statements that relate to future, not past events. In this context, forward-looking statements often address a company’s expected future business and financial performance, and often contain words such as “anticipate”, “believe”, “plan”, “estimate”, “expect”, and “intend”, statements that an action or event “may”, “might”, “could”, “should”, or “will” be taken or occur, or other similar expressions. By their nature, forward-looking statements involve known and unknown risks, uncertainties and other factors which may cause our actual results, performance or achievements, or other future events, to be materially different from any future results, performance or achievements expressed or implied by such forward-looking statements. Such factors include, among others, risks associated with project development; the need for additional financing; operational risks associated with mining and mineral processing; fluctuations in palladium and other commodity prices; title matters; environmental liability claims and insurance; reliance on key personnel; the absence of dividends; competition; dilution; the volatility of our common share price and volume; and tax consequences to Canadian and U.S. Shareholders. Forward-looking statements are made based on management’s beliefs, estimates and opinions on the date that statements are made and the Company undertakes no obligation to update forward-looking statements if these beliefs, estimates and opinions or other circumstances should change. Investors are cautioned against attributing undue certainty to forward-looking statements.

Release – 1-800-FLOWERS.COM Inc. Reports 9.0 Percent Revenue Growth for Its Fiscal 2022 First Quarter


1-800-FLOWERS.COM, Inc. Reports 9.0 Percent Revenue Growth for Its Fiscal 2022 First Quarter


  • Total net revenues increased 9.0 percent to $309.4 million, compared with $283.8 million in the prior year period. This revenue growth was on top of the 51.5 percent revenue growth reported in the Company’s year-ago first quarter.
  • Net loss for the quarter was $13.2 million, or ($0.20) per share. Adjusted net loss1 was $12.9 million, or ($0.20) per share, compared with a net loss of $9.8 million, or ($0.15) per share, and adjusted net loss of $6.5 million, or ($0.10) per share, in the prior year period.
  • Adjusted EBITDA1 loss for the quarter was $5.3 million, compared with adjusted EBITDA of $3.2 million in the prior year period.
  • Company reaffirms its full-year guidance including revenue growth of 10.0 percent-to-12.0 percent and adjusted EBITDA growth of 5.0 percent-to-8.0 percent.

(1 Refer to “Definitions of Non-GAAP Financial Measures” and the tables attached at the end of this press release for reconciliation of non-GAAP results to applicable GAAP results.)  

JERICHO, N.Y.–(BUSINESS WIRE)– 1-800-FLOWERS.COM, Inc. (NASDAQ: FLWS), a leading e-commerce provider of products and services designed to inspire more human expression, connection, and celebration, today reported results for its fiscal 2022 first quarter ended September 26, 2021.

Chris McCann, CEO of 1-800-FLOWERS.COM, Inc., said “We are very pleased to report strong revenue growth for what was one of our most challenging year-over-year comparisons. Importantly, our 9.0 percent revenue growth for the quarter was on top of the 51.5 percent revenue growth we reported in the first quarter last year. This illustrates the strong growth momentum that we have been building over the past several years. As we had anticipated, the first quarter this year started out somewhat slowly with demand gradually ramping up resulting in double-digit revenue growth for the month of September.”

McCann said that increased recognition and relevance for its family of brands for everyday gifting and connective occasions, as well as its expanded product offering, including PersonalizationMall.com, were

primary drivers of the strong revenue growth. “We also continued to see strong growth in our Celebrations Passport loyalty program, which helps drive increased purchase frequency, retention, and life-time value along with solid growth in customers buying from multiple product categories and multiple brands.”

McCann noted that, “the combination of these positive trends positions us well to deliver on our guidance for double-digit revenue growth in fiscal 2022 on top of the tremendous growth we achieved last year. As we head into our fiscal second quarter, which includes the important year-end holiday season, we are cognizant of several significant headwinds affecting the marketplace, including limited availability and increased costs for labor, increased digital marketing costs, and wide-spread delays and rising costs for shipping.

“We have implemented a number of initiatives designed to help mitigate the impact of these issues and take advantage of the strong ecommerce demand we anticipate during the key holiday season. These initiatives include strategic pricing programs across our brands, as well as the significant investments we have made in our operating platform, including pre-building inventory, which leverages our expanded cold-storage facilities, and deploying automation in our warehouse and distribution facilities to increase throughput and reduce reliance on seasonal labor. As a result, we are well positioned to help our customers connect and express themselves with the important people in their lives for both everyday occasions and the key holiday season and drive solid top and bottom-line performance.”

First Quarter 2022 Financial Results

Total consolidated revenues increased 9.0 percent to 
$309.4 million, compared with total consolidated revenues of 
$283.8 million in the prior year period, reflecting strong ecommerce growth of 10.3 percent including contributions from PersonalizationMall, which the Company acquired on August 3, 2020. Excluding the non-comparable five weeks of contribution from PersonalizationMall in the quarter, total net revenues increased 4.3 percent, compared with the prior year period.

Gross profit margin for the quarter was 40.6 percent, a decline of 10 basis points compared with 40.7 percent in the prior year period. Operating expenses as a percent of total revenues, increased 170 basis points to 47.1 percent of total sales, compared with 45.4 percent of total sales in the prior year period primarily reflecting higher, year-over-year digital marketing rates.

The combination of these factors resulted in an adjusted EBITDA loss of 
$5.3 million, compared with adjusted EBITDA of 
$3.2 million in the prior year period. Net loss for the quarter was 
$13.2 million, or (
$0.20) per share. Adjusted net loss was 
$12.9 million, or (
$0.20) per share, compared with a net loss of 
$9.8 million, or (
$0.15) per share, and adjusted net loss of 
$6.5 million, or (
$0.10) per share, in the prior year period.

Segment Results:

The Company provides selected financial results for its Gourmet Foods and Gift Baskets, Consumer Floral and Gifts, and BloomNet segments in the tables attached to this release and as follows:

  • Gourmet Foods and Gift Baskets: Revenues for the quarter increased 8.4 percent to 
    $97.5 million, compared with 
    $89.9 million in the prior year period. The strong growth was primarily driven by increased demand for the Company’s gourmet food gift brands for everyday occasions. Gross profit margin was 35.0 percent, a decline of 390 basis points compared with 38.9 percent in the prior year period, primarily reflecting increased costs for labor and transportation. Segment contribution margin was a loss of 
    $7.7 million, compared with a loss of 
    $2.6 million, and an adjusted loss of 
    $3.0 million, in the prior year period, reflecting higher year-over-year marketing costs as well as the reduced gross margin.
  • Consumer Floral and Gifts: Total revenues in this segment increased 12.2 percent to 
    $181.2 million, compared with 
    $161.5 million in the prior year period. Excluding the non-comparable five weeks of contribution from PersonalizationMall in the quarter, total revenues in this segment increased 3.9 percent. Gross profit margin increased 130 basis points to 41.9 percent, compared with 40.6 percent in the prior year period, primarily reflecting contributions from PersonalizationMall. Segment contribution margin was 
    $19.2 million, essentially unchanged compared with the prior year period, primarily reflecting increased digital marketing costs offset by contributions from PersonalizationMall.
  • BloomNet: Revenues for the quarter were 
    $30.8 million, a decline of 5.8 percent, compared with 
    $32.7 million in the prior year period, primarily reflecting delays in hard goods shipments as well as reduced order volume from third-party online floral companies. Gross profit margin increased 470 basis points to 50.0 percent, compared with 45.3 percent in the prior year period, primarily reflecting product mix. Segment contribution margin increased 4.2 percent to 
    $10.9 million, compared with 
    $10.4 million in the prior year period.

Company Guidance

The Company is reaffirming its guidance for its fiscal 2022 year, which includes:

  • Total revenue growth of 10.0 percent-to-12.0 percent compared with the prior year;
  • Adjusted EBITDA growth of 5.0 percent-to-8.0 percent compared with the prior year;
  • EPS in line with fiscal 2021 as improved EBITDA is offset by higher depreciation and a higher effective tax rate; and
  • Free Cash Flow to exceed 
    $100 million.

The Company’s guidance for the year is based on several factors, including:

  • The significant increase in consumers shopping online where the Company’s broad product offering and brand portfolio makes it a leading destination for customers looking for solutions to help them connect, express themselves and celebrate – sentiments that have become more important than ever;
  • Significant expansion of the Company’s product offering, both organically and through strategic acquisitions like Shari’s Berries and PersonalizationMall;
  • The expanded size of the Company’s customer file along with continued positive customer behavior trends; and
  • Continued strong growth in the Company’s Celebrations Passport® loyalty program, which is helping drive increased frequency, retention, and cross-category/cross-brand purchases.

Definitions of non-GAAP Financial Measures:

We sometimes use financial measures derived from consolidated financial information, but not presented in our financial statements prepared in accordance with 
U.S. generally accepted accounting principles

(“GAAP”). Certain of these are considered “non-GAAP financial measures” under the 
U.S. Securities and

Exchange Commission rules. Non-GAAP financial measures referred to in this document are either labeled as “non-GAAP” or designated as such with a “1”. See below for definitions and the reasons why we use these non-GAAP financial measures. Where applicable, see the Selected Financial Information below for reconciliations of these non-GAAP measures to their most directly comparable GAAP financial measures.

EBITDA and Adjusted EBITDA:

We define EBITDA as net income (loss) before interest, taxes, depreciation, and amortization. Adjusted EBITDA is defined as EBITDA adjusted for the impact of stock-based compensation, Non-Qualified Plan Investment appreciation/depreciation, and for certain items affecting period-to-period comparability. See

Selected Financial Information for details on how EBITDA and adjusted EBITDA were calculated for

each period presented. The Company presents EBITDA and adjusted EBITDA because it considers such information meaningful supplemental measures of its performance and believes such information is

frequently used by the investment community in the evaluation of similarly situated companies. The Company uses EBITDA and adjusted EBITDA as factors to determine the total amount of incentive compensation available to be awarded to executive officers and other employees. The Company’s credit agreement uses EBITDA and adjusted EBITDA to determine its interest rate and to measure compliance with certain covenants. EBITDA and adjusted EBITDA are also used by the Company to evaluate and price potential acquisition candidates. EBITDA and adjusted EBITDA have limitations as analytical tools and should not be considered in isolation or as a substitute for analysis of the Company’s results as reported under GAAP. Some of the limitations are: (a) EBITDA and adjusted EBITDA do not reflect changes in, or cash requirements for, the Company’s working capital needs; (b) EBITDA and adjusted

EBITDA do not reflect the significant interest expense, or the cash requirements necessary to service interest or principal payments, on the Company’s debts; and (c) although depreciation and amortization are non-cash charges, the assets being depreciated and amortized may have to be replaced in the future and EBITDA does not reflect any cash requirements for such capital expenditures. EBITDA and adjusted EBITDA should only be used on a supplemental basis combined with GAAP results when evaluating the Company’s performance.

Segment Contribution Margin and Adjusted Segment Contribution Margin:

We define segment contribution margin as earnings before interest, taxes, depreciation, and amortization, before the allocation of corporate overhead expenses. Adjusted contribution margin is defined as contribution margin adjusted for certain items affecting period-to-period comparability. See Selected Financial Information for details on how segment contribution margin and adjusted segment

contribution margin were calculated for each period presented. When viewed together with our GAAP

results, we believe segment contribution margin and adjusted segment contribution margin provide

management and users of the financial statements meaningful information about the performance of our business segments. Segment contribution margin and adjusted segment contribution margin are used in addition to and in conjunction with results presented in accordance with GAAP and should not be relied upon to the exclusion of GAAP financial measures. The material limitation associated with the use of the segment contribution margin and adjusted segment contribution margin is that they are an incomplete measure of profitability as they do not include all operating expenses or non-operating income and expenses. Management compensates for these limitations when using this measure by looking at other GAAP measures, such as operating income and net income.

Adjusted Net Income (Loss) and Adjusted or Comparable Net Income (Loss) Per Common Share:

We define adjusted net income (loss) and adjusted or comparable net income (loss) per common share as net income (loss) and net income (loss) per common share adjusted for certain items affecting period to period comparability. See Selected Financial Information below for details on how adjusted net income (loss) and adjusted or comparable net income (loss) per common share were calculated for each period presented. We believe that adjusted net income (loss) and adjusted or comparable EPS are meaningful measures because they increase the comparability of period-to-period results. Since these are not measures of performance calculated in accordance with GAAP, they should not be considered in isolation of, or as a substitute for, GAAP net income (loss) and net income (loss) per common share, as indicators of operating performance and they may not be comparable to similarly titled measures employed by other companies.

Free Cash Flow:

We define free cash flow as net cash provided by operating activities less capital expenditures. The Company considers free cash flow to be a liquidity measure that provides useful information to management and investors about the amount of cash generated by the business after the purchases of fixed assets, which can then be used to, among other things, invest in the Company’s business, make strategic acquisitions, strengthen the balance sheet, and repurchase stock or retire debt. Free cash flow is a liquidity measure that is frequently used by the investment community in the evaluation of similarly situated companies. Since free cash flow is not a measure of performance calculated in accordance with GAAP, it should not be considered in isolation or as a substitute for analysis of the Company’s results as reported under GAAP. A limitation of the utility of free cash flow as a measure of financial performance is that it does not represent the total increase or decrease in the company’s cash balance for the period.

About 1-800-FLOWERS.COM, Inc.

About 1-800-FLOWERS.COM, Inc. 1-800-FLOWERS.COM, Inc. is a leading provider of gifts designed to help customers express, connect and celebrate. The Company’s e-commerce business platform features an all-star family of brands, including: 1-800-Flowers.com®, 1-800-Baskets.com®, Cheryl’s Cookies®, Harry & David®, PersonalizationMall.com®, Shari’s Berries®, FruitBouquets.com®, Moose Munch®, The Popcorn Factory®, Wolferman’s Bakery®, Vital Choice®, Stock Yards® and Simply Chocolate®. Through the Celebrations Passport® loyalty program, which provides members with free standard shipping and no service charge across our portfolio of brands, 1-800-FLOWERS.COM, Inc. strives to deepen relationships with customers. The Company also operates BloomNet®, an international floral and gift industry service provider offering a broad-range of products and services designed to help members grow their businesses profitably; Napco?, a resource for floral gifts and seasonal décor; and DesignPac Gifts, LLC, a manufacturer of gift baskets and towers. 1-800-FLOWERS.COM, Inc. was recognized among the top 5 on the National Retail Federation’s 2021 Hot 25 Retailers list, which ranks the nation’s fastest-growing retail companies. Shares in 1-800-FLOWERS.COM, Inc. are traded on the NASDAQ Global Select Market, ticker symbol: FLWS. For more information, visit 1800flowersinc.com or follow @1800FLOWERSInc on Twitter. [FLWS-COMP / FLWS-FN / FLWS-VC]

Special Note Regarding Forward Looking Statements:

This press release contains forward-looking statements within the meaning of the Private Securities Litigation Reform Act of 1995. These forward-looking statements represent the Company’s current expectations or beliefs concerning future events and can generally be identified using statements that include words such as “estimate,” “expects,” “project,” “believe,” “anticipate,” “intend,” “plan,”

“foresee,” “forecast,” “likely,” “will,” “target” or similar words or phrases. These forward-looking statements are subject to risks, uncertainties, and other factors, many of which are outside of the Company’s control, which could cause actual results to differ materially from the results expressed or

implied in the forward-looking statements, including, but not limited to, statements regarding the Company’s ability to achieve its guidance for the fiscal-year 2022 second quarter; the impact of the Covid-19 pandemic on the Company; its ability to successfully integrate acquired businesses and assets; its ability to successfully execute its strategic initiatives; its ability to cost-effectively acquire and retain customers; the outcome of contingencies, including legal proceedings in the normal course of business; its ability to compete against existing and new competitors; its ability to manage expenses associated with sales and marketing and necessary general and administrative and technology investments; its ability to reduce promotional activities and achieve more efficient marketing programs; and general consumer sentiment and industry and economic conditions that may affect levels of discretionary customer purchases of the Company’s products. Reconciliations for forward looking figures would require unreasonable efforts at this time because of the uncertainty and variability of the nature and amount of certain components of various necessary GAAP components, including for example those related to compensation, tax items, amortization or others that may arise during the year, and the Company’s management believes such reconciliations would imply a degree of precision that would be confusing or misleading to investors. The lack of such reconciling information should be considered when assessing the impact of such disclosures. The Company undertakes no obligation to publicly update any of the forward-looking statements, whether because of new information, future events or otherwise, made in this release or in any of its SEC filings. Consequently, you should not consider any such list to be a complete set of all potential risks and uncertainties. For a more detailed description of these and other risk factors, refer to the Company’s SEC filings, including the Company’s Annual Reports on Form 10-K and its Quarterly Reports on Form 10-Q.

Conference Call:

The Company will conduct a conference call to discuss the above details and attached financial results today, Thursday, October 28, 2021, at 8:00 a.m. (ET). The conference call will be webcast live from the Investor Relations section of the Company’s website at www.1800flowersinc.com. A recording of the call will be posted on the Investor Relations section of the Company’s web site within two hours of the call’s completion. A replay of the call can be accessed beginning at 2:00 p.m. ET on the day of the call through November 4, 2021, at: (US) 1-877-344-7529; (
Canada) 855-669-9658; (International) 1-412-317-0088; enter conference ID #: 10148432.

Note: The attached tables are an integral part of this press release without which the information presented in this press release should be considered incomplete.

1-800-FLOWERS.COM, Inc. and Subsidiaries

Condensed Consolidated Balance Sheets

(in thousands)


September 26, 2021


June 27, 2021


(unaudited)


Assets


Current assets:


Cash and cash equivalents


$

3,785


$

173,573


Trade receivables, net


30,635


20,831


Inventories, net


282,439


153,863


Prepaid and other


68,644


51,792


Total current assets


385,503


400,059


Property, plant and equipment, net


216,083


215,287


Operating lease right-of-use assets


114,345


86,230


Goodwill


208,150


208,150


Other intangibles, net


138,144


139,048


Other assets


27,661


27,905


Total assets


$

1,089,886


$

1,076,679


Liabilities and Stockholders’ Equity


Current liabilities:


Accounts payable


$

65,363


$

57,434


Accrued expenses


172,998


178,512


Current maturities of long-term debt


25,000


20,000


Current portion of long-term operating lease liabilities


11,453


9,992


Total current liabilities


274,814


265,938


Long-term debt, net


156,811


161,512


Long-term operating lease liabilities


107,532


79,375


Deferred tax liabilities


33,421


34,162


Other liabilities


26,934


26,622


Total liabilities

599,512


567,609


Total stockholders’ equity


490,374


509,070


Total liabilities and stockholders’ equity


$

1,089,886


$

1,076,679


1-800-FLOWERS.COM, Inc. and Subsidiaries

Selected Financial Information

Consolidated Statements of Operations

(in thousands, except for per share data)

(unaudited)


Three Months Ended


September 26, 2021


September 27, 2020

Net revenues:


E-commerce

263,371


$ 238,863

Other

46,002


44,909

Total net revenues

309,373


283,772

Cost of revenues

183,859


168,292

Gross profit

125,514


115,480

Operating expenses:


Marketing and sales

94,379


80,285

Technology and development

13,423


11,603

General and administrative

27,066


28,213

Depreciation and amortization

10,970


8,840

Total operating expenses

145,838


128,941

Operating loss

(20,324)


(13,461)

Interest expense, net

1,528


1,040

Other income, net

596


999

Loss before income taxes

(21,256)


(13,502)

Income tax benefit

(8,057)


(3,740)

Net loss

(13,199)


$ (9,762)


Basic and diluted net loss per common share

$(0.20)


$ (0.15)


Basic and diluted weighted average shares used in the calculation of net loss per common share

65,062


64,320

1-800-FLOWERS.COM, Inc. and Subsidiaries

Selected Financial Information

Consolidated Statements of Cash Flows

(in thousands)

(unaudited)


Three months ended


September 26, 2021


September 27, 2020


Operating activities:


Net loss

$ (13,199)


$ (9,762)

Adjustments to reconcile net loss to net cash used in operating activities:


Depreciation and amortization

10,970


8,840

Amortization of deferred financing costs

299


156

Deferred income taxes

(741)


(603)

Bad debt expense

(96)


(280)

Stock-based compensation

3,005


2,393

Other non-cash items

260


261

Changes in operating items:


Trade receivables

(9,708)


(15,154)

Inventories

(128,577)


(77,854)

Prepaid and other

(16,852)


(10,374)

Accounts payable and accrued expenses

2,415


7,046

Other assets and liabilities

2,060


4,623

Net cash used in operating activities

(150,164)


(90,708)


Investing activities:


Acquisitions, net of cash acquired


(250,943)

Capital expenditures, net of non-cash expenditures

(11,122)


(6,958)

Purchase of equity investments


(325)

Net cash used in investing activities

(11,122)


(258,226)


Financing activities:


Acquisition of treasury stock

(9,065)


(1,088)

Proceeds from exercise of employee stock options

563


221

Proceeds from bank borrowings


220,000

Repayment of notes payable and bank borrowings


(97,500)

Debt issuance cost


(2,193)

Net cash (used in) provided by financing activities

(8,502)


119,440


Net change in cash and cash equivalents

(169,788)


(229,494)

Cash and cash equivalents:


Beginning of period

173,573


240,506

End of period

$ 3,785


$ 11,012

1-800-FLOWERS.COM, Inc. and Subsidiaries

Selected Financial Information – Category Information

(dollars in thousands) (unaudited)

Three Months Ended

September 26,
2021

Transaction
Costs

As Adjusted
(non-GAAP)
September 26, 2021

September 27,
2020

PersonalizationMall
Litigation &
Transaction Costs

Harry & David
Store Closure
Costs

As Adjusted
(non-GAAP)
September 27, 2020

%
Change

Net revenues:

Consumer Floral & Gifts

$ 181,229

$ –

$ 181,229

$ 161,546

$ –

$ –

$ 161,546

12.2%

BloomNet

30,834


30,834

32,738


32,738

-5.8%

Gourmet Foods & Gift Baskets

97,482

97,482

89,929


89,929

8.4%

Corporate

45

45

106

106

-57.5%

Intercompany eliminations

(217)


(217)

(547)


(547)

60.3%

Total net revenues

$ 309,373

$ –

$ 309,373

$ 283,772

$ –

$ –

$ 283,772

9.0%


Gross profit:

Consumer Floral & Gifts

$ 76,003

$ 76,003

$ 65,586

$ 65,586

15.9%

41.9%

41.9%

40.6%

40.6%


BloomNet

15,409

15,409

14,838

14,838

3.8%

50.0%

50.0%

45.3%

45.3%


Gourmet Foods & Gift Baskets

34,163

34,163

35,007

35,007

-2.4%

35.0%

35.0%

38.9%

38.9%


Corporate

(61)

(61)

49

49

-224.5%

-135.6%

-135.6%

46.2%

46.2%


Total gross profit

$ 125,514

$ –

$ 125,514

$ 115,480

$ –

$ –

$ 115,480

8.7%

40.6%

40.6%

40.7%

40.7%


EBITDA (non-GAAP):

Segment Contribution Margin (non-GAAP) (a):

Consumer Floral & Gifts

$ 19,190

$ –

$ 19,190

$ 19,236

$ –

$ –

$ 19,236

-0.2%

BloomNet

10,860

10,860

10,421

10,421

4.2%

Gourmet Foods & Gift Baskets

(7,673)


(7,673)

(2,581)


(405)

(2,986)

-157.0%

Segment Contribution Margin Subtotal

22,377

22,377

27,076

(405)

26,671

-16.1%

Corporate (b)

(31,731)

456

(31,275)

(31,697)

4,890


(26,807)

-16.7%

EBITDA (non-GAAP)

(9,354)

456

(8,898)

(4,621)

4,890

(405)

(136)

-6442.6%

Add: Stock-based compensation

3,005

3,005

2,393

2,393

25.6%

Add: Compensation charge related to NQ Plan Investment Appreciation

567


567

980


980

-42.1%

Adjusted EBITDA (non-GAAP)

$ (5,782)

$ 456

$ (5,326)

$ (1,248)

$ 4,890

$ (405)

$ 3,237

-264.5%


1-800-FLOWERS.COM, Inc. and Subsidiaries

Selected Financial Information

(in thousands) (unaudited)


Reconciliation of net loss to adjusted net loss (non-GAAP):

Three Months Ended

September 26, 2021

September 27, 2020


Net loss

$ (13,199)

$ (9,762)

Adjustments to reconcile net loss to adjusted net loss (non-GAAP)

Add: Transaction costs

456

4,890

Deduct: Harry & David store closure cost adjustment

(405)

Deduct: Income tax effect on adjustments

(173)

(1,242)

Adjusted net loss (non-GAAP)

$ (12,916)

$ (6,519)


Basic and diluted net loss per common share

$ (0.20)

$ (0.15)


Basic and diluted adjusted net loss per common share (non-GAAP)

$ (0.20)

$ (0.10)


Weighted average shares used in the calculation of net loss
and adjusted net loss per common share

65,062

64,320

1-800-FLOWERS.COM, Inc. and Subsidiaries

Selected Financial Information

(in thousands) (unaudited)


Reconciliation of net loss to adjusted EBITDA (non-GAAP):

Three Months Ended

September 26, 2021

September 27, 2020


Net loss

$ (13,199)

$ (9,762)

Add: Interest expense and other, net

932

41

Add: Depreciation and amortization

10,970

8,840

Deduct: Income tax benefit

8,057

3,740

EBITDA

(9,354)

(4,621)

Add: Stock-based compensation

3,005

2,393

Add: Compensation charge related to NQ plan investment appreciation

567

980

Add: Transaction costs

456

4,890

Deduct: Harry & David store closure cost adjustment

(405)

Adjusted EBITDA

$ (5,326)

$ 3,237

(a) Segment performance is measured based on segment contribution margin or segment Adjusted EBITDA, reflecting only the direct controllable revenue and operating expenses of the segments, both of which are non-GAAP measurements. As such, management’s measure of profitability for these segments does not include the effect of corporate overhead, described above, depreciation and amortization, other income (net), and other items that we do not consider indicative of our core operating performance.
(b) Corporate expenses consist of the Company’s enterprise shared service cost centers, and include, among other items, Information Technology, Human Resources, Accounting and Finance, Legal, Executive and Customer Service Center functions, as well as Stock-Based Compensation. In order to leverage the Company’s infrastructure, these functions are operated under a centralized management platform, providing support services throughout the organization. The costs of these functions, other than those of the Customer Service Center, which are allocated directly to the above categories based upon usage, are included within corporate expenses as they are not directly allocable to a specific segment.

Investor Contact:

Joseph D. Pititto

(516) 237-6131

invest@1800flowers.com 

Media Contact:

Kathleen Waugh

(516) 237-6028

kwaugh@1800flowers.com      

Source: 1-800-FLOWERS.COM, Inc.
Release – Esports Entertainment Group Submits Transactional Waiver to New Jersey Division of Gaming Enforcement


Esports Entertainment Group Submits Transactional Waiver to New Jersey Division of Gaming Enforcement


Newark, New Jersey–(Newsfile Corp. – October 28, 2021) – Esports Entertainment Group, Inc. (NASDAQ: GMBL) (NASDAQ: GMBLW) (or the “Company”) is pleased to announce that its transactional waiver for the New Jersey Division of Gaming Enforcement (or “DGE”) has been submitted. Once approved, it would allow the Company to begin betting operations in the Garden State.

“New Jersey sports betting reported the first $1 billion handle in September alone and it shows no signs of slowing down anytime soon,” said Grant Johnson, CEO of Esports Entertainment Group. “The transactional waiver is one of the final steps in us being able to go live and bring the exciting world of esports betting to the state of New Jersey.”

In preparation for the issuance of its New Jersey gaming license, the Company opened an office in Hoboken at the beginning of September. In the Company’s October earnings call, it was announced that Q4 revenue was up 63 percent from Q3 and there was a significant increase in stockholder equity to $74.8 million in FY2021.

About Esports Entertainment Group

Esports Entertainment Group is a full stack esports and online gambling company fueled by the growth of video-gaming and the ascendance of esports with new generations. Our mission is to help connect the world at large with the future of sports entertainment in unique and enriching ways that bring fans and gamers together. Esports Entertainment Group and its affiliates are well-poised to help fans and players to stay connected and involved with their favorite esports. From traditional sports partnerships with professional NFL/NHL/NBA/FIFA teams, community-focused tournaments in a wide range of esports, and boots-on-the-ground LAN cafes, EEG has influence over the full-spectrum of esports and gaming at all levels. The Company maintains offices in New Jersey, the UK and Malta. For more information visit www.esportsentertainmentgroup.com.

Forward-Looking Statements

The information contained herein includes forward-looking statements. These statements relate to future events or to our future financial performance, and involve known and unknown risks, uncertainties and other factors that may cause our actual results, levels of activity, performance, or achievements to be materially different from any future results, levels of activity, performance or achievements expressed or implied by these forward-looking statements. You should not place undue reliance on forward-looking statements since they involve known and unknown risks, uncertainties and other factors which are, in some cases, beyond our control and which could, and likely will, materially affect actual results, levels of activity, performance or achievements. Any forward-looking statement reflects our current views with respect to future events and is subject to these and other risks, uncertainties and assumptions relating to our operations, results of operations, growth strategy and liquidity. We assume no obligation to publicly update or revise these forward-looking statements for any reason, or to update the reasons actual results could differ materially from those anticipated in these forward-looking statements, even if new information becomes available in the future. The safe harbor for forward-looking statements contained in the Securities Litigation Reform Act of 1995 protects companies from liability for their forward-looking statements if they comply with the requirements of the Act.

Contact:
U.S. Investor Relations
RedChip Companies, Inc.
Dave Gentry
407-491-4498
dave@redchip.com

Media Inquiries
brandon.apter@esportsentertainmentgroup.com

Investor Relations Inquiries
Jeff@esportsentertainmentgroup.com

Release – Voyager Digital Secures $75 Million Strategic Investment from Alameda Research


Voyager Digital Secures $75 Million Strategic Investment from Alameda Research


Strategic partnership will focus on execution, asset management, and broader crypto initiatives

NEW YORKOct. 28, 2021 /PRNewswire/ – Voyager Digital Ltd. (“Voyager” or the “Company”) (TSX: VOYG) (OTCQX: VYGVF) (FRA: UCD2), one of the fastest-growing, publicly traded cryptocurrency platforms in the United States, today announced a $75 million investment from Alameda Research (“Alameda”).

“We are excited to enter into a strategic alliance with Alameda, a clear pioneer in the crypto industry,” said Steve Ehrlich, CEO and Co-founder of Voyager. “Alameda is one of the largest crypto market makers in the world, and we believe there are significant opportunities in working together. While the immediate opportunity is on the order flow and asset management front, we are tremendously excited about potential future synergistic opportunities in the continuously evolving crypto industry. These opportunities include NFTs and crypto derivatives through Alameda, as well as the creation of thought leadership as we work with lawmakers on shaping regulation.”

“We are thrilled to be partnering with Voyager as they have emerged as a key player in the retail crypto market,” commented Caroline Ellison, Co-CEO of Alameda. “As a public company, we have admired Voyager’s transparency in the industry and believe the management team has laid the groundwork to succeed at scale as evidenced by their explosive growth this past year. Through our strategic partnership, we believe there are endless mutually beneficial opportunities to grow both our businesses.”

Alameda Research trades over $5 billion per day across thousands of products including all major coins and altcoins, as well as their derivatives. Alameda has a full-scale global operation with the ability to trade on all major exchanges and markets. Alameda’s market making abilities and sophisticated market neutral algorithms are a perfect fit to be a core lending partner of Voyager and will allow Voyager to further expand the breadth of its rewards program.

About Voyager Digital Ltd.
Voyager Digital Ltd. (TSX: VOYG;OTCQX: VYGVF; FRA: UCD2) is a fast-growing, publicly traded cryptocurrency platform in the United States founded in 2018 to bring choice, transparency, and cost efficiency to the marketplace. Voyager offers a secure way to trade over 60 different crypto assets using its easy-to-use mobile application and earn rewards up to 12 percent annually on more than 30 cryptocurrencies. Through its subsidiary Coinify ApS, Voyager provides crypto payment solutions for both consumers and merchants around the globe. To learn more about the company, please visit https://www.investvoyager.com.

The TSX has not approved or disapproved of the information contained herein. The Transaction is subject to the satisfaction of certain customary closing conditions, including the receipt of all necessary regulatory and stock exchange approvals, including the approval of the Toronto Stock Exchange.

Cautionary Statement Regarding Forward-Looking Information

This news release contains “forward-looking statements” that are based on expectations, estimates, projections and interpretations as at the date of this news release. Forward-looking statements are frequently characterized by words such as “plan”, “expect”, “project”, “seek”, “intend”, “believe”, “anticipate”, “estimate”, “suggest”, “indicate” and other similar words or statements that certain events or conditions “may” or “will” occur. Such forward looking statements involve known and unknown risks, uncertainties and other factors which may cause the actual results, performance or achievements of the Company to be materially different from any future results, performance or achievements expressed or implied by such forward-looking statements. Such risks and other factors may include, but are not limited to, those risk factors outlined in the Company’s Management Discussion and Analysis as filed on SEDAR. The Company can give no assurances the partnership will advance beyond this original investment. The Company does not undertake to update any forward-looking information except in accordance with applicable securities laws.

Press Contacts:

Voyager Digital, Ltd.
Michael Legg
Chief Communications Officer
(212) 547-8807
mlegg@investvoyager.com

Voyager Public Relations Team
pr@investvoyager.com

SOURCE Voyager Digital (Canada) Ltd.

Release – Capstone Green Energy To Power Cutting Edge Microgrid With Integrated Electric Vehicle Charging Stations In Italy


Capstone Green Energy (NASDAQ:CGRN) To Power Cutting Edge Microgrid With Integrated Electric Vehicle (EV) Charging Stations In Italy


The C65 Microturbines Will be Deployed in a State-of-the-Art CCHP Application

VAN NUYS, CA / ACCESSWIRE / October 28, 2021 / Capstone Green Energy Corporation (www.CapstoneGreenEnergy.com) (NASDAQ:CGRN), a global leader in carbon reduction and on-site resilient green energy solutions, announced today IBT Connecting Energies GmbH (www.ibtgroup.at), Capstone’s exclusive distributor in Italy and Greece, secured an order for three C65 microturbines for a cutting edge microgrid with integrated electric vehicle (EV) charging stations in Italy. IBT partnered with S4E System, a national ESCO provider, to develop the combined cooling heat and power (CCHP) microgrid solution – one of the first of its kind in Italy.

The project is estimated to be commissioned in March 2022 and is expected to dramatically reduce the site’s greenhouse gas emissions by over 1,000 tons annually.

“We invite customers to partner with us and our experienced distributors like IBT in developing smarter energy solutions to help customers lower their carbon footprint, increase cost efficiencies, and add resiliency to their business. Developing this innovative CCHP microgrid solution with integrated EV charging is a reflection of how our customers view their businesses, and they are increasingly demanding more green and sustainable solutions,” said Darren Jamison, President and Chief Executive Officer of Capstone Green Energy.

The state-of-the-art microgrid is comprised of three Capstone C65 microturbines, an absorption chiller, and solar photovoltaic (PV) technologies. The innovative solution will be deployed in a combined cooling, heat and power (CCHP) application utilizing low-pressure natural gas to provide electricity and thermal energy for the end-user.

S4E will own, operate and maintain the equipment, allowing the end-user to focus on their core business operations. Capstone’s clean and green technology was selected as a key component in the integrated EV solution for its modulation capability, high total efficiency and ultra low emissions. The comprehensive solution will provide a reliable and resilient on-site solution with the ability to charge electric vehicles without using the local utility grid.

“The long-term partnership between IBT and S4E was strategic for this project. The great technological and commercial skills of IBT and S4E were decisive for acquiring this complex green energy project,” said Ilario Vigani, Principal of IBT Connecting Energies GmbH.

“Capstone Green Energy and our global distribution network, which today covers 83 countries worldwide, is here to help customers build and maintain ever smarter energy infrastructure and engage with them as a long-term service provider and partner for their critical carbon saving initiatives,” concluded Mr. Jamison.

About Capstone Green Energy
Capstone Green Energy (www.CapstoneGreenEnergy.com) (NASDAQ:CGRN) is a leading provider of customized microgrid solutions and on-site energy technology systems focused on helping customers around the globe meet their environmental, energy savings, and resiliency goals. Capstone Green Energy focuses on four key business lines. Through its Energy as a Service (EaaS) business, it offers rental solutions utilizing its microturbine energy systems and battery storage systems, comprehensive Factory Protection Plan (FPP) service contracts that guarantee life-cycle costs, as well as aftermarket parts. Energy Conversion Products are driven by the Company’s industry-leading, highly efficient, low-emission, resilient microturbine energy systems offering scalable solutions in addition to a broad range of customer-tailored solutions, including hybrid energy systems and larger frame industrial turbines. The Energy Storage Products business line designs and installs microgrid storage systems creating customized solutions using a combination of battery technologies and monitoring software. Through Hydrogen Energy Solutions, Capstone Green Energy offers customers a variety of hydrogen products, including the Company’s microturbine energy systems.

For customers with limited capital or short-term needs, Capstone offers rental systems; for more information, contact: rentals@CGRNenergy.com. To date, Capstone has shipped over 10,000 units to 83 countries and estimates that, in FY21, it saved customers over $217 million in annual energy costs and approximately 397,000 tons of carbon. Total savings over the last three years are estimated at 1,115,100 tons of carbon and $698 million in annual energy savings.

For more information about the Company, please visit: www.CapstoneGreenEnergy.com. Follow Capstone Green Energy on TwitterLinkedInInstagramFacebook, and YouTube.

Cautionary Note Regarding Forward-Looking Statements
This release contains forward-looking statements as defined in the Private Securities Litigation Reform Act of 1995, including statements regarding expectations for green initiatives and execution on the Company’s growth strategy and other statements regarding the Company’s expectations, beliefs, plans, intentions, and strategies. The Company has tried to identify these forward-looking statements by using words such as “expect,” “anticipate,” “believe,” “could,” “should,” “estimate,” “intend,” “may,” “will,” “plan,” “goal” and similar terms and phrases, but such words, terms and phrases are not the exclusive means of identifying such statements. Actual results, performance and achievements could differ materially from those expressed in, or implied by, these forward-looking statements due to a variety of risks, uncertainties and other factors, including, but not limited to, the following: the ongoing effects of the COVID-19 pandemic; the availability of credit and compliance with the agreements governing the Company’s indebtedness; the Company’s ability to develop new products and enhance existing products; product quality issues, including the adequacy of reserves therefor and warranty cost exposure; intense competition; financial performance of the oil and natural gas industry and other general business, industry and economic conditions; the Company’s ability to adequately protect its intellectual property rights; and the impact of pending or threatened litigation. For a detailed discussion of factors that could affect the Company’s future operating results, please see the Company’s filings with the Securities and Exchange Commission, including the disclosures under “Risk Factors” in those filings. Except as expressly required by the federal securities laws, the Company undertakes no obligation to update or revise any forward-looking statements, whether as a result of new information, changed circumstances or future events or for any other reason.

CONTACT:
Capstone Green Energy
Investor and investment media inquiries:
818-407-3628
ir@CGRNenergy.com

SOURCE: Capstone Green Energy Corporation

Orion Group Holdings (ORN) – 3Q2021 Operating Results Lighter Than Expected

Thursday, October 28, 2021

Orion Group Holdings (ORN)
3Q2021 Operating Results Lighter Than Expected

Orion Group Holdings, based in Houston, Texas, is a specialty construction company within the Marine and Industrial Construction sectors, with operations focused in the continental United States and Caribbean. Revenue is split roughly 50/50 between a Marine Construction segment that provides marine facility, pipeline and structural construction services and a Commercial Concrete segment that provides turnkey concrete services in the light commercial and structural construction markets.

Poe Fratt, Senior Research Analyst, Noble Capital Markets, Inc.

Refer to the full report for the price target, fundamental analysis, and rating.

    Weather challenges prevailed…again. 3Q2021 Adjusted EBITDA of negative $0.5 million was ~$5 million below our estimate of $4.5 million and EBITDA margin was also 370 bps light. While we had lowered our estimate based on wet weather in Texas, the main market for the Concrete business, we underestimated the impact on the Marine business. Total revenue of $139.9 million and gross margin of $6.6 million (4.7%) were down sequentially and expenses were higher. Fixed cost absorption was lower and Marine EBITDA dropped to $0.5 million from $7.8 million, while Concrete EBITDA remained negative at -$1.0 million.

    Call today at 10am EST — Number is 201-493-6739 and code is Orion Group Holdings.  On the call, we will look for details on: 1) Impact of weather in 3Q2021 and any lingering impact due to wet weather; 2) 4Q2021 bidding activity for both Marine and Concrete; 3) Prospects for a rebound in overall profitability; 4) Timing of asset sales, including the East West Jones property on the …


This Company Sponsored Research is provided by Noble Capital Markets, Inc., a FINRA and S.E.C. registered broker-dealer (B/D).

*Analyst certification and important disclosures included in the full report. NOTE: investment decisions should not be based upon the content of this research summary.  Proper due diligence is required before making any investment decision. 

Ocugen (OCGN) – Ocugen Files IND For Phase 3 Covaxin Trial

Thursday, October 28, 2021

Ocugen (OCGN)
Ocugen Files IND For Phase 3 Covaxin Trial

Ocugen Inc is a clinical stage biopharmaceutical company. It is focused on discovering, developing and commercializing a pipeline of innovative therapies that address rare and underserved eye diseases. Ocugen offers a diversified ophthalmology portfolio that includes novel gene therapies, biologics, and small molecules and targets a broad range of high-need retinal and ocular surface diseases.

Robert LeBoyer, Senior Research Analyst, Noble Capital Markets, Inc.

Refer to the full report for the price target, fundamental analysis, and rating.

    IND Submitted To Begin Unvaccinated Patient and Booster Study Ocugen has submitted an IND to begin a Phase 3 study testing Covaxin (BBV152) as a vaccine for COVID-19.  The study will enroll unvaccinated patients and those vaccinated at least six months prior to determine if immune responses in US patients are comparable with those seen in the Phase 3 conducted in India. If successful, we expect the data to be submitted for marketing approval.

    Study Design Patients will be randomized to receive two doses of either Covaxin or placebo 28 days apart.  The primary endpoint will compare blood-based samples taken from the US study with samples from patients in the Phase 3 Bharat biotech trial. The secondary endpoints test the vaccine’s immunogenic profile, safety, and tolerability. The company hopes to complete the study during …


This Company Sponsored Research is provided by Noble Capital Markets, Inc., a FINRA and S.E.C. registered broker-dealer (B/D).

*Analyst certification and important disclosures included in the full report. NOTE: investment decisions should not be based upon the content of this research summary.  Proper due diligence is required before making any investment decision. 

1-800-Flowers.com (FLWS) – Caught A Nice One

Thursday, October 28, 2021

1-800-Flowers.com (FLWS)
Caught A Nice One

1-800-FLOWERS.COM, Inc. is the leading provider of gourmet and floral gifts for all occasions. For nearly 40 years, 1-800-FLOWERS® has been helping deliver smiles for customers with gifts for every occasion, including fresh flowers, premium, gift-quality fruits, and other gourmet items from Harry & David®, popcorn and specialty treats from The Popcorn Factory®; cookies and baked gifts from Cheryl’s®; premium chocolates and confections from Fannie May®; gift baskets and towers from 1-800-Baskets.com®; premium English muffins and other breakfast treats from Wolferman’s; carved fresh fruit arrangements from FruitBouquets.com; and top quality steaks and chops from Stock Yards®. The Company’s BloomNet® international floral wire service provides a broad range of quality products and value-added services designed to help professional florists grow their businesses profitably.

Michael Kupinski, Director of Research, Noble Capital Markets, Inc.
Refer to the full report for the price target, fundamental analysis, and rating.

    Attractive tuck-in acquisition. 1-800-Flowers announced that it has acquired Vital Choice, an organic seafood delivery company for $20 million in cash. The transaction will add over 400 food based products to its Gourmet Foods & Gift Baskets business segment and an attractive complement to Harry & David. We estimate that the transaction is less than 1 times revenues and 8 times EBITDA, an attractive price based on a business that has been growing revenues in the double digits and with healthy 10% margins.

    A nice fit.  Vital Choice was founded in 2001 as a premium seafood delivery company and has partnered with dozens of fisheries to ensure it maintains its commitment to quality. It now also offers many other organic foods, such as meats, fruits, and soups, to name a few. The company will be keeping its current management team to head the operations. The company is self consumption based with a …


This Company Sponsored Research is provided by Noble Capital Markets, Inc., a FINRA and S.E.C. registered broker-dealer (B/D).

*Analyst certification and important disclosures included in the full report. NOTE: investment decisions should not be based upon the content of this research summary.  Proper due diligence is required before making any investment decision. 

ACCO Brands (ACCO) – Post Call Commentary Favorable Risk Reward

Thursday, October 28, 2021

ACCO Brands (ACCO)
Post Call Commentary; Favorable Risk/Reward

ACCO Brands Corporation designs, manufactures, sources, markets, and sells office products, academic supplies, and calendar products primarily in the United States, Canada, Northern Europe, Brazil, Australia, and Mexico. It operates through three segments: ACCO Brands North America, ACCO Brands EMEA, and ACCO Brands International. The company offers office products, such as stapling, binding and laminating equipment, and related consumable supplies, as well as shredders and whiteboards; and academic products, including notebooks, folders, decorative calendars, and stationery products. It also provides private label products, as well as business machine maintenance and repair services. The company offers its business, academic, and calendar product lines under the Artline, AT-A-GLANCE, Derwent, Esselte, Five Star, GBC, Hilroy, Leitz, Marbig, Mead, NOBO, Quartet, Rapid, Rexel, Swingline, Tilibra, Wilson Jones, and other brand names. In addition, it designs, sources, distributes, markets, and sells accessories for laptop and desktop computers, and tablets comprising security products; input devices, such as presenters, mice, and trackballs; ergonomic aids, including foot and wrist rests; docking stations; and other personal computers and tablet accessories under the Kensington, Microsaver, and ClickSafe brand names. The company sells its products to consumers and commercial end-users primarily through resellers, including traditional office supply resellers, wholesalers, mass merchandisers, and retailers, as well as directly to consumers through on-line and direct mail. ACCO Brands Corporation is headquartered in Lake Zurich, Illinois.

Joe Gomes, Senior Research Analyst, Noble Capital Markets, Inc.
Joshua Zoepfel, Research Associate, Noble Capital Markets, Inc.

Refer to the full report for the price target, fundamental analysis, and rating.

    Operating Environment Trending Positive. As we mentioned last quarter, the overall operating environment continues to trend in a positive manner, although there remain some potential hiccups. The commercial business continues to improve with the return to the office of workers, worldwide economies are improving, and school instruction continues to return to in-classroom instruction. Commodity inflation and logistics remain the biggest concerns.

    PowerA Continues to Impress.  PowerA contributed $57 million of revenue in 3Q, up from $51 million in 2Q. Notably, the higher PowerA sales were in spite of constrained availability of gaming consoles, sales of which drive PowerA sales. Although management lowered full year expectation for PowerA growth to 20% from 25% due to the lack of gaming consoles, this remains above the 15% originally …


This Company Sponsored Research is provided by Noble Capital Markets, Inc., a FINRA and S.E.C. registered broker-dealer (B/D).

*Analyst certification and important disclosures included in the full report. NOTE: investment decisions should not be based upon the content of this research summary.  Proper due diligence is required before making any investment decision. 

Endeavour Silver (EXK)(EDR:CA) – Updating Estimates Ahead of Upcoming Earnings Release

Thursday, October 28, 2021

Endeavour Silver (EXK)(EDR:CA)
Updating Estimates Ahead of Upcoming Earnings Release

As of April 24, 2020, Noble Capital Markets research on Endeavour Silver is published under ticker symbols (EXK and EDR:CA). The price target is in USD and based on ticker symbol EXK. Research reports dated prior to April 24, 2020 may not follow these guidelines and could account for a variance in the price target.

Endeavour Silver Corp is a precious metal mining company. The company is primarily engaged in silver mining and owns three high-grade, underground, silver-gold mines in Mexico. Its other business activities include acquisition, exploration, development, extraction, processing, refining and reclamation. The company is organized into four operating mining segments, Guanacevi, Bolanitos, El Cubo, and El Compas, which are located in Mexico as well as Exploration and Corporate segments. Its Exploration segment consists of projects in the exploration and evaluation phases in Mexico and Chile.

Mark Reichman, Senior Research Analyst of Natural Resources, Noble Capital Markets, Inc.
Refer to the full report for the price target, fundamental analysis, and rating.

    Updating production forecast. Compared to the prior year period, third quarter silver and gold production increased 38.5% and 2.7%, respectively, to 1,305,399 ounces and 10,541 ounces. During the quarter, Endeavour sold 699,539 ounces of silver and 9,925 ounces of gold. Payable silver and gold ounces produced during the quarter amounted to 1,295,126 and 10,328 ounces, respectively. Sequentially, silver production increased 21.6%, while gold production decreased 5.6%. Endeavour raised 2021 silver and gold production guidance to a range of 4.5 to 4.8 million ounces and 40.1 to 42.1 thousand ounces, respectively, from 3.6 to 4.3 million ounces and 31 to 35.5 thousand ounces. We currently forecast production of 4.7 million ounces of silver and 41.5 thousand ounces of gold.

    Updating estimates.  We have lowered our 2021 EPS and EBITDA estimates to $0.01 and $42.9 million, respectively, from $0.03 and $45.4 million. Our revised estimates reflect, in part, lower sales as a percent of production and a lower margin. However, we expect stronger fourth quarter sales due to sales from inventory. We have lowered our 2022 EPS and EBITDA estimates to $0.15 and 67.0 million from …


This research is provided by Noble Capital Markets, Inc., a FINRA and S.E.C. registered broker-dealer (B/D).

*Analyst certification and important disclosures included in the full report. NOTE: investment decisions should not be based upon the content of this research summary.  Proper due diligence is required before making any investment decision. 

Release – Ocugen, Inc. Announces Submission of Investigational New Drug Application with U.S. FDA to Initiate a Phase 3 Clinical Trial Evaluating COVID-19 Vaccine Candidate COVAXIN BBV152


Ocugen, Inc. Announces Submission of Investigational New Drug Application with U.S. FDA to Initiate a Phase 3 Clinical Trial Evaluating COVID-19 Vaccine Candidate COVAXIN™ (BBV152)


The Phase 3 study is designed to bridge data collected from the vaccine efficacy trial conducted in India to the U.S. population

MALVERN, Pa., Oct. 27, 2021 (GLOBE NEWSWIRE) — Ocugen, Inc. (NASDAQ: OCGN), a biopharmaceutical company focused on discovering, developing, and commercializing novel therapeutics and vaccines, announced that it has submitted an Investigational New Drug application (IND) with the U.S. Food and Drug Administration (FDA) to evaluate the COVID-19 vaccine candidate, BBV152, known as COVAXIN™ outside the United States.  

COVAXIN™ is a whole-virion inactivated COVID-19 investigational vaccine candidate that uses the same vero cell manufacturing platform that has been used in the production of polio vaccines for decades.

The Phase 3 trial proposed in the IND is designed to establish whether the immune response experienced by participants in a completed Phase 3 efficacy trial in India is similar to that observed in a demographically representative, healthy adult population in the U.S. who either have not been vaccinated for COVID-19 or who already received two doses of an mRNA vaccine at least six months earlier.

“We are very excited to take this next step in the development of COVAXIN™, which we hope will bring us closer to introducing a different type of COVID-19 vaccine to the American public,” said Dr. Shankar Musunuri, Chairman of the Board, Chief Executive Officer, and Co-Founder of Ocugen. “We are hopeful that the study conducted under the IND, if allowed to proceed, will help demonstrate that the data from India will be applicable to the U.S. population.”

If the study is allowed to proceed, Ocugen’s Phase 3 immuno-bridging study, OCU-002, will seek to enroll several hundred healthy adults in the U.S. Subjects will be randomized to receive either two doses of COVAXIN™ or placebo, 28 days apart. The primary endpoint will compare blood-based samples taken from U.S. participants who received COVAXIN™ with samples of the participants in the Phase 3 efficacy trial conducted in India. The secondary endpoint involves testing the vaccine’s immunogenic profile. The study will also evaluate safety and tolerability in the U.S. population. Ocugen hopes to complete the study during H1 2022.

The Phase 3 study conducted in India by Ocugen’s business partner, Bharat Biotech, involved 25,798 participants receiving two doses of COVAXIN™ or placebo, 28 days apart. The primary endpoint was preventing symptomatic COVID-19 occurring at least 14 days after the second dose. Results of the trial found 93.4% efficacy against severe COVID-19 disease, 77.8% efficacy against symptomatic COVID-19 and 63.6% efficacy against asymptomatic disease. A sub-analysis of the Phase 3 study examined the presence of infections by variants of the original coronavirus strain. Overall, 90% of infections showed the presence of a variant, with 59% of those being the Delta variant. The sub-analysis revealed COVAXIN™-treated patients experienced 65.2% efficacy against the Delta variant. Adverse events reported in the trial included pain, erythema, induration, swelling, headache, pyrexia, fatigue, chills, myalgia, arthralgia, nausea and vomiting. 12.4% of subjects experienced an adverse event in both the COVAXIN™ and placebo arm. Additionally, 0.3% of subjects in the COVAXIN™ arm experienced a serious adverse event compared to 0.47% of patients in the placebo arm.

About COVAXIN™ (BBV152)
COVAXIN™ (BBV152) is an investigational vaccine candidate product in the U.S. It was developed by Bharat Biotech in collaboration with the Indian Council of Medical Research (ICMR) – National Institute of Virology (NIV). COVAXIN™ is a highly purified and inactivated vaccine that is manufactured using a vero cell manufacturing platform.

With more than 100 million doses having been manufactured, COVAXIN™ is currently being administered under emergency use authorizations in 17 countries, and applications for emergency use authorization are pending in more than 60 other countries. The trade name COVAXIN™ has not been evaluated by the FDA.   

About Ocugen, Inc. 
Ocugen, Inc. is a biopharmaceutical company focused on discovering, developing, and commercializing gene therapies to cure blindness diseases and developing a vaccine to save lives from COVID-19. Our breakthrough modifier gene therapy platform has the potential to treat multiple retinal diseases with one drug – “one to many” and our novel biologic product candidate aims to offer better therapy to patients with underserved diseases such as wet age-related macular degeneration, diabetic macular edema, and diabetic retinopathy. We are co-developing Bharat Biotech’s COVAXIN™ vaccine candidate for COVID-19 in the U.S. and Canadian markets. For more information, please visit www.ocugen.com.

About Bharat Biotech 
Bharat Biotech has established an excellent track record of innovation with more than 145 global patents, a wide product portfolio of more than 16 vaccines, 4 bio-therapeutics, registrations in more than 123 countries, and the World Health Organization (WHO) Pre-qualifications. Located in Genome Valley in Hyderabad, India, a hub for the global biotech industry, Bharat Biotech has built a world-class vaccine & bio-therapeutics, research & product development, Bio-Safety Level 3 manufacturing, and vaccine supply and distribution. 

Having delivered more than 4 billion doses of vaccines worldwide, Bharat Biotech continues to lead innovation and has developed vaccines for influenza H1N1, Rotavirus, Japanese Encephalitis, Rabies, Chikungunya, Zika, and the world’s first tetanus-toxoid conjugated vaccine for Typhoid. Bharat’s commitment to global social innovation programs and public-private partnerships resulted in introducing path-breaking WHO pre-qualified vaccines BIOPOLIO®, ROTAVAC®, and Typbar TCV® combatting polio, rotavirus, typhoid infections, respectively. The acquisition of the rabies vaccine facility, Chiron Behring, from GlaxoSmithKline (GSK) has positioned Bharat Biotech as the world’s largest rabies vaccine manufacturer. To learn more about Bharat Biotech, visit www.bharatbiotech.com

Cautionary Note on Forward-Looking Statements  
This press release contains forward-looking statements within the meaning of The Private Securities Litigation Reform Act of 1995, which are subject to risks and uncertainties. We may, in some cases, use terms such as “predicts,” “believes,” “potential,” “proposed,” “continue,” “estimates,” “anticipates,” “expects,” “plans,” “intends,” “may,” “could,” “might,” “will,” “should” or other words that convey uncertainty of future events or outcomes to identify these forward-looking statements. Such forward-looking statements include information about qualitative assessments of available data, potential benefits, expectations for clinical trials, and anticipated timing of clinical trial readouts and regulatory submissions, including with respect to our hope that the Phase 3 trial included in our Investigational New Drug application (IND) to the U.S. Food and Drug Administration (FDA) for COVAXIN™, if allowed to proceed, will be completed during the first half of 2022, or that the results of any such trial may demonstrate that existing data from Bharat Biotech’s clinical trials in India for COVAXIN™ will be applicable to the U.S. population. This information involves risks and uncertainties that could cause actual results to differ materially from those expressed or implied by such statements. Risks and uncertainties include, among other things, the uncertainties inherent in research and development, including the ability to meet anticipated clinical endpoints, commencement and/or completion dates for clinical trials, regulatory submission dates, regulatory approval dates and/or launch dates, as well as risks associated with preliminary and interim data, including the possibility of unfavorable new clinical trial data and further analyses of existing clinical trial data; the risk that the results of in-vitro studies will not be duplicated in human clinical trials; the risk that clinical trial data are subject to differing interpretations and assessments, including during the peer review/publication process, in the scientific community generally, and by regulatory authorities; whether and when data from Bharat Biotech’s clinical trials will be published in scientific journal publications and, if so, when and with what modifications; whether the FDA will accept our IND submission without any changes, or if we are required to submit additional information to the FDA in support of our IND submission, the extent and significance of any such changes; whether we will be able to provide the FDA with sufficient additional information regarding the design of and results from preclinical and clinical studies of COVAXIN™, which have been conducted by Bharat Biotech in India in order for those trials to support a biologics license application (BLA); the size, scope, timing and outcome of any additional trials or studies that we may be required to conduct to support a BLA, including our planned Phase 3 clinical trial for which we have submitted an IND to the FDA; any additional chemistry, manufacturing and controls information that we may be required to submit at the time of our BLA filing; whether developments with respect to the COVID-19 pandemic will affect the regulatory pathway available for vaccines in the United States, Canada or other jurisdictions; market demand for COVAXIN™ in the United States or Canada; decisions by the FDA or Health Canada impacting labeling, manufacturing processes, safety and/or other matters that could affect the availability or commercial potential of COVAXIN™ in the United States or Canada, including development of products or therapies by other companies. These and other risks and uncertainties are more fully described in our periodic filings with the Securities and Exchange Commission (SEC), including the risk factors described in the section entitled “Risk Factors” in the quarterly and annual reports that we file with the SEC. Any forward-looking statements that we make in this press release speak only as of the date of this press release. Except as required by law, we assume no obligation to update forward-looking statements contained in this press release whether as a result of new information, future events or otherwise, after the date of this press release. 

Ocugen Contact: 
Ken Inchausti
Head, Investor Relations & Communications
ken.inchausti@ocugen.com

Please submit investor-related inquiries to: IR@ocugen.com