Motorsport Games (MSGM) – 3Q21 Earnings Update

Friday, November 05, 2021

Motorsport Games (MSGM)
3Q21 Earnings Update

Motorsport Games, a Motorsport Network company, combines innovative and engaging video games with exciting esports competitions and content for racing fans and gamers around the globe. The Company is the officially licensed video game developer and publisher for iconic motorsport racing series including NASCAR, 24 Hours of Le Mans and the British Touring Car Championship (“BTCC”). Motorsport Games is an award-winning esports partner of choice for NASCAR, 24 Hours of Le Mans, Formula E, BTCC and the FIA World Rallycross Championship, among others. For more information about Motorsport Games visit: www.motorsportgames.com.

Michael Kupinski, Director of Research, Noble Capital Markets, Inc.

Refer to the full report for the price target, fundamental analysis, and rating.

    Mixed Results. The company’s Q3 2021 revenue of $2.1 million topped our estimate of $1.4 million by 52.7%. Adj. EBITDA, however, fell short of our estimates, coming in at a loss of $5.45 million, 9% lower than the $5 million loss we had forecasted. The adj. EBITDA miss is largely attributable to developmental costs in the quarter.

    Maintaining revenue estimates.  We believe the company is positioned to meet our 2021 full year revenue guidance on the back of its Q4 launch of NASCAR21: Ignition. Looking ahead, management reiterated the company’s goal to release a new INDYCAR game in 2023. As such, we are maintaining our 2022 and 2023 revenue estimates of $29.7 million and $41.1 million, respectively. The company is expected to …


This Company Sponsored Research is provided by Noble Capital Markets, Inc., a FINRA and S.E.C. registered broker-dealer (B/D).

*Analyst certification and important disclosures included in the full report. NOTE: investment decisions should not be based upon the content of this research summary.  Proper due diligence is required before making any investment decision. 

Salem Media (SALM) – Favorable Operating Momentum Raising Target Price

Friday, November 05, 2021

Salem Media (SALM)
Favorable Operating Momentum; Raising Target Price

Salem Media Group is America’s leading radio broadcaster, Internet content provider, and magazine and book publisher targeting audiences interested in Christian and family-themed content and conservative values. In addition to its radio properties, Salem owns Salem Radio Network, which syndicates talk, news and music programming to approximately 2700 affiliates; Salem Radio Representatives, a national radio advertising sales force; Salem Web Network, a leading Internet provider of Christian content and online streaming; and Salem Publishing, a leading publisher of Christian themed magazines. Salem owns and operates 115 radio stations, with 73 stations in the nation’s top 25 top markets – and 25 in the top 10. Each of our radio properties has a full portfolio of broadcast and digital marketing opportunities.

Michael Kupinski, Director of Research, Noble Capital Markets, Inc.

Refer to the full report for the price target, fundamental analysis, and rating.

    Q3 beats expectations. Salem Media reported $65.9 million in total revenues, up 8.8% over the prior year quarter and exceeding our $62.0 million estimate. The Broadcast segment was the main driver of the outperformance, with a remarkable 9.3% revenue increase YoY. Adjusted EBITDA was $10.8 million versus our $8.4 million forecast, improving 12.8% YoY. Importantly, Q3 revenues and Adj. EBITDA are above 2019 levels, which is among the very few in its peer group.

    Setting up for a strong end of the year.  Management guided Q4 revenues to be slightly up 0% to 2%, which is better than our estimate of a 0.4% decline. The revenue guide is notable given that it compares with a year earlier strong Q4 2020, driven by $3.5 million in Political revenue. Excluding Political from last year’s period, revenue growth would be a solid 5% to 7%. Additionally, operating …


This Company Sponsored Research is provided by Noble Capital Markets, Inc., a FINRA and S.E.C. registered broker-dealer (B/D).

*Analyst certification and important disclosures included in the full report. NOTE: investment decisions should not be based upon the content of this research summary.  Proper due diligence is required before making any investment decision. 

Gray Television (GTN) – Steps Away From A Banner 2022

Friday, November 05, 2021

Gray Television (GTN)
Steps Away From A Banner 2022

Gray Television, Inc. operates as a television broadcast company in the United States. As of April 6, 2010, it operated 36 television stations in 30 markets, including 17 affiliated with CBS Inc.; 10 affiliated with the National Broadcasting Company, Inc.; 8 affiliated with the American Broadcasting Company (ABC); and 1 affiliated with FOX Entertainment Group, Inc. (FOX). The company also operated 39 digital second channels comprising 1 affiliated with ABC, 4 affiliated with FOX, 7 affiliated with CW Network, LLC, 18 affiliated with Twentieth Television, Inc., 2 affiliated with Universal Sports Network, and 7 local news/weather channels. Gray Television, Inc. was founded in 1897 and is headquartered in Atlanta, Georgia.

Michael Kupinski, Director of Research, Noble Capital Markets, Inc.

Refer to the full report for the price target, fundamental analysis, and rating.

    In-line quarter. Total company revenue of $601 million was in line with our $600 million estimate. Political advertising of $9 million was a little stronger than expected and Local advertising, slightly weaker. Overall, it was a solid revenue performance against the backdrop of the year earlier Political influenced quarter. Adj. EBITDA was $186 million, better than our $178 million estimate.

    Q4 revenue guidance a little softer than expected.  Management indicated that Q4 total core revenue will increase by 8% to 10% to approximately $308 to $313 million, a little softer than our $326 million estimate. Retransmission consent revenue is expected to increase by 20% to 21% to approximately $261 to $263 million, a hair lighter than our $264 million estimate. The company guided total …


This research is provided by Noble Capital Markets, Inc., a FINRA and S.E.C. registered broker-dealer (B/D).

*Analyst certification and important disclosures included in the full report. NOTE: investment decisions should not be based upon the content of this research summary.  Proper due diligence is required before making any investment decision. 

The GEO Group Inc. (GEO) – Another Solid Quarter

Friday, November 05, 2021

The GEO Group, Inc. (GEO)
Another Solid Quarter

With over 94,000 beds owned, leased or managed across its business lines and serving over 260,000 people daily, GEO is a leading provider of mission critical real estate to its governmental partners. The Company is the first fully integrated equity REIT specializing in the design, financing, development, and operation of secure facilities, processing centers, and community reentry centers in the U.S., Australia, South Africa, and the U.K.

Joe Gomes, Senior Research Analyst, Noble Capital Markets, Inc.

Joshua Zoepfel, Research Associate, Noble Capital Markets, Inc.

Refer to the full report for the price target, fundamental analysis, and rating.

    3Q21 Results. The GEO Group reported better-than-expected top line and AFFO for the third quarter of 2021. Total revenue for the quarter was $557.3 million compared to guidance of $548-$553 million. We were at $553 million. GEO reported AFFO of $0.65/sh, compared to guidance of $0.62/sh -$0.64/sh. We were at $0.65/sh. Adjusted earnings were $0.36/sh versus $0.37/sh last year. We had forecast $0.36/sh.

    Non-Residential Services Strong Showing.  The Non-Residential Services segment, mostly the BI monitoring business, enjoyed a very solid quarter, with revenue up 19% y-o-y (compared to 8.4% YTD) and NOI up 31% in the quarter (compared to 19% YTD) …


This Company Sponsored Research is provided by Noble Capital Markets, Inc., a FINRA and S.E.C. registered broker-dealer (B/D).

*Analyst certification and important disclosures included in the full report. NOTE: investment decisions should not be based upon the content of this research summary.  Proper due diligence is required before making any investment decision. 

Information Services (III) – Another Strong Quarter 3Q21 Highlights

Friday, November 05, 2021

Information Services (III)
Another Strong Quarter: 3Q21 Highlights

ISG (Information Services Group) (Nasdaq: III) is a leading global technology research and advisory firm. A trusted business partner to more than 700 clients, including more than 70 of the top 100 enterprises in the world, ISG is committed to helping corporations, public sector organizations, and service and technology providers achieve operational excellence and faster growth. The firm specializes in digital transformation services, including automation, cloud and data analytics; sourcing advisory; managed governance and risk services; network carrier services; strategy and operations design; change management; market intelligence and technology research and analysis. Founded in 2006, and based in Stamford, Conn., ISG employs more than 1,300 digital-ready professionals operating in more than 20 countries—a global team known for its innovative thinking, market influence, deep industry and technology expertise, and world-class research and analytical capabilities based on the industry’s most comprehensive marketplace data. For more information, visit www.isg-one.com

Joe Gomes, Senior Research Analyst, Noble Capital Markets, Inc.

Joshua Zoepfel, Research Associate, Noble Capital Markets, Inc.

Refer to the full report for the price target, fundamental analysis, and rating.

    Strong 3Q21 Results. Record third quarter revenue of $71.1 million rose 15% y-o-y and exceeded our and consensus estimate of $67 million. ISG reported net income of $4.4 million, or $0.09 per share, up from $2.1 million, and $0.04, respectively, last year. Adjusted EPS was $0.12 and adjusted EBITDA totaled $10.2 million, up 24% y-o-y. We had forecast EPS of $0.06, adjusted EPS of $0.10, and adjusted EBITDA of $8.3 million. Consensus adjusted EPS was $0.09 and adjusted EBITDA was $8.4 million.

    Market Momentum Continuing.  The quarter’s results reflect ongoing momentum across ISG’s markets. Enterprises continue to accelerate their technology investments coming out of the pandemic, with a strong shift to cloud-based platforms and all things digital, ISG’s strengths …


This Company Sponsored Research is provided by Noble Capital Markets, Inc., a FINRA and S.E.C. registered broker-dealer (B/D).

*Analyst certification and important disclosures included in the full report. NOTE: investment decisions should not be based upon the content of this research summary.  Proper due diligence is required before making any investment decision. 

QuickChek – November 4, 2021


Helius Medical Technologies, Inc. Receives PoNS® Market Authorization in Australia

Helius Medical Technologies announced it received market authorization from the Australian Therapeutic Goods Administration (TGA) for the sale of PoNS as a Class IIa medical device

Research, News & Market Data on Helius Medical

Watch recent presentation from Helius Medical


Gray Reports Third Quarter Operating Results

Gray Television announced financial results for the third quarter ended September 30, 2021

Gray Television announced a quarterly cash dividend of $0.08 per share

Research, News & Market Data on Gray Television


Genco Shipping & Trading Limited Announces Third Quarter Financial Results

Genco Shipping & Trading announced its financial results for the three months and nine months ended September 30, 2021

See today’s research report from Poe Fratt, Senior Research Analyst at Noble Capital Markets

Research, News & Market Data on Genco


Kratos Reports Third Quarter Financial Results

Kratos Defense & Security Solutions reported its third quarter 2021 financial results

Research, News & Market Data on Kratos


Esports Entertainment Group Announces Launch of Public Offering of 1,500,000 Shares of Preferred Stock

Esports Entertainment Group announced it has commenced an underwritten registered public offering of its 10.0% Series A Cumulative Redeemable Convertible Preferred Stock

See today’s research report from Michael Kupinski, Director of Research at Noble Capital Markets

Research, News & Market Data on EEG

Watch recent presentation from EEG


Stay up to date. Follow us:


Esports Entertainment Group Announces Launch of Public Offering of 1,500,000 Shares of Preferred Stock


Esports Entertainment Group Announces Launch of Public Offering of 1,500,000 Shares of Preferred Stock


Hoboken, New Jersey–(Newsfile Corp. – November 3, 2021) – Esports Entertainment Group, Inc. (NASDAQ: GMBL) (NASDAQ: GMBLW) (or the “Company”) today announced it has commenced an underwritten registered public offering of its 10.0% Series A Cumulative Redeemable Convertible Preferred Stock, par value $0.001 per shares (the “Series A Preferred Stock”), at a price of $10.00 per share. Each share of Series A Preferred Stock will be convertible into shares of the Company’s common stock, at a conversion price of $17.50 per common share, at any time at the option of the holder. In connection with this offering, the Company expects to grant the underwriters a 45-day option to purchase an additional 225,000 shares of Series A Preferred Stock at the public offering price, less underwriting discounts and commissions.

Currently, no market exists for the Series A Preferred Stock. The Company has filed an application to list the Series A Preferred Stock on the NASDAQ Capital Market under the symbol “GMBLP.” If the application is approved, trading of the Series A Preferred Stock is expected to begin within three business days after the initial issuance of the Series A Preferred Stock.

Maxim Group LLC and Joseph Gunnar & Co., LLC are acting as book-running managers for the offering.

This offering is being made pursuant to an effective shelf registration statement on Form S-3 (No. 333-252370) that the Company previously filed with the Securities and Exchange Commission (the “SEC”), which became effective on February 5, 2021. The offering will be made only by means of the written prospectus supplement and the accompanying prospectus that form a part of the registration statement. The preliminary prospectus supplement and the accompanying prospectus relating to the offering will be filed with the SEC and, when filed, will be available on the SEC’s website located at http://www.sec.gov. Copies of the preliminary prospectus supplement and the accompanying prospectus, when available, may also be obtained by contacting Maxim Group LLC, 300 Park Avenue, 16th Floor, New York, NY 10022, or by telephone at (212) 895-3745.

This press release does not constitute an offer to sell or the solicitation of an offer to buy, nor will there be any sales of these securities in any jurisdiction in which such offer, solicitation or sale would be unlawful prior to registration or qualification under the securities laws of such jurisdiction.

About Esports Entertainment Group

Esports Entertainment Group is a full stack esports and online gambling company fueled by the growth of video-gaming and the ascendance of esports with new generations. Our mission is to help connect the world at large with the future of sports entertainment in unique and enriching ways that bring fans and gamers together. Esports Entertainment Group and its affiliates are well-poised to help fans and players to stay connected and involved with their favorite esports. From traditional sports partnerships with professional NFL/NHL/NBA/FIFA teams, community-focused tournaments in a wide range of esports, and boots-on-the-ground LAN cafes, EEG has influence over the full-spectrum of esports and gaming at all levels. The Company maintains offices in New Jersey, the UK and Malta. For more information visit www.esportsentertainmentgroup.com.

Forward-Looking Statements

The information contained herein includes forward-looking statements. These statements relate to future events or to our future financial performance, and involve known and unknown risks, uncertainties and other factors that may cause our actual results, levels of activity, performance, or achievements to be materially different from any future results, levels of activity, performance or achievements expressed or implied by these forward-looking statements. You should not place undue reliance on forward-looking statements since they involve known and unknown risks, uncertainties and other factors which are, in some cases, beyond our control and which could, and likely will, materially affect actual results, levels of activity, performance or achievements. Any forward-looking statement reflects our current views with respect to future events and is subject to these and other risks, uncertainties and assumptions relating to our operations, results of operations, growth strategy and liquidity. We assume no obligation to publicly update or revise these forward-looking statements for any reason, or to update the reasons actual results could differ materially from those anticipated in these forward-looking statements, even if new information becomes available in the future. The safe harbor for forward-looking statements contained in the Securities Litigation Reform Act of 1995 protects companies from liability for their forward-looking statements if they comply with the requirements of the Act.

Contact:

U.S. Investor Relations
RedChip Companies, Inc.
Dave Gentry
407-491-4498
dave@redchip.com

Media & Investor Relations Inquiries
Jeff@esportsentertainmentgroup.com

Gray Reports Third Quarter Operating Results


Gray Reports Third Quarter Operating Results


ATLANTA, Nov. 04, 2021 (GLOBE NEWSWIRE) — Gray Television, Inc. (“Gray,” “we,” “us” or “our”) (NYSE: GTN) today announced financial results for the third quarter ended September 30, 2021. We experienced strong momentum in the first nine months of 2021 and we believe it will continue throughout the remainder of the year. Key financial results were as follows:

  • Total revenue was $601 million in the third quarter of 2021, essentially unchanged from the third quarter of 2020. The primary components of revenue were: combined local and national broadcast advertising revenue of $292 million and retransmission consent revenue of $266 million, both of which significantly exceeded our expectations and guidance.

  • Net loss attributable to common stockholders for the third quarter of 2021 was $30 million, or $0.32 per fully diluted share. This resulted from non-cash losses of $53 million, in the third quarter, on the regulatory divestitures of television stations in overlap markets necessary to complete our recent and pending acquisitions. In addition, related to our recently completed and pending acquisitions, in the third quarter, we have incurred $11 million of incremental Transaction Related Expenses, as defined below.

  • Broadcast Cash Flow for the third quarter of 2021 was $204 million, decreasing $67 million, or 25%, from the third quarter of 2020. Our Adjusted EBITDA for the third quarter of 2021 was $186 million, a decrease of $75 million, or 29%, from the third quarter of 2020.

  • In the third quarter of 2021, our combined local and national broadcast revenue, excluding political advertising revenue (“Total Core Revenue”), was $292 million, increasing by $55 million, or 23% compared to the third quarter of 2020. Total Core Revenue increased as advertiser demand continued to recover. Gray’s Total Core Revenue in the third quarter of 2021 increased by $18 million, or 7% over the third quarter of 2019, the most recent non-political and pre-pandemic year.

  • As of September 30, 2021, our total leverage ratio, as defined in our senior credit facility, was 4.16 times on a trailing eight-quarter basis, netting our total cash balance of $322 million and giving effect to all Transaction Related Expenses. As of September 30, 2021, the amount available under our revolving credit facility was $299 million. We are not subject to any maintenance covenants in our credit facilities at this time.

  • On August 2, 2021, we acquired all outstanding shares of Quincy Media, Inc. (“Quincy”) for an adjusted purchase price of $930 million in cash (the “Quincy Transaction”). Simultaneously, we completed the divestiture to Allen Media Broadcasting (“Allen”) of certain television stations in the seven markets in which we currently operate, for an adjusted purchase price of $398 million in cash, (the “Allen Transaction”), in order to facilitate regulatory approvals for the Quincy Transaction.

  • In order to facilitate regulatory approvals for our pending acquisition of Meredith Corporation’s Local Media Group (the “Meredith Transaction”), on September 23, 2021, we divested our existing television station WJRT (ABC) in the Flint-Saginaw, Michigan market (DMA 64), to Allen for an adjusted purchase price of $72 million in cash.

  • In connection with, and contingent upon the completion of the Meredith Transaction, we have agreed to complete certain financing transactions. Related to our Senior Credit Facility, we (1) agreed to incur a $1.5 billion incremental term loan under our senior credit facility, subject to market conditions at the time of financing and (2) agreed to amend and restate our existing revolving credit facility to increase our borrowing capacity under the facility from up to $300 million to up to $500 million, which will consist of (i) a $425 million five year revolving credit facility and (ii) a $75 million revolving credit facility with commitments expiring January 2, 2026. In addition, Gray Escrow II, Inc., our special purpose wholly-owned subsidiary, has agreed to issue $1.3 billion in aggregate principal amount of 5.375% senior unsecured notes due 2031 at par, which we intend to assume upon completion of the Meredith Transaction. The proceeds of the transactions mentioned above, after deducting transaction fees and estimated expenses, will be used to pay a portion of the consideration for the Meredith Transaction. As a result of these financings and at the time of closing, our average cost of capital for the Meredith Transaction is currently estimated to be 4.15%.

                               
Selected Operating Data (unaudited), dollars in millions:                  
  Three Months Ended September 30,
          % Change       % Change
          2021 to       2021 to
  2021   2020   2020   2019   2019
Revenue (less agency commissions):                              
Broadcasting $ 581     $ 593   (2 )%   $ 501   16 %
Production companies   20       11   82 %     16   25 %
Total revenue $ 601     $ 604   0 %   $ 517   16 %
                               
Political advertising revenue $ 9     $ 128   (93 )%   $ 22   (59 )%
                               
Operating expenses (1):                              
Broadcasting $ 384     $ 326   18 %   $ 316   22 %
Production companies $ 13     $ 8   63 %   $ 13   0 %
Corporate and administrative $ 32     $ 15   113 %   $ 14   129 %
                               
Net (loss) income attributable to common stockholders $ (30 )   $ 109   (128 )%   $ 46   (165 )%
                               
Non-GAAP Cash Flow (2):                              
Broadcast Cash Flow $ 204     $ 271   (25 )%   $ 192   6 %
Broadcast Cash Flow Less Cash Corporate Expenses $ 175     $ 260   (33 )%   $ 180   (3 )%
Free Cash Flow (2) $ (5 )   $ 139   (104 )%   $ 92   (105 )%
                               
                   
  Nine Months Ended September 30,
          % Change       % Change
          2021 to       2021 to
  2021   2020   2020   2019   2019
Revenue (less agency commissions):                              
Broadcasting $ 1,648     $ 1,557   6 %   $ 1,481   11 %
Production companies   44       32   38 %     62   (29 )%
Total revenue $ 1,692     $ 1,589   6 %   $ 1,543   10 %
                               
Political advertising revenue $ 24     $ 185   (87 )%   $ 30   (20 )%
                               
Operating expenses (1):                              
Broadcasting $ 1,099     $ 985   12 %   $ 986   11 %
Production companies $ 39     $ 32   22 %   $ 57   (32 )%
Corporate and administrative $ 75     $ 47   60 %   $ 83   (10 )%
                               
Net income attributable to common stockholders $ 22     $ 147   (85 )%   $ 46   (52 )%
                               
Non-GAAP Cash Flow (2):                              
Broadcast Cash Flow $ 555     $ 575   (3 )%   $ 500   11 %
Broadcast Cash Flow Less Cash Corporate Expenses $ 489     $ 536   (9 )%   $ 424   15 %
Free Cash Flow (2) $ 107     $ 259   (59 )%   $ 165   (35 )%
                               

(1) Excludes depreciation, amortization and loss (gain) on disposal of assets.
(2) See definition of non-GAAP terms and a reconciliation of the non-GAAP amounts to net (loss) income included elsewhere herein.


Results of Operations for the Third Quarter of 2021, dollars in millions:

                         
    Three Months Ended September 30,
      2021       2020     Amount   Percent
        Percent       Percent   Increase   Increase
    Amount   of Total   Amount   of Total   (Decrease)   (Decrease)
Revenue (less agency commissions):                        
Local (including internet/digital/mobile) $ 232   39 %   $ 188   31 %   $ 44     23 %
National     60   10 %     49   8 %     11     22 %
Political     9   2 %     128   21 %     (119 )   (93 )%
Retransmission consent     266   44 %     217   36 %     49     23 %
Production companies     20   3 %     11   2 %     9     82 %
Other     14   2 %     11   2 %     3     27 %
Total   $ 601   100 %   $ 604   100 %   $ (3 )   0 %
                         
Combined local and national revenue                        
(“Total Core Revenue”)   $ 292   49 %   $ 237   39 %   $ 55     23 %


Operating expenses (before                      
depreciation, amortization and                      
loss (gain) on disposal of assets):                      
Broadcasting:                      
Station expenses $ 229   60 %   $ 200   62 %   $ 29     15 %
Retransmission expense   154   40 %     125   38 %     29     23 %
Transaction Related Expenses     0 %       0 %          
Non-cash stock-based compensation   1   0 %     1   0 %         0 %
Total broadcasting expense $ 384   100 %   $ 326   100 %   $ 58     18 %
                       
Production companies expense $ 13       $ 8       $ 5     63 %
                       
Corporate and administrative:                      
Corporate expenses $ 19   60 %   $ 10   66 %   $ 9     90 %
Transaction Related Expenses   11   34 %     1   7 %     10     1000 %
Non-cash stock-based compensation   2   6 %     4   27 %     (2 )   (50 )%
Total corporate and                      
  administrative expense $ 32   100 %   $ 15   100 %   $ 17     113 %
                       

Results of Operations for the Nine-Months Ended September 30, 2021, dollars in millions:

                       
  Nine Months Ended September 30,
  2021   2020   Amount   Percent
      Percent       Percent   Increase   Increase
  Amount   of Total   Amount   of Total   (Decrease)   (Decrease)
Revenue (less agency commissions):                      
Local (including internet/digital/mobile) $ 657   39 %   $ 549   34 %   $ 108     20 %
National   174   10 %     136   9 %     38     28 %
Political   24   1 %     185   12 %     (161 )   (87 )%
Retransmission consent   755   45 %     650   41 %     105     16 %
Production companies   44   3 %     32   2 %     12     38 %
Other   38   2 %     37   2 %     1     3 %
Total $ 1,692   100 %   $ 1,589   100 %   $ 103     6 %
                       
Combined local and national revenue                      
(“Total Core Revenue”) $ 831   49 %   $ 685   43 %   $ 146     21 %


Operating expenses (before                      
depreciation, amortization and                      
(gain) loss on disposal of assets):                      
Broadcasting:                      
Station expenses $ 654   60 %   $ 610   62 %   $ 44     7 %
Retransmission expense   444   40 %     371   38 %     73     20 %
Transaction Related Expenses     0 %       0 %          
Non-cash stock-based compensation   1   0 %     4   0 %     (3 )   (75 )%
Total broadcasting expense $ 1,099   100 %   $ 985   100 %   $ 114     12 %
                       
Production companies expense $ 39       $ 32       $ 7     22 %
                       
Corporate and administrative:                      
Corporate expenses $ 47   63 %   $ 38   81 %   $ 9     24 %
Transaction Related Expenses   19   25 %     1   2 %     18     1800 %
Non-cash stock-based compensation   9   12 %     8   17 %     1     13 %
Total corporate and                      
  administrative expense $ 75   100 %   $ 47   100 %   $ 28     60 %
                       

Transaction Related Expenses:

From time to time, we have incurred incremental expenses (“Transaction Related Expenses”) that were specific to acquisitions, divestitures and financing activities, including but not limited to legal and professional fees, severance and incentive compensation and contract termination fees. In addition, we have recorded certain non-cash stock-based compensation expenses. These expenses are summarized as follows, in millions:

               
  Three Months Ended   Nine Months Ended
  September 30,   September 30,
    2021       2020       2021       2020  
Transaction Related Expenses:              
Broadcasting $     $     $     $  
Corporate and administrative   11       1       19       1  
Miscellaneous expense               7        
Total Transaction Related Expenses $ 11     $ 1     $ 26     $ 1  
               
Total non-cash stock-based compensation $ 3     $ 5     $ 10     $ 12  
               

Taxes:

During the 2021 and 2020 nine-month periods, we made aggregate federal and state income tax payments of approximately $129 million and $50 million, respectively. In the third quarter of 2021 we made income tax payments of approximately $72 million related to the Quincy Divestiture. During the remainder of 2021, we anticipate making income tax payments (net of refunds) of approximately $18 million that will include approximately $17 million related to the Flint Divestiture. We have approximately $204 million of federal operating loss carryforwards, which expire during the years 2023 through 2037. We expect to have federal taxable income in the carryforward periods. We therefore believe that these federal operating loss carryforwards will be fully utilized. Additionally, we have an aggregate of approximately $567 million of various state operating loss carryforwards, of which we expect that approximately half will be utilized.

Detailed table of operating results:

               
Gray Television, Inc.
Selected Operating Data (Unaudited)
(in millions, except for net income per share data)
           
  Three Months Ended   Nine Months Ended
  September 30,   September 30,
               
    2021       2020       2021       2020  
               
Revenue (less agency commissions):              
Broadcasting $ 581     $ 593     $ 1,648     $ 1,557  
Production companies   20       11       44       32  
Total revenue (less agency commissions)   601       604       1,692       1,589  
Operating expenses before depreciation, amortization              
and loss (gain) on disposal of assets, net:              
Broadcasting   384       326       1,099       985  
Production companies   13       8       39       32  
Corporate and administrative   32       15       75       47  
Depreciation   26       27       76       69  
Amortization of intangible assets   28       26       81       78  
Loss (gain) on disposals of assets, net   51       (10 )     46       (23 )
Operating expenses   534       392       1,416       1,188  
Operating income   67       212       276       401  
Other (expense) income:              
Miscellaneous (expense), net   (1 )     (2 )     (7 )     (5 )
Interest expense   (48 )     (45 )     (143 )     (143 )
Income before income taxes   18       165       126       253  
Income tax expense   35       43       65       67  
Net (loss) income   (17 )     122       61       186  
Preferred stock dividends   13       13       39       39  
Net (loss) income attributable to common stockholders $ (30 )   $ 109     $ 22     $ 147  
               
Basic per share information:              
Net (loss) income attributable to common stockholders $ (0.32 )   $ 1.15     $ 0.23     $ 1.52  
Weighted-average shares outstanding   95       95       94       97  
               
Diluted per share information:              
Net (loss) income attributable to common stockholders $ (0.32 )   $ 1.14     $ 0.23     $ 1.52  
Weighted-average shares outstanding   95       96       95       97  
               

Guidance for the Three-Months Ending December 31, 2021:

Based on our current forecasts for the fourth quarter of 2021, we anticipate changes from the fourth quarter of 2020, excluding the pending Meredith Transaction, as outlined below:

  • Revenue, less agency commissions:
    • Local revenue will increase by 8% to 9% to approximately $240 to $243 million.
    • National revenue will increase by 10% to 13% to approximately $68 to $70 million.
      • Total Core Revenue will increase by 8% to 10% to approximately $308 to $313 million.
    • Political revenue will decrease by 95% to 96% to approximately $10 to $12 million.
    • Retransmission consent revenue will increase by 20% to 21% to approximately $261 to $263 million.
    • Total broadcasting revenue will decrease by 21% to 22% to approximately $593 to $603 million.
    • Production company revenue is expected to be approximately $27 to $28 million.
       
  • Operating expenses (before depreciation, amortization and (gain) loss on disposal of assets, net):
    • Broadcasting expenses will increase by 11% to 13%, to approximately $395 to $400 million. This increase primarily reflects an increase in retransmission expense by approximately $22 million. This increase also includes Transaction Related Expenses within a range of $2 to $3 million.
    • Production company expenses are expected to be approximately $20 to $21 million.
    • Corporate and administrative expenses will be approximately $25 to $30 million. This increase primarily reflects an increase in Transaction Related Expenses within a range of $3 to $4 million.

Other Financial Data, in millions:

  Nine Months Ended September 30,
    2021       2020  
   
Net cash provided by operating activities $ 283     $ 488  
Net cash used in investing activities   (664 )     (129 )
Net cash used in financing activities   (70 )     (104 )
Net (decrease) increase in cash $ (451 )   $ 255  
       
  As of
  September 30, 2021   December 31, 2020
   
Cash $ 322     $ 773  
Long-term debt, including current portion $ 3,981     $ 3,974  
Borrowing availability under Revolving Credit Facility $ 299     $ 200  
Series A Perpetual Preferred Stock $ 650     $ 650  
       

The Company

Gray Television, headquartered in Atlanta, Georgia, is the largest owner of top-rated local television stations and digital assets in the United States. Upon its anticipated completion of the Meredith Transaction, Gray will become the nation’s second largest television broadcaster, with television stations serving 113 markets that reach approximately 36 percent of US television households. The pro forma portfolio includes 79 markets with the top-rated television station and 101 markets with the first and/or second highest rated television station according to Comscore’s audience measurement data. Gray also owns video program production, marketing, and digital businesses including Raycom Sports, Tupelo Honey, and RTM Studios, the producer of PowerNation programs and content and is the majority owner of Swirl Films.

Cautionary Statements for Purposes of the “Safe Harbor” Provisions of the Private Securities Litigation Reform Act

This press release contains statements that constitute “forward-looking statements” within the meaning of the Private Securities Litigation Reform Act of 1995 and the federal securities laws. These “forward-looking statements” are not statements of historical facts, and may include, among other things, statements regarding our estimates, expectations, intentions, projections, and beliefs of operating results for future periods, macroeconomic trends, the impact of COVID-19 on our future operating results, future income tax payments, pending transactions and other future events. Actual results are subject to a number of risks and uncertainties and may differ materially from the current expectations and beliefs discussed in this press release. All information set forth in this release is as of the date hereof. We do not intend, and undertake no duty, to update this information to reflect future events or circumstances. As such, caution should be taken to not place undue reliance on forward-looking statements. Information about certain potential factors that could affect our business and financial results and cause actual results to differ materially from those expressed or implied in any forward-looking statements are included under the captions “Risk Factors” and “Management’s Discussion and Analysis of Financial Condition and Results of Operations,” in our Annual Report on Form 10-K for the year ended December 31, 2020, and may be contained in reports subsequently filed with the U.S. Securities and Exchange Commission and available at www.sec.gov.

Conference Call Information:

We will host a conference call to discuss our third quarter operating results on November 4, 2021. The call will begin at 11:00 AM Eastern Time. The live dial-in number is 1 (855) 493-3489 and the confirmation code is 8366927. The call will be webcast live and available for replay at www.gray.tv. The taped replay of the conference call will be available at 1 (855) 859-2056, Confirmation Code: 8366927 until December 4, 2021.

Gray Contacts:

Web site: www.gray.tv

Hilton H. Howell, Jr., Executive Chairman and Chief Executive Officer, 404-266-5513

Pat LaPlatney, President and Co-Chief Executive Officer, (334) 206-1400

Jim Ryan, Executive Vice President and Chief Financial Officer, 404-504-9828

Kevin P. Latek, Executive Vice President, Chief Legal and Development Officer, 404-266-8333

Effects of Acquisitions and Divestitures on Our Results of Operations and Non-GAAP Terms

From time to time, we supplement our financial results prepared in accordance with GAAP by disclosing the non-GAAP financial measures Broadcast Cash Flow, Broadcast Cash Flow Less Cash Corporate Expenses, Operating Cash Flow as defined in the Senior Credit Agreement, Free Cash Flow, Adjusted EBITDA and Total Leverage Ratio, Net of All Cash. These non-GAAP amounts are used by us to approximate amounts used to calculate key financial performance covenants contained in our debt agreements and are used with our GAAP data to evaluate our results and liquidity.

We define Broadcast Cash Flow as net income or loss plus loss on early extinguishment of debt, non-cash corporate and administrative expenses, non-cash stock-based compensation, depreciation and amortization (including amortization of intangible assets and program broadcast rights), any loss on disposal of assets, any miscellaneous expense, interest expense, any income tax expense, non-cash 401(k) expense, Broadcast Transactions Related Expenses and broadcast other adjustments less any gain on disposal of assets, any miscellaneous income, any income tax benefits and payments for program broadcast rights.

We define Broadcast Cash Flow Less Cash Corporate Expenses as net income or loss plus loss on early extinguishment of debt, non-cash stock-based compensation, depreciation and amortization (including amortization of intangible assets and program broadcast rights), any loss on disposal of assets, any miscellaneous expense, interest expense, any income tax expense, non-cash 401(k) expense, Transaction Related Expenses and other adjustments less any gain on disposal of assets, any miscellaneous income, any income tax benefits and payments for program broadcast rights.

We define Operating Cash Flow as defined in our Senior Credit Agreement as net income or loss plus loss on early extinguishment of debt, non-cash stock-based compensation, depreciation and amortization (including amortization of intangible assets and program broadcast rights), any loss on disposal of assets, any miscellaneous expense, interest expense, any income tax expense, non-cash 401(k) expense, Transaction Related Expenses, other adjustments, certain pension expenses, synergies and other adjustments less any gain on disposal of assets, any miscellaneous income, any income tax benefits, payments for program broadcast rights, pension income and contributions to pension plans.

Operating Cash Flow as defined in our Senior Credit Agreement gives effect to the revenue and broadcast expenses of all completed acquisitions and divestitures as if they had been acquired or divested, respectively, on September 30, 2019. It also gives effect to certain operating synergies expected from the acquisitions and related financings and adds back professional fees incurred in completing the acquisitions. Certain of the financial information related to the acquisitions has been derived from, and adjusted based on, unaudited, un-reviewed financial information prepared by other entities, which Gray cannot independently verify. We cannot assure you that such financial information would not be materially different if such information were audited or reviewed and no assurances can be provided as to the accuracy of such information, or that our actual results would not differ materially from this financial information if the acquisitions had been completed on the stated date. In addition, the presentation of Operating Cash Flow as defined in the Senior Credit Agreement and the adjustments to such information, including expected synergies resulting from such transactions, may not comply with GAAP or the requirements for pro forma financial information under Regulation S-X under the Securities Act of 1933.

We define Free Cash Flow as net income or loss plus loss on early extinguishment of debt, non-cash stock-based compensation, depreciation and amortization (including amortization of intangible assets and program broadcast rights), any loss on disposal of assets, any miscellaneous expense, any income tax expense, non-cash 401(k) expense, Transactions Related Expenses, broadcast other adjustments, certain pension expenses, synergies, other adjustments and amortization of deferred financing costs less any gain on disposal of assets, any miscellaneous income, any income tax benefits, payments for program broadcast rights, pension income, contributions to pension plans, preferred dividends, purchase of property and equipment (net of reimbursements) and income taxes paid (net of any refunds received).

We define Adjusted EBITDA as net income or loss, plus loss on early extinguishment of debt, non-cash stock-based compensation, depreciation and amortization of intangible assets, any loss on disposal of assets, any miscellaneous expense, interest expense, any income tax expense, non-cash 401(k) expense, Transaction Related Expenses less any gain on disposal of assets, any miscellaneous income and any income tax benefits.

Our Total Leverage Ratio, Net of All Cash is determined by dividing our Adjusted Total Indebtedness, Net of All Cash, by our Operating Cash Flow as defined in our Senior Credit Agreement, divided by two. Our Adjusted Total Indebtedness, Net of All Cash, represents the total outstanding principal of our long-term debt, plus certain other obligations as defined in our Senior Credit Agreement, less all cash (excluding restricted cash). Our Operating Cash Flow, as defined in our Senior Credit Agreement, divided by two, represents our average annual Operating Cash Flow as defined in our Senior Credit Agreement for the preceding eight quarters.

We define Transaction Related Expenses as incremental expenses incurred specific to acquisitions and divestitures, including, but not limited to legal and professional fees, severance and incentive compensation, and contract termination fees. We present certain line-items from our selected operating data, net of Transaction Related Expenses, in order to present a more meaningful comparison between periods of our operating expenses and our results of operations.

These non-GAAP terms are not defined in GAAP and our definitions may differ from, and therefore may not be comparable to, similarly titled measures used by other companies, thereby limiting their usefulness. Such terms are used by management in addition to, and in conjunction with, results presented in accordance with GAAP and should be considered as supplements to, and not as substitutes for, net income and cash flows reported in accordance with GAAP.

Reconciliation of Non-GAAP Terms, in millions:

           
  Three Months Ended
  September 30,
    2021       2020       2019  
           
Net (loss) income $ (17 )   $ 122     $ 59  
Adjustments to reconcile from net (loss) income to          
Free Cash Flow:          
Depreciation   26       27       20  
Amortization of intangible assets   28       26       29  
Non-cash stock-based compensation   3       5       5  
Loss (gain) on disposal of assets, net   51       (10 )     (14 )
Miscellaneous expense, net   1       2        
Interest expense   48       45       57  
Income tax expense   35       43       23  
Amortization of program broadcast rights   9       9       10  
Payments for program broadcast rights   (9 )     (9 )     (9 )
Corporate and administrative expenses before          
depreciation, amortization of intangible assets and          
non-cash stock-based compensation   29       11       12  
Broadcast Cash Flow   204       271       192  
Corporate and administrative expenses before          
depreciation, amortization of intangible assets and          
non-cash stock-based compensation   (29 )     (11 )     (12 )
Broadcast Cash Flow Less Cash Corporate Expenses   175       260       180  
Contributions to pension plans   (4 )     (3 )     (3 )
Interest expense   (48 )     (45 )     (57 )
Amortization of deferred financing costs   3       3       3  
Preferred stock dividends   (13 )     (13 )     (13 )
Common stock dividends   (8 )            
Purchase of property and equipment (1)   (22 )     (19 )     (29 )
Reimbursements of property and equipment purchases   3       5       15  
Income taxes paid, net of refunds (2)   (91 )     (49 )     (4 )
Free Cash Flow $ (5 )   $ 139     $ 92  

(1) Excludes approximately $11 million related to the purchase of land in Doraville, Georgia.
(2) Includes approximately $72 million of income tax payments related to the Quincy Divestiture.


Reconciliation of Non-GAAP Terms, in millions:

           
  Nine Months Ended
  September 30,
    2021       2020       2019  
           
Net income $ 61     $ 186     $ 85  
Adjustments to reconcile from net income to          
Free Cash Flow:          
Depreciation   76       69       60  
Amortization of intangible assets   81       78       86  
Non-cash stock-based compensation   10       12       10  
Non-cash 401(k) expense   1              
Loss (gain) on disposal of assets, net   46       (23 )     (27 )
Miscellaneous expense (income), net   7       5       (4 )
Interest expense   143       143       173  
Income tax expense   65       67       44  
Amortization of program broadcast rights   26       28       30  
Payments for program broadcast rights   (27 )     (29 )     (33 )
Corporate and administrative expenses before          
depreciation, amortization of intangible assets and          
non-cash stock-based compensation   66       39       76  
Broadcast Cash Flow   555       575       500  
Corporate and administrative expenses before          
depreciation, amortization of intangible assets and          
non-cash stock-based compensation   (66 )     (39 )     (76 )
Broadcast Cash Flow Less Cash Corporate Expenses   489       536       424  
Contributions to pension plans   (4 )     (3 )     (3 )
Interest expense   (143 )     (143 )     (173 )
Amortization of deferred financing costs   9       9       9  
Preferred stock dividends   (39 )     (39 )     (39 )
Common stock dividends   (23 )            
Purchase of property and equipment (1)   (63 )     (70 )     (73 )
Reimbursements of property and equipment purchases   10       19       32  
Income taxes paid, net of refunds (2)   (129 )     (50 )     (12 )
Free Cash Flow $ 107     $ 259     $ 165  
           

(1) Excludes approximately $91 million related to the purchase of land in Doraville, Georgia.
(2) Includes approximately $72 million of income tax payments related to the Quincy Divestiture.

Reconciliation of Net (Loss) Income to Adjusted EBITDA and the Effect of Transaction Related Expenses and Certain Non-cash Expenses, in millions, except for per share information:

               
  Three Months Ended   Nine Months Ended
  September 30,   September 30,
    2021       2020       2021       2020  
               
Net (loss) income $ (17 )   $ 122     $ 61     $ 186  
Adjustments to reconcile from net income to              
Adjusted EBITDA:              
Depreciation   26       27       76       69  
Amortization of intangible assets   28       26       81       78  
Non-cash stock-based compensation   3       5       10       12  
Loss (gain) on disposal of assets, net   51       (10 )     46       (23 )
Miscellaneous expense, net   1       2       7       5  
Interest expense   48       45       143       143  
Income tax expense   35       43       65       67  
Total   175       260       489       537  
Add: Transaction Related Expenses (1)   11       1       19       1  
Adjusted EBITDA $ 186     $ 261     $ 508     $ 538  
               
Net (loss) income attributable to common stockholders $ (30 )   $ 109     $ 22     $ 147  
Add: Transaction Related Expenses and non-cash              
stock-based compensation   14       6       29       13  
Less: Income tax expense related to Transaction Related              
Expenses and non-cash stock-based compensation   (4 )     (2 )     (7 )     (3 )
Net (loss) income attributable to common stockholders – excluding              
Transaction Related Expenses and non-cash stock-based              
compensation $ (20 )   $ 113     $ 44     $ 157  
               
Net (loss) income attributable to common stockholders per common share,            
diluted – excluding Transaction Related Expenses and non-cash              
stock-based compensation $ (0.21 )   $ 1.18     $ 0.46     $ 1.62  
               
Diluted weighted-average shares outstanding   95       96       95       97  

(1) Excludes $7 million of Transaction Related Expenses included in miscellaneous (expense) income, net for the nine-month period ended September 30, 2021.


Reconciliation of Total Leverage Ratio, Net of All Cash, dollars in millions: 

    Eight Quarters Ended
    September 30, 2021
     
Net income   $ 566  
Adjustments to reconcile from net income to operating cash flow as    
defined in our Senior Credit Agreement:    
Depreciation     192  
Amortization of intangible assets     215  
Non-cash stock-based compensation     32  
Gain disposals of assets, net     (9 )
Interest expense     387  
Loss from early extinguishment of debt     12  
Income tax expense     230  
Amortization of program broadcast rights     78  
Common stock contributed to 401(k) plan     12  
Payments for program broadcast rights     (79 )
Pension gain     (3 )
Contributions to pension plans     (7 )
Adjustments for unrestricted subsidiaries     1  
Adjustments for stations acquired or divested, financings and expected    
synergies during the eight quarter period     120  
Transaction Related Expenses     36  
Operating Cash Flow as defined in our Senior Credit Agreement   $ 1,783  
Operating Cash Flow as defined in our Senior Credit Agreement,    
 divided by two   $ 892  
     
    September 30, 2021
Adjusted Total Indebtedness:    
Total outstanding principal, including current portion   $ 4,035  
Cash     (322 )
Adjusted Total Indebtedness, Net of All Cash   $ 3,713  
     
Total Leverage Ratio, Net of All Cash     4.16  
     

Helius Medical Technologies, Inc. Receives PoNS® Market Authorization in Australia


Helius Medical Technologies, Inc. Receives PoNS® Market Authorization in Australia


NEWTOWN, Pa., Nov. 04, 2021 (GLOBE NEWSWIRE) — Helius Medical Technologies, Inc. (Nasdaq:HSDT) (Helius or the Company), a neurotech company focused on neurological wellness, today announced it received market authorization from the Australian Therapeutic Goods Administration (TGA) for the sale of PoNS as a Class IIa medical device. The Company’s representative in Australia is working with the TGA to finalize the exact scope of the authorization, which is expected to cover the use of PoNS to improve balance and gait when used as an adjunct to a therapeutic exercise program.

“We are thrilled that we will be able to introduce this groundbreaking therapy for patients in Australia needing to improve their balance and gait,” said Dane C. Andreeff, President and Chief Executive Officer of Helius. “This marks the third country in which PoNS is authorized and further validates the effectiveness of our innovative PoNS therapy. We will begin evaluating the pathway toward commercialization in Australia once the scope of the authorization is finalized.”

About Helius Medical Technologies, Inc.

Helius Medical Technologies is a leading neurotech company in the medical device field focused on neurologic deficits using non-implantable platform technologies that amplify the brain’s ability to compensate and promotes neuroplasticity, aiming to improve the lives of people needing to improve their balance and gait. The Company’s first commercial product is the Portable Neuromodulation Stimulator (PoNS®). For more information, visit www.heliusmedical.com.

About the PoNS Device and PoNS Therapy

The Portable Neuromodulation Stimulator (PoNS) is an innovative non-surgical device, inclusive of a controller and mouthpiece, which delivers electrical stimulation to the surface of the tongue to improve balance and gait. The PoNS device is indicated for use in the United States as a short-term treatment of gait deficit due to mild-to-moderate symptoms from multiple sclerosis (“MS”) and is to be used as an adjunct to a supervised therapeutic exercise program in patients 22 years of age and over by prescription only. It is authorized for sale in Canada for two indications: (i) PoNS is authorized for use as a short term treatment (14 weeks) of chronic balance deficit due to mild-to-moderate traumatic brain injury (“mmTBI”) and is to be used in conjunction with physical therapy; and (ii) PoNS is authorized for use as a short term treatment (14 weeks) of gait deficit due to mild and moderate symptoms from MS and is to be used in conjunction with physical therapy.

Cautionary Disclaimer Statement

Certain statements in this news release are not based on historical facts and constitute forward-looking statements or forward-looking information within the meaning of the U.S. Private Securities Litigation Reform Act of 1995 and Canadian securities laws. All statements other than statements of historical fact included in this news release are forward-looking statements that involve risks and uncertainties. Forward-looking statements are often identified by terms such as “believe,” “continue,” “expect,” “will,” “goal,” “aim to” and similar expressions. Such forward-looking statements include, among others, statements regarding finalizing the exact scope of approval in Australia and the Company’s plans to begin evaluating the pathway toward commercialization in Australia.

There can be no assurance that such statements will prove to be accurate and actual results and future events could differ materially from those expressed or implied by such statements. Important factors that could cause actual results to differ materially from the Company’s expectations include uncertainties associated with the regulatory submission review and approval process, the clinical development process, the Company’s capital requirements to achieve its business objectives, availability of funds, the impact of the COVID-19 pandemic, manufacturing, labor shortage and supply chain risks, the Company’s ability to train physical therapists in the supervision of the use of the PoNS Treatment, the Company’s ability to secure contracts with rehabilitation clinics, the Company’s ability to build internal commercial infrastructure, build a commercial team and build relationships with Key Opinion Leaders, neurology experts and neurorehabilitation centers, market awareness of the PoNS device, future clinical trials, the product development process, other development activities, ongoing government regulation, and other risks detailed from time to time in the “Risk Factors” section of the Company’s filings with the United States Securities and Exchange Commission and the Canadian securities regulators, which can be obtained from either at www.sec.gov or www.sedar.com.

The reader is cautioned not to place undue reliance on any forward-looking statement. The forward-looking statements contained in this news release are made as of the date of this news release and the Company assumes no obligation to update any forward-looking statement or to update the reasons why actual results could differ from such statements except to the extent required by law.

Investor Relations Contact

Lisa M. Wilson, In-Site Communications, Inc.
T: 212-452-2793
E: lwilson@insitecony.com

Is Ethereum More Useful Than Bitcoin?


Image Credit: Quote Inspector (Flickr)

Bitcoin and Ethereum are Usually Grouped Together, Should They Be?


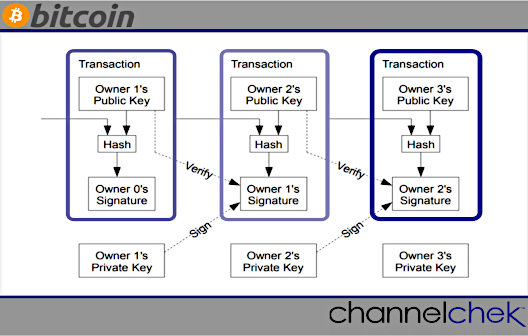
The two largest cryptocurrencies based on valuation are Bitcoin (BTC) and Ethereum (ETH). Both are powered by blockchain and the complex technology of distributed ledgers and cryptography. But they differ quite a bit in their purpose and trade differently. While speculators may not concern themselves with the differences, understanding each of their functions and limits allows better decision-making for those that are involved.

Differences

The
whitepaper that launched Bitcoin 13 years ago this week has an unknown author, as the creator(s) of Bitcoin remains a mystery. The founder of Ethereum, Vitalik Buterin, was only16 when he started a publication called Bitcoin Magazine; at 21-years-old (2015), he launched Ethereum.

Bitcoin was created as an alternative to currency to be accepted as a medium of exchange and store of value. Unlike Bitcoin, the goal of Ethereum is not just to serve as an alternative monetary system, although Ether does, but rather to facilitate and monetize the operation of the Ethereum smart contract and decentralized application (dapp) platform.  Decentralized applications are open source and, to date, provide a foundation for products and services such as finance, art, games, tokens, and media applications.

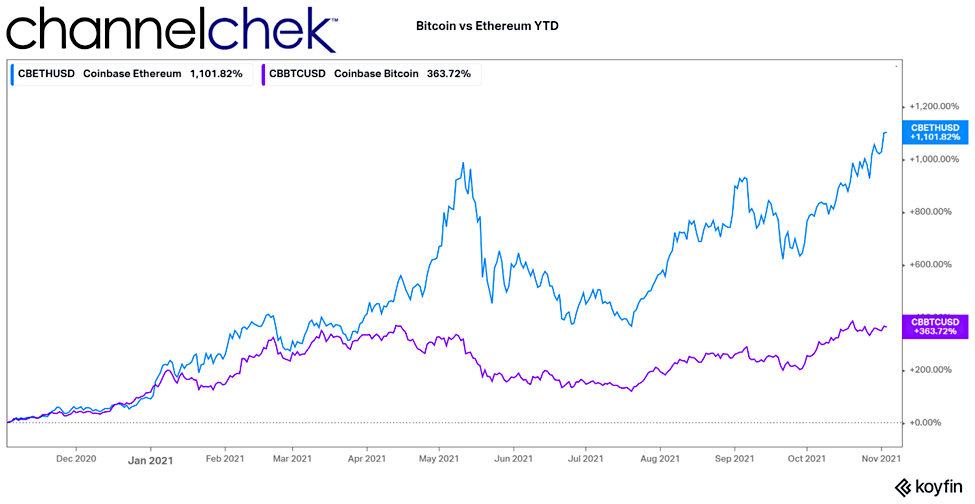
For most of its six-plus-year history, Ether (ETH) has been close behind Bitcoin (BTC) on rankings of the top cryptocurrencies by outstanding value. That being said, it is worth noting that the total valuation of Bitcoin is double that of Ether ($1.16T vs. $507B) as of November 4, 2021. The performance of Ether, on the other hand, has been stronger over the years. Year-to-date, as seen on the graph below, ETH is up over 1100%, while Bitcoin’s increase is a respectable 363%.


Aside from their covert and overt beginnings, there are other key differences.  For example, transactions on the Ethereum platform may contain executable code, while data affixed to Bitcoin transactions are only for note keeping. Another difference is confirmation of a transaction; Ethereum transactions are confirmed in seconds, while Bitcoin still takes a minute or more.  


Take Away

Ethereum or Ether is traded as a digital asset on exchanges in the same fashion as Bitcoin and other cryptocurrencies. It also has functionality beyond storing value and use as a medium of exchange. The Ethereum network, unlike Bitcoin, is also used to run applications. The better-understood Bitcoin is also a speculative digital asset that can store value and be used in transactions where accepted. This is its stated purpose; it is not used to create other products or services.

Paul Hoffman

Managing Editor, Channelchek


Suggested Reading:


Has Bitcoin Lived up to the Original Vision?


What the Approved Bitcoin ETFs Do for the Markets


Imagine a Bitcoin ETF with no Underlying Bitcoin


SEC Investigates Digital Engagement Practices in Broker Apps


Sources:

 https://coinmarketcap.com/

https://investorplace.com/2021/04/ethereum-will-continue-to-outperform-bitcoin-partly-due-to-its-smart-contract-ability/

https://www.investopedia.com/articles/investing/031416/bitcoin-vs-ethereum-driven-different-purposes.asp

https://www.investopedia.com/terms/c/cryptocurrency.asp


Stay up to date. Follow us:


Attacking Tumors by Returning Cancer Cells to the Body


Immunotherapy to Treat Cancer May Involve Placing Cancer Cells in the Body


Anne
Trafton
 | MIT News Office

Immunotherapy is a promising strategy to treat cancer by stimulating the body’s own immune system to destroy tumor cells, but it only works for a handful of cancers. MIT researchers have now discovered a new way to jump-start the immune system to attack tumors, which they hope could allow immunotherapy to be used against more types of cancer.

Their novel approach involves removing tumor cells from the body, treating them with chemotherapy drugs, and then placing them back in the tumor. When delivered along with drugs that activate T cells, these injured cancer cells appear to act as a distress signal that spurs the T cells into action.

“When you create cells that have DNA damage but are not killed, under certain conditions those live, injured cells can send a signal that awakens the immune system,” says Michael Yaffe, who is a David H. Koch Professor of Science, the director of the MIT Center for Precision Cancer Medicine, and a member of MIT’s Koch Institute for Integrative Cancer Research.

In mouse studies, the researchers found that this treatment could completely eliminate tumors in nearly half of the mice.

Yaffe and Darrell Irvine, who is the Underwood-Prescott Professor with appointments in MIT’s departments of Biological Engineering and Materials Science and Engineering, and an associate director of the Koch Institute, are the senior authors of the study, which appears today in Science Signaling. MIT postdoc Ganapathy Sriram and Lauren Milling PhD ’21 are the lead authors of the paper.

T Cell Activation

One class of drugs currently used for cancer immunotherapy is checkpoint blockade inhibitors, which take the brakes off of T cells that have become “exhausted” and unable to attack tumors. These drugs have shown success in treating a few types of cancer but do not work against many others.

Yaffe and his colleagues set out to try to improve the performance of these drugs by combining them with cytotoxic chemotherapy drugs, in hopes that the chemotherapy could help stimulate the immune system to kill tumor cells. This approach is based on a phenomenon known as immunogenic cell death, in which dead or dying tumor cells send signals that attract the immune system’s attention.

Several clinical trials combining chemotherapy and immunotherapy drugs are underway, but little is known so far about the best way to combine these two types of treatment.

The MIT team began by treating cancer cells with several different chemotherapy drugs, at different doses. Twenty-four hours after the treatment, the researchers added dendritic cells to each dish, followed 24 hours later by T cells. Then, they measured how well the T cells were able to kill the cancer cells. To their surprise, they found that most of the chemotherapy drugs didn’t help very much. And those that did help appeared to work best at low doses that didn’t kill many cells.

The researchers later realized why this was so: It wasn’t dead tumor cells that were stimulating the immune system; instead, the critical factor was cells that were injured by chemotherapy but still alive.

“This describes a new concept of immunogenic cell injury rather than immunogenic cell death for cancer treatment,” Yaffe says. “We showed that if you treated tumor cells in a dish, when you injected them back directly into the tumor and gave checkpoint blockade inhibitors, the live, injured cells were the ones that reawaken the immune system.”

The drugs that appear to work best with this approach are drugs that cause DNA damage. The researchers found that when DNA damage occurs in tumor cells, it activates cellular pathways that respond to stress. These pathways send out distress signals that provoke T cells to leap into action and destroy not only those injured cells but any tumor cells nearby.

“Our findings fit perfectly with the concept that ‘danger signals’ within cells can talk to the immune system, a theory pioneered by Polly Matzinger at NIH in the 1990s, though still not universally accepted,” Yaffe says.  

Tumor Elimination

In studies of mice with melanoma and breast tumors, the researchers showed that this treatment eliminated tumors completely in 40 percent of the mice. Furthermore, when the researchers injected cancer cells into these same mice several months later, their T cells recognized them and destroyed them before they could form new tumors.

The researchers also tried injecting DNA-damaging drugs directly into the tumors, instead of treating cells outside the body, but they found this was not effective because the chemotherapy drugs also harmed T cells and other immune cells near the tumor. Also, injecting the injured cells without checkpoint blockade inhibitors had little effect.

“You have to present something that can act as an immunostimulant, but then you also have to release the preexisting block on the immune cells,” Yaffe says.

Yaffe hopes to test this approach in patients whose tumors have not responded to immunotherapy, but more study is needed first to determine which drugs, and at which doses, would be most beneficial for different types of tumors. The researchers are also further investigating the details of exactly how the injured tumor cells stimulate such a strong T cell response.

Suggested Reading:


Measuring Cancer Cells to Tailor Treatments


Stem Cells Role in the Anti-Aging Business


Therapeutic Research Advanced by Stem Cell Science


Biologists Identify New Targets for Cancer Vaccines


Stay up to date. Follow us:


Release – Kratos Reports Third Quarter 2021 Financial Results


Kratos Reports Third Quarter Financial Results


Third Quarter Revenues of $200.6 Million

Third Quarter Space, Satellite and Cyber Busines Revenues of $72.0 million Increased Organically 17.5 percent over the Third Quarter of 2020

Third Quarter Unmanned Systems Segment Revenues of $61.3 Million, Increased Organically 14.6 percent over Third Quarter 2020      

        Third Quarter 2021 Consolidated Book to Bill Ratio of 0.9 to 1        

Last Twelve Months Ended September 26, 2021 Consolidated Book to Bill Ratio of 1.0 to 1

Third Quarter 2021 Unmanned Systems Book to Bill Ratio of 1.1 to 1

Last Twelve Months Ended September 26, 2021 Unmanned Systems Book to Bill Ratio of 1.0 to 1

SAN DIEGO
Nov. 03, 2021 (GLOBE NEWSWIRE) — 
Kratos Defense & Security Solutions, Inc. (Nasdaq:KTOS), a leading National Security Solutions provider, today reported its third quarter 2021 financial results. For the third quarter of 2021, Kratos reported Revenues of 
$200.6 million, Operating Income of 
$10.5 million, Net Loss of 
$2.4 million and Adjusted EBITDA of 
$23.8 million. Included in Net Loss is a tax provision of 
$5.7 million on Income before taxes of 
$4.6 million, primarily reflecting the non-deductibility of certain non-cash stock compensation expense.

Kratos reported third quarter 2021 Net Loss of 
$2.4 million, and GAAP EPS loss of 
$0.02, compared to Net Income of 
$2.4 million and GAAP EPS income of 
$0.02 for the third quarter of 2020. Adjusted EPS was 
$0.09 for the third quarter of 2021 compared to 
$0.09 for the third quarter of 2020. The Company has approximately 
$280 million of net operating loss carryforwards, which are expected to substantially shield Kratos from paying future cash income taxes.   

Third quarter 2021 Revenues of 
$200.6 million decreased from third quarter 2020 Revenues of 
$202.0 million, reflecting a reduction of legacy government services revenues of 
$6.2 million, down from 
$17.4 million in the third quarter of 2020 to 
$11.2 million in the third quarter of 2021 and a 
$5.5 million year over year decrease resulting from a previously disclosed reduction of certain international contracts in our Training Solutions business, offset partially by increased revenues in our Space, Satellite and Cyber business. On a pro forma basis, excluding these reductions, Revenue grew organically 5.8 percent in the third quarter of 2021, as compared to the third quarter of 2020. Third quarter 2021 revenues were negatively impacted by supply chain delays, increased lead times for delivery of necessary components, and customer delays and travel restrictions primarily in our Space and Satellite and C5ISR businesses, resulting in expected revenues of approximately 
$8.3 million being deferred into future periods.

Operating Income of 
$10.5 million in the third quarter of 2021 decreased from 
$12.7 million in the third quarter of 2020, with third quarter 2021 Operating Income including increases in non-cash stock-based compensation expense of 
$1.4 million and R&D of 
$0.3 million over the third quarter of 2020. Third Quarter 2021 Adjusted EBITDA of 
$23.8 million decreased from 
$24.6 million in the third quarter of 2020, primarily reflecting increases in SG&A costs, including increased headcount in our Unmanned Systems business, offset partially by a more favorable mix of revenues.

Third quarter 2021 Cash Flow Generated from Operations was 
$12.6 million, and Free Cash Flow Used from Operations was 
$0.3 million, after funding 
$12.9 million of capital expenditures, including in our high growth Unmanned Systems, Space, Satellite and Cyber business and Turbine Engine business areas. For the nine months ended 
September 26, 2021, Cash Flow Generated from Operations was 
$34.6 million, and Free Cash Flow Generated from Operations was 
$1.2 million, after funding 
$33.4 million of capital expenditures. Cash on hand on 
September 26, 2021 was 
$369.9 million.

For the third quarter of 2021, Kratos’ Unmanned Systems Segment (KUS) Revenues of 
$61.3 million increased 14.6 percent, as compared to 
$53.5 million in the third quarter of 2020, and KUS operating income decreased from 
$3.7 million in the third quarter of 2020 to 
$2.6 million in the third quarter of 2021, primarily due to a less favorable mix of revenues including an increase in development programs, which typically generate lower margins, and due to an increase in SG&A costs, including costs related to increased headcount.

Third quarter 2021 KUS Adjusted EBITDA of 
$4.7 million decreased from third quarter 2020 Adjusted EBITDA of 
$5.6 million, primarily reflecting increases in certain development programs, including in the tactical drone area, which typically generate lower margins, and due to an increase in SG&A costs, including costs related to increased headcount.
        
KUS’s book-to-bill ratio for the third quarter of 2021 was 1.1 to 1.0 and 1.0 to 1.0 for the last twelve months ended 
September 26, 2021, with bookings of 
$230.5 million for the twelve months ended 
September 26, 2021.   Total backlog for KUS at the end of the third quarter of 2021 was 
$194.5 million, up from 
$185.4 million at the end of the second quarter of 2021, and up from 
$189.5 million at the end of the third quarter of 2020.      

For the third quarter of 2021, Kratos’ Government Solutions Segment (KGS) reported Revenues of 
$139.3 million, down from revenues of 
$148.5 million in the third quarter of 2020, reflecting a reduction of legacy services revenues of 
$6.2 million and a reduction of 
$5.5 million from an international training contract. These reductions were partially offset by organic growth in our Space, Satellite and Cyber and Turbine Technologies businesses. KGS reported operating income of 
$14.6 million, up from operating income of 
$14.1 million in the third quarter of 2020, primarily reflecting a more favorable revenue mix in the Company’s Space, Satellite and Cyber and Turbine Technologies businesses.  

Kratos’ Space, Satellite and Cyber business generated Revenues of 
$72.0 million in the third quarter of 2021, an organic increase of 17.5 percent over the third quarter of 2020 Revenues of 
$61.3 million.

Third quarter 2021 KGS Adjusted EBITDA of 
$19.1 million increased from third quarter 2020 Adjusted EBITDA of 
$19.0 million, reflecting a more favorable mix of revenues, primarily in the Space, Satellite and Cyber and Turbine Technologies businesses.

For the third quarter of 2021, KGS reported a book-to-bill ratio of 0.7 to 1.0, and a book to bill ratio of 0.9 to 1 for the twelve months ended 
September 26, 2021. Included in KGS is Kratos’ Space, Cyber and Training business, which reported a book to bill ratio for the twelve months ended 
September 26, 2021 was 1.1 to 1. KGS’s total backlog at the end of the third quarter of 2021 was 
$644.6 million, down from 
$680.2 million at the end of the second quarter of 2021, and down from 
$683.6 million at the end of the third quarter of 2020.

For the third quarter of 2021, Kratos reported consolidated bookings of 
$174.2 million and a book-to-bill ratio of 0.9 to 1.0, with consolidated bookings of 
$770.9 million and a book-to-bill ratio of 1.0 to 1.0 for the last twelve months ended 
September 26, 2021. Backlog on 
September 26, 2021 was 
$839.1 million, down sequentially from 
$865.6 million at 
June 27, 2021 and down from 
$873.1 million at 
September 27, 2020, and Kratos’ bid and proposal pipeline was 
$9.1 billion at 
September 26, 2021. Backlog at 
September 26, 2021 was comprised of funded backlog of 
$618.0 million and unfunded backlog of 
$221.1 million.

Eric DeMarco, Kratos’ President and CEO, said, “Since our last report to you, we have received approximately 
$374 million in sole source, single award target drone related contracts, of which we expect to realize substantially the entire IDIQ amount in Kratos’ revenue over the period of performance. We have successfully competed for and received a 
U.S. Air Force Off-Board Sensing Station affordable tactical jet drone program award, which we believe has potential future opportunity similar to Kratos’ Valkyrie, Gremlins, Air Wolf and Thanatos programs. Our tactical drone related programs continue to progress, including a recent successful series of customer flights for Kratos’ Air Wolf drone and Thanatos. And on 
August 16, the 
Air Force reiterated its commitment to be ready for a 2023 Skyborg Vanguard Program of Record, under which Kratos’ Valkyrie and Mako jet drones are recognized participants.”

Mr. DeMarco, concluded, “Though we expect COVID related, supply chain and customer issues the industry and Kratos are experiencing to continue, there is no change in Kratos’ expected up and to the right long term organic growth profile with increasing profit margins. Kratos is the growth leader in space, satellite communications and unmanned drone systems as reflected in our results today and our C5ISR, Rocket System and Next Generation Engine businesses are also positioned to be future growth leaders. We continue to win new strategic program awards like OBSS, we believe the pending 2022 
DoD budget is favorable for Kratos, we have a number of programs transitioning from development to production, with others expecting increased production and our bid pipeline now stands at approximately 
$9.1 billion.”

Financial Guidance
We are adjusting our 2021 Revenue guidance range from 
$810 million – 
$850 million to 
$805 million – 
$815 million, primarily to reflect continued and increased supply chain and customer delays, and COVID related quarantine issues and restrictions, including where we are unable to enter certain countries to execute on or deliver systems for customers. This adjustment primarily reflects over 
$31 million of under contract revenue that has been deferred from our 2021 third or fourth quarters to future periods, including in our satellite, microwave electronics and C5ISR businesses. We expect supply chain, customer and COVID related disruptions and delays to continue industry wide and as related to Kratos for the foreseeable future, which we are taking into consideration in our future forecasts. The adjustment also reflects a recent Kratos customer re-baselined execution plan and schedule, on a greater than 
$150 million C5ISR under contract Kratos program, which shifted certain tasks into future periods, including 2023. At the midpoint of this revenue range of 
$810 million, excluding the ASC acquisition and the international training contract, Kratos revenues are forecasted to grow organically over 8 percent year over year from 2020 to 2021.
  
We are adjusting our Full Year 2021 EBITDA Guidance range of 
$81 – 
$87 million to 
$80 – 
$84 million to reflect the impact of the revenues shifted from our third and fourth quarters to future periods.  We are improving our 2021 free cash flow use from operations guidance of 
$30 – 
$40 million to a use of 
$20 – 
$30 million, to reflect expected reductions in our Days Sales Outstanding (DSOs) and increased collections, and lower than initially forecast capital and other investments, as certain initiatives are ahead of schedule, under budget or reduced for other reasons. 

$M Q421 FY21
Revenues $205 – 
$215
$805 – 
$815
R&D $8 – 10 $35 – 
$37
Operating Income $7 – 
$9
$26 – 
$29
Depreciation $5 – 
$6
$21 – 
$22
Amortization $2 $6 – 
$7
Stock Based Compensation $6 – 
$7
$26
Adjusted EBITDA $20 – 
$24
$80 – 
$84
     
Operating Cash Flow   $25 – 
$30
Capital Expenditures   $45 – 
$55
Free Cash Flow Use   (
$20 – 
$30)

The full year 2021 estimated Operating Cash Flow includes approximately 
$5 – 
$6 million of planned investments in our Rocket Support Systems and Engine businesses for new products, including in the Hypersonic area, and efforts to increase Kratos’ market share, as well as approximately 
$5 million of the required payback of the 2020 deferred employer related payroll taxes. The 2021 capital expenditure forecast currently includes expected outlays of approximately 
$25 million associated with the continued production of Valkyrie aircraft and related equipment prior to receipt of expected customer award(s); therefore, these aircraft are currently reflected as Company-owned assets until receipt of the related customer award(s). Kratos will adjust the forecasted capital expenditure outlays and the ultimate balance sheet classification of these investments once expected customer orders and the nature of the contract terms can be determined. In addition, the capital expenditure forecast includes investments in the Company’s Space, Satellite and Cyber business secure facilities and the Company-owned space domain awareness network, capital investments related to the recent GBSD (Ground Based Strategic Deterrent) award, and investments related to the Company’s Turbine and Rocket Support Systems businesses.  

There is currently no Federal Fiscal Year 2022 (
October 1, 2021 – 
September 30, 2022) defense budget in place and the defense industry is operating under a Federal Budget Continuing Resolution Authorization (CRA). Under a CRA, there are no new start program awards or new programs of record, no increases in production on existing programs, and no transition from existing development programs to production, among other items, all which impact Kratos. The existing CRA expires on 
December 3, 2021. The ultimate approved and authorized 2022 
DoD budget and its timing is unknown at this time, though the longer the CRA continues, the greater the impact on the industry and the Company.

On 
September 9, 2021 the President issued an Executive Order mandating that by 
December 8, 2021, all Federal Contractor employees must be fully vaccinated against Covid 19, unless excluded by certain limited exemptions. The Company is moving to comply with the President’s Executive Order. As a result of the President’s Executive Order, the Company (and its subcontractors, suppliers, partners, etc.) is experiencing certain disruptions, including but not limited to employee unrest, retirements, resignations, etc. and other situations that we had not previously anticipated or planned for prior to the Executive Order, all of which we are monitoring.

Management will discuss the Company’s third quarter 2021 financial results, as well as its fourth quarter and full year 2021 guidance on a conference call beginning at 
2:00 p.m. Pacific (
5:00 p.m. Eastern) today. Analysts and institutional investors may participate in the conference call by dialing (866) 393-0674, and referencing the call by ID number 6477329. The general public may access the conference call by dialing (877) 344-3935 or on the day of the event by visiting www.kratosdefense.com for a simultaneous webcast. A replay of the webcast will be available on the Kratos web site approximately two hours after the conclusion of the conference call.

About Kratos Defense & Security Solutions

Kratos Defense & Security Solutions, Inc. (NASDAQ:KTOS) develops and fields transformative, affordable technology, platforms, and systems for United States National Security related customers, allies, and commercial enterprises.  Kratos is changing the way breakthrough technologies for these industries are rapidly brought to market through proven commercial and venture capital backed approaches, including proactive research, and streamlined development processes.  At Kratos, affordability is a technology, and we specialize in unmanned systems, satellite communications, cyber security/warfare, microwave electronics, missile defense, hypersonic systems, training and combat systems and next generation turbo jet and turbo fan engine development. For more information go to www.kratosdefense.com.

Notice Regarding ForwardLooking Statements
This news release contains certain forward-looking statements that involve risks and uncertainties, including, without limitation, express or implied statements concerning the Company’s expectations regarding its future financial performance, including the Company’s expectations for its fourth quarter and full year 2021 revenue, R&D, operating income, depreciation, amortization, stock based compensation expense, and Adjusted EBITDA, and full year 2021 operating cash flow, capital expenditures and other investments, and free cash flow, the Company’s future growth trajectory and ability to achieve improved revenue mix and profit in certain of its business segments and the expected timing of such revenue and profit, the Company’s expectation of ramp on projects and that investments in its business will result in an increase in the Company’s market share and total addressable market and position the Company for significant future organic growth, profitability, cash flow and shareholder value, the Company’s bid and proposal pipeline, demand for its products and services, including the Company’s alignment with today’s National Security requirements and expectation that the 2022 
DoD budget will be favorable for the Company, ability to successfully compete in the tactical unmanned aerial system area and expected new customer awards, including the magnitude and timing of funding and the future opportunity associated with such awards, and expected contract awards related to the Company’s Skyborg Vanguard program and other new tactical unmanned programs, performance of key contracts and programs, including the timing of production and demonstration related to certain of the Company’s contracts and product offerings, the impact of the Company’s restructuring efforts and cost reduction measures, including its ability to improve profitability and cash flow in certain business units as a result of these actions, benefits to be realized from the Company’s net operating loss carry forwards, the availability and timing of government funding for the Company’s offerings, including the strength of the future funding environment, the short-term delays that may occur as a result of Continuing Resolutions or delays in 
DoD budget approvals, timing of LRIP and full rate production related to the Company’s unmanned aerial target system offerings, as well as the level of recurring revenues expected to be generated by these programs once they achieve full rate production, market and industry developments, and the current estimated impact of COVID-19 and supply chain disruptions and delays on our financial projections, industry, business and operations, including projected growth. Such statements are only predictions, and the Company’s actual results may differ materially from the results expressed or implied by these statements. Investors are cautioned not to place undue reliance on any such forward-looking statements. All such forward-looking statements speak only as of the date they are made, and the Company undertakes no obligation to update or revise these statements, whether as a result of new information, future events or otherwise. Factors that may cause the Company’s results to differ include, but are not limited to: risks to our business and financial results related to the reductions and other spending constraints imposed on the 
U.S. Government and our other customers, including as a result of sequestration and extended continuing resolutions, the Federal budget deficit and Federal government shut-downs; risks of adverse regulatory action or litigation; risks associated with debt leverage and cost savings and cash flow improvements expected as a result of the refinancing of our Senior Notes; risks that our cost-cutting initiatives will not provide the anticipated benefits; risks that changes, cutbacks or delays in spending by the 
U.S. 
DoD may occur, which could cause delays or cancellations of key government contracts; risks of delays to or the cancellation of our projects as a result of protest actions submitted by our competitors; risks that changes may occur in Federal government (or other applicable) procurement laws, regulations, policies and budgets; risks of the availability of government funding for the Company’s products and services due to performance, cost growth, or other factors, changes in government and customer priorities and requirements (including cost-cutting initiatives, the potential deferral of awards, terminations or reduction of expenditures to respond to the priorities of 
Congress and the Administration, or budgetary cuts resulting from Congressional committee recommendations or automatic sequestration under the Budget Control Act of 2011, as amended); risks that the UAS and UGS markets do not experience significant growth; risks that we cannot expand our customer base or that our products do not achieve broad acceptance which could impact our ability to achieve our anticipated level of growth; risks of increases in the Federal government initiatives related to in-sourcing; risks related to security breaches, including cyber security attacks and threats or other significant disruptions of our information systems, facilities and infrastructures; risks related to our compliance with applicable contracting and procurement laws, regulations and standards; risks related to the new DoD Cybersecurity Maturity Model Certification (CMMC); risks related to contract performance; risks related to failure of our products or services; risks associated with our subcontractors’ or suppliers’ failure to perform their contractual obligations, including the appearance of counterfeit or corrupt parts in our products; changes in the competitive environment (including as a result of bid protests); failure to successfully integrate acquired operations and competition in the marketplace, which could reduce revenues and profit margins; risks that potential future goodwill impairments will adversely affect our operating results; risks that anticipated tax benefits will not be realized in accordance with our expectations; risks that a change in ownership of our stock could cause further limitation to the future utilization of our net operating losses; risks that we may be required to record valuation allowances on our net operating losses which could adversely impact our profitability and financial condition; risks that the current economic environment will adversely impact our business; currently unforeseen risks associated with COVID-19 and risks related to natural disasters or severe weather. These and other risk factors are more fully discussed in the Company’s Annual Report on Form 10-K for the period ended 
December 27, 2020, and in our other filings made with the 
Securities and Exchange Commission.

Note Regarding Use of Non-GAAP Financial Measures and Other Performance Metrics

This news release contains non-GAAP financial measures, including Adjusted earnings per share (computed using income from continuing operations before income taxes, excluding income (loss) from discontinued operations, excluding income (loss) attributable to non-controlling interest, excluding depreciation, amortization of intangible assets, amortization of capitalized contract and development costs, stock-based compensation expense, acquisition and restructuring related items and other, which includes but is not limited to legal related items and foreign transaction gains and losses, less the estimated impact to income taxes) and including Adjusted EBITDA (which includes net income (loss) attributable to noncontrolling interest and excludes, among other things, losses and gains from discontinued operations, acquisition and restructuring related items, stock compensation expense, foreign transaction gains and losses, and the associated margin rates). Additional non-GAAP financial measures include Free Cash Flow from Operations computed as Cash Flow from Operations less Capital Expenditures and Adjusted EBITDA related to our KUS and KGS businesses. Kratos believes this information is useful to investors because it provides a basis for measuring the Company’s available capital resources, the actual and forecasted operating performance of the Company’s business and the Company’s cash flow, excluding non-recurring items and non-cash items that would normally be included in the most directly comparable measures calculated and presented in accordance with GAAP. The Company’s management uses these non-GAAP financial measures along with the most directly comparable GAAP financial measures in evaluating the Company’s actual and forecasted operating performance, capital resources and cash flow. Non-GAAP financial measures should not be considered in isolation from, or as a substitute for, financial information presented in compliance with GAAP, and investors should carefully evaluate the Company’s financial results calculated in accordance with GAAP and reconciliations to those financial statements. In addition, non-GAAP financial measures as reported by the Company may not be comparable to similarly titled amounts reported by other companies. As appropriate, the most directly comparable GAAP financial measures and information reconciling these non-GAAP financial measures to the Company’s financial results prepared in accordance with GAAP are included in this news release.

Another Performance Metric the Company believes is a key performance indicator in our industry is our Book to  Bill Ratio as it provides investors with a measure of the amount of bookings or contract awards as compared to the amount of revenues that have been recorded during the period, and provides an indicator of how much of the Company’s backlog is being burned or utilized in a certain period. The Book to  Bill Ratio is computed as the number of bookings or contract awards in the period divided by the revenues recorded for the same period. The Company believes that the rolling or last twelve months Book to  Bill Ratio is meaningful since the timing of quarter-to-quarter bookings can vary.

Press Contact:
Yolanda White
858-812-7302 Direct

Investor Information:
877-934-4687
investor@kratosdefense.com


Kratos Defense & Security Solutions, Inc.
Unaudited Condensed Consolidated Statements of Operations
(in millions, except per share data)
                 
    Three Months Ended   Nine Months Ended
    September 26,   September 27,   September 26,   September 27,
      2021       2020       2021       2020  
                 
Service revenues   $ 51.6     $ 67.6     $ 166.9     $ 194.1  
Product sales     149.0       134.4       433.0       347.2  
Total revenues     200.6       202.0       599.9       541.3  
Cost of service revenues     35.5       50.5       119.3       141.9  
Cost of product sales     104.5       94.4       317.0       250.5  
Total costs     140.0       144.9       436.3       392.4  
Gross profit – service revenues     16.1       17.1       47.6       52.2  
Gross profit – product sales     44.5       40.0       116.0       96.7  
                 
     Total gross profit     60.6       57.1       163.6       148.9  
                 
Selling, general and administrative expenses     39.6       33.1       110.5       97.3  
Acquisition and restructuring related items     0.3       0.4       0.8       2.0  
Research and development expenses     8.0       7.7       26.2       19.4  
Depreciation     1.1       1.5       3.7       4.5  
Amortization of intangible assets     1.1       1.7       3.7       5.4  
     Operating income     10.5       12.7       18.7       20.3  
Interest expense, net     (5.9 )     (5.9 )     (17.5 )     (16.9 )
Other income, net           0.8       0.2       0.6  
Income from continuing operations before income taxes     4.6       7.6       1.4       4.0  
Provision (benefit) for income taxes from continuing operations     5.7       5.0       (0.6 )     1.8  
Income (loss) from continuing operations     (1.1 )     2.6       2.0       2.2  
Loss from discontinued operations, net of income taxes     (0.8 )     (0.2 )     (1.1 )     (0.8 )
     Net income (loss)     (1.9 )     2.4       0.9       1.4  
     Less: Net income (loss) attributable to noncontrolling interest     0.5           0.3       (0.1 )
     Net income (loss) attributable to Kratos   $ (2.4 )   $ 2.4     $ 0.6     $ 1.5  
                 
Basic income (loss) per common share attributable to Kratos:                
     Income (loss) from continuing operations   $ (0.01 )   $ 0.02     $ 0.01     $ 0.02  
     Loss from discontinued operations     (0.01 )           (0.01 )     (0.01 )
     Net income (loss)     (0.02 )   $ 0.02     $     $ 0.01  
                 
Diluted income (loss) per common share attributable to Kratos:                
     Income (loss) from continuing operations   $ (0.01 )   $ 0.02     $ 0.01     $ 0.02  
     Loss from discontinued operations     (0.01 )           (0.01 )     (0.01 )
     Net income (loss)   $ (0.02 )   $ 0.02     $     $ 0.01  
                 
Weighted average common shares outstanding:                
     Basic weighted average common shares outstanding     124.9       123.1       124.6       112.9  
     Diluted weighted average common shares outstanding     124.9       126.4       127.9       115.9  
                 
Adjusted EBITDA (1)   $ 23.8     $ 24.6     $ 59.5     $ 56.2  


Unaudited Reconciliation of GAAP to Non-GAAP Measures
 
Note: (1) Adjusted EBITDA is a non-GAAP measure defined as GAAP net income (loss) attributable to Kratos adjusted for net income (loss) attributable to noncontrolling interest, income (loss) from discontinued operations, net interest expense, provision for income taxes, depreciation and amortization expense of intangible assets, amortization of capitalized contract and development costs, stock-based compensation, acquisition and restructuring related items and other, and foreign transaction gain (loss).
 
Adjusted EBITDA as calculated by us may be calculated differently than Adjusted EBITDA for other companies. We have provided Adjusted EBITDA because we believe it is a commonly used measure of financial performance in comparable companies and is provided to help investors evaluate companies on a consistent basis, as well as to enhance understanding of our operating results. Adjusted EBITDA should not be construed as either an alternative to net income or as an indicator of our operating performance or an alternative to cash flows as a measure of liquidity. The adjustments to calculate this non-GAAP financial measure and the basis for such adjustments are outlined below. Please refer to the following table below that reconciles GAAP net income (loss) to Adjusted EBITDA.
 
The adjustments to calculate this non-GAAP financial measure, and the basis for such adjustments, are outlined below:
 
Interest income and interest expense, net. The Company receives interest income on investments and incurs interest expense on loans, capital leases and other financing arrangements, including the amortization of issue discounts and deferred financing costs. These amounts may vary from period to period due to changes in cash and debt balances.
 
Income taxes. The Company’s tax expense can fluctuate materially from period to period due to tax adjustments that may not be directly related to underlying operating performance or to the current period of operations and may not necessarily reflect the impact of utilization of our NOLs.
 
Depreciation. The Company incurs depreciation expense (recorded in cost of revenues and in operating expenses) related to capital assets purchased, leased or constructed to support the ongoing operations of the business. The assets are recorded at cost or fair value and are depreciated over the estimated useful lives of individual assets.
 
Amortization of intangible assets. The Company incurs amortization of intangible expense related to acquisitions it has made. These intangible assets are valued at the time of acquisition and are amortized over the estimated useful lives.
 
Amortization of capitalized contract and development costs. The Company incurs amortization of previously capitalized software development and non-recurring engineering costs related to certain targets in its Unmanned Systems and ballistic missile target businesses as these units are sold.
 
Stock-based compensation expense. The Company incurs expense related to stock-based compensation included in its GAAP presentation of selling, general and administrative expense. Although stock-based compensation is an expense of the Company and viewed as a form of compensation, these expenses vary in amount from period to period, and are affected by market forces that are difficult to predict and are not within the control of management, such as the market price and volatility of the Company’s shares, risk-free interest rates and the expected term and forfeiture rates of the awards. Management believes that exclusion of these expenses allows comparison of operating results to those of other companies that disclose non-GAAP financial measures that exclude stock-based compensation.
 
Foreign transaction (gain) loss. The Company incurs transaction gains and losses related to transactions with foreign customers in currencies other than the 
U.S. dollar. In addition, certain intercompany transactions can give rise to realized and unrealized foreign currency gains and losses.
 
Acquisition and transaction related items. The Company incurs transaction related costs, such as legal and accounting fees and other expenses, related to acquisitions and divestiture activities. Management believes these items are outside the normal operations of the Company’s business and are not indicative of ongoing operating results.
 
Restructuring costs. The Company incurs restructuring costs for cost reduction actions which include employee termination costs, facility shut-down related costs and remaining lease commitment costs for excess or exited facilities. Management believes that these costs are not indicative of ongoing operating results as they are either non-recurring and/or not expected when full capacity and volumes are achieved.
 
Legal related items. The Company incurs costs related to pending legal settlements and other legal related matters. Management believes these items are outside the normal operations of the Company’s business and are not indicative of ongoing operating results.
 
Adjusted EBITDA is a non-GAAP financial measure and should not be considered in isolation or as a substitute for financial information provided in accordance with GAAP. This non-GAAP financial measure may not be computed in the same manner as similarly titled measures used by other companies. The Company expects to continue to incur expenses similar to the Adjusted EBITDA financial adjustments described above, and investors should not infer from the Company’s presentation of this non-GAAP financial measure that these costs are unusual, infrequent, or non-recurring.


Reconciliation of Net income attributable to Kratos to Adjusted EBITDA is as follows:                
                 
    Three Months Ended   Nine Months Ended
    September 26,   September 27,   September 26,   September 27,
      2021       2020       2021       2020  
                 
Net income (loss) attributable to Kratos   $ (2.4 )   $ 2.4     $ 0.6     $ 1.5  
Loss from discontinued operations, net of income taxes     0.8       0.2       1.1       0.8  
Interest expense, net     5.9       5.9       17.5       16.9  
Provision (benefit) for income taxes from continuing operations     5.7       5.0       (0.6 )     1.8  
Depreciation (including cost of service revenues and product sales)     5.0       4.5       15.7       13.1  
Stock-based compensation     6.4       5.0       19.2       14.5  
Foreign transaction (gain) loss     0.2       (0.7 )     0.4       (0.4 )
Amortization of intangible assets     1.1       1.7       3.7       5.4  
Amortization of capitalized contract and development costs     0.3       0.2       0.8       0.7  
Acquisition and restructuring related items and other     0.3       0.4       0.8       2.0  
Plus: Net income (loss) attributable to noncontrolling interest     0.5             0.3       (0.1 )
                 
Adjusted EBITDA   $ 23.8     $ 24.6     $ 59.5     $ 56.2  
                 
                 
Reconciliation of acquisition and restructuring related items and other included in Adjusted EBITDA:            
    Three Months Ended   Nine Months Ended
    September 26,   September 27,   September 26,   September 27,
      2021       2020       2021       2020  
Acquisition and transaction related items   $ 0.3     $ 0.1     $ 0.6     $ 1.5  
Restructuring costs           0.3       0.2       0.5  
                 
    $ 0.3     $ 0.4     $ 0.8     $ 2.0  
                 
                 
Kratos Defense & Security Solutions, Inc.
Unaudited Segment Data
(in millions)
                 
    Three Months Ended   Nine Months Ended
    September 26,   September 27,   September 26,   September 27,
      2021       2020       2021       2020  
Revenues:                
Unmanned Systems   $ 61.3     $ 53.5     $ 177.5     $ 137.5  
Kratos Government Solutions     139.3       148.5       422.4       403.8  
Total revenues   $ 200.6     $ 202.0     $ 599.9     $ 541.3  
                 
Operating income                
Unmanned Systems   $ 2.6     $ 3.7     $ 10.9     $ 5.2  
Kratos Government Solutions     14.6       14.1       27.6       31.1  
Unallocated corporate expense, net     (6.7 )     (5.1 )     (19.8 )     (16.0 )
Total operating income   $ 10.5     $ 12.7     $ 18.7     $ 20.3  
                 
Note: Unallocated corporate expense, net includes costs for certain stock-based compensation programs (including stock-based compensation costs for stock options, employee stock purchase plan and restricted stock units), the effects of items not considered part of management’s evaluation of segment operating performance, and acquisition and restructuring related items, corporate costs not allocated to the segments, legal related items, and other miscellaneous corporate activities.
                 
Reconciliation of Segment Operating Income to Adjusted EBITDA is as follows:                
                 
    Three Months Ended   Nine Months Ended
    September 26,   September 27,   September 26,   September 27,
      2021       2020       2021       2020  
Unmanned Systems                
Operating income   $ 2.6     $ 3.7     $ 10.9     $ 5.2  
Other income                 0.1       0.1  
Depreciation     1.6       1.5       5.4       4.5  
Amortization of intangible assets     0.2       0.2       0.8       0.4  
Amortization of capitalized contract and development costs     0.3       0.2       0.8       0.7  
Adjusted EBITDA   $ 4.7     $ 5.6     $ 18.0     $ 10.9  
% of revenue     7.7 %     10.5 %     10.1 %     7.9 %
                 
Kratos Government Solutions                
Operating income   $ 14.6     $ 14.1     $ 27.6     $ 31.1  
Other income     0.2       0.1       0.5       0.1  
Depreciation     3.4       3.0       10.3       8.6  
Amortization of intangible assets     0.9       1.5       2.9       5.0  
Acquisition and restructuring related items and other           0.3       0.2       0.5  
Adjusted EBITDA   $ 19.1     $ 19.0     $ 41.5     $ 45.3  
% of revenue     13.7 %     12.8 %     9.8 %     11.2 %
                 
Total Adjusted EBITDA   $ 23.8     $ 24.6     $ 59.5     $ 56.2  
% of revenue     11.9 %     12.2 %     9.9 %     10.4 %


Kratos Defense & Security Solutions, Inc.
Unaudited Condensed Consolidated Balance Sheets
(in millions)
       
   
  September 26,   December 27,
    2021       2020  
Assets      
Current assets:      
Cash and cash equivalents $ 369.9     $ 380.8  
Restricted cash         0.7  
Accounts receivable, net   274.7       272.3  
Inventoried costs   90.9       81.2  
Prepaid expenses   11.7       12.0  
Other current assets   25.4       17.8  
Total current assets   772.6       764.8  
Property, plant and equipment, net   158.8       143.8  
Operating lease right-of-use assets   38.8       42.9  
Goodwill   483.7       483.9  
Intangible assets, net   39.3       43.0  
Other assets   84.6       84.4  
Total assets $ 1,577.8     $ 1,562.8  
Liabilities and Stockholders’ Equity      
Current liabilities:      
Accounts payable $ 43.6     $ 55.4  
Accrued expenses   28.7       34.7  
Accrued compensation   51.3       48.1  
Accrued interest   6.4       1.5  
Billings in excess of costs and earnings on uncompleted contracts   57.7       34.0  
Current portion of operating lease liabilities   9.2       8.9  
Other current liabilities   10.6       11.9  
Other current liabilities of discontinued operations   3.1       3.1  
Total current liabilities   210.6       197.6  
Long-term debt   296.5       301.0  
Operating lease liabilities, net of current portion   34.0       38.6  
Other long-term liabilities   77.3       83.0  
Other long-term liabilities of discontinued operations   2.5       2.5  
Total liabilities   620.9       622.7  
Commitments and contingencies      
Redeemable noncontrolling interest   15.1       14.8  
Stockholders’ equity:      
Additional paid-in capital   1,572.3       1,556.3  
Accumulated other comprehensive loss   1.3       1.4  
Accumulated deficit   (631.8 )     (632.4 )
Total Kratos stockholders’ equity   941.8       925.3  
Total liabilities and stockholders’ equity $ 1,577.8     $ 1,562.8  


Kratos Defense & Security Solutions, Inc.
Unaudited Condensed Consolidated Statements of Cash Flows
(in millions)
       
  Nine Months Ended
  September 26,   September 27,
    2021       2020  
Operating activities:      
Net income $ 0.9     $ 1.4  
Less: loss from discontinued operations   (1.1 )     (0.8 )
Income from continuing operations   2.0       2.2  
Adjustments to reconcile income from continuing operations to net cash provided by operating activities from continuing operations:      
Depreciation and amortization   19.4       18.5  
Amortization of lease right-of-use assets   6.7       7.3  
Deferred income taxes   (0.7 )     (0.3 )
Stock-based compensation   19.2       14.5  
Amortization of deferred financing costs   0.7       0.7  
Provision for (recovery of) doubtful accounts   (0.2 )     0.2  
Changes in assets and liabilities, net of acquisitions:      
Accounts receivable   10.1       6.4  
Unbilled receivables   (12.2 )     (12.3 )
Inventoried costs   (6.8 )     (4.8 )
Prepaid expenses and other assets   (5.1 )     (15.8 )
Operating lease liabilities   (6.7 )     (8.0 )
Accounts payable   (10.5 )     (1.7 )
Accrued compensation   3.3       6.5  
Accrued expenses   (6.0 )     (4.9 )
Accrued interest   4.8       4.8  
Billings in excess of costs and earnings on uncompleted contracts   23.8       (2.7 )
Income tax receivable and payable   (2.5 )     (1.4 )
Other liabilities   (4.7 )     9.9  
Net cash provided by operating activities from continuing operations   34.6       19.1  
Investing activities:      
Cash paid for acquisitions, net of cash acquired   (6.2 )     (43.9 )
Capital expenditures   (33.4 )     (23.0 )
 Proceeds from insurance   4.5        
 Proceeds from sale of assets         0.1  
Net cash used in investing activities from continuing operations   (35.1 )     (66.8 )
Financing activities:      
Proceeds from the issuance of long-term debt         4.8  
Payment of long-term debt   (5.1 )     (0.7 )
Proceeds from the issuance of common stock, net of issuance costs         240.4  
Payment under finance leases   (0.7 )     (0.5 )
Payments of employee taxes withheld from share-based awards   (9.1 )     (1.3 )
Proceeds from shares issued under equity plans   5.9       5.3  
Net cash provided by (used in) financing activities from continuing operations   (9.0 )     248.0  
Net cash flows from continuing operations   (9.5 )     200.3  
   Net operating cash flows of discontinued operations   (1.1 )     2.1  
Effect of exchange rate changes on cash and cash equivalents   (1.0 )     0.4  
Net increase (decrease) in cash, cash equivalents and restricted cash   (11.6 )     202.8  
Cash, cash equivalents and restricted cash at beginning of period   381.5       172.6  
Cash, cash equivalents and restricted cash at end of period $ 369.9     $ 375.4  


Kratos Defense & Security Solutions, Inc.

Unaudited Non-GAAP Measures
Computation of Adjusted Earnings Per Share
(in millions, except per share data)
                 
Adjusted income from continuing operations and adjusted income from continuing operations per diluted common share (Adjusted EPS) are non-GAAP measures for reporting financial performance and exclude the impact of certain items and, therefore, have not been calculated in accordance with GAAP. Management believes that exclusion of these items assists in providing a more complete understanding of the Company’s underlying continuing operations results and trends and allows for comparability with our peer company index and industry. The Company uses these measures along with the corresponding GAAP financial measures to manage the Company’s business and to evaluate its performance compared to prior periods and the marketplace. The Company defines adjusted income from continuing operations before amortization of intangible assets, depreciation, stock-based compensation, foreign transaction gain/loss, and acquisition and restructuring related items and other. The estimated impact to income taxes includes the impact to the effective tax rate, current tax provision and deferred tax provision, and excludes the impact of discrete items, including transaction related expenses and release of valuation allowance, or benefit related to the add-backs.*
Adjusted EPS reflects adjusted income on a per share basis using weighted average diluted shares outstanding.
                 
The following table reconciles the most directly comparable GAAP financial measures to the non-GAAP financial measures.        
                 
    Three Months Ended   Nine Months Ended
    September 26,   September 27,   September 26,   September 27,
      2021       2020       2021       2020  
Net income (loss) attributable to Kratos   $ (2.4 )   $ 2.4     $ 0.6     $ 1.5  
Less: GAAP provision (benefit) for income taxes     5.7       5.0       (0.6 )     1.8  
Less: Net income (loss) attributable to noncontrolling interest     0.5             0.3       (0.1 )
Less: Loss from discontinued operations, net of income taxes     0.8       0.2       1.1       0.8  
Income from continuing operations before taxes     4.6       7.6   $   1.4       4.0  
Add: Amortization of intangible assets     1.1       1.7       3.7       5.4  
Add: Amortization of capitalized contract and development costs     0.3       0.2       0.8       0.7  
Add: Depreciation     5.0       4.5       15.7       13.1  
Add: Stock-based compensation     6.4       5.0       19.2       14.5  
Add: Foreign transaction (gain) loss     0.2       (0.7 )     0.4       (0.4 )
Add: Acquisition and restructuring related items and other     0.3       0.4       0.8       2.0  
   Non-GAAP Adjusted income from continuing operations before income taxes     17.9       18.7       42.0       39.3  
Income taxes on Non-GAAP measure Adjusted income from continuing operations*     6.5       7.2       15.3       15.4  
   Non-GAAP Adjusted net income   $ 11.4     $ 11.5     $ 26.7     $ 23.9  
                 
                 
Diluted earnings per common share   $ (0.02 )   $ 0.02     $     $ 0.01  
Less: GAAP provision (benefit) for income taxes     0.05       0.04             0.01  
Less: Net income (loss) attributable to noncontrolling interest                        
Less: Loss from discontinued operations, net of income taxes     0.01             0.01       0.01  
Add: Amortization of intangible assets     0.01       0.01       0.03       0.05  
Add: Amortization of capitalized contract and development costs                 0.01       0.01  
Add: Depreciation     0.04       0.04       0.12       0.11  
Add: Stock-based compensation     0.05       0.04       0.15       0.12  
Add: Foreign transaction (gain) loss           (0.01 )            
Add: Acquisition and restructuring related items and other           0.01       0.01       0.02  
Income taxes on Non-GAAP measure Adjusted income from continuing operations*     (0.05 )     (0.06 )     (0.12 )     (0.13 )
Adjusted income from continuing operations per diluted common share   $ 0.09     $ 0.09     $ 0.21     $ 0.21  
                 
Weighted average diluted common shares outstanding     124.9       126.4       127.9       115.9  
                 
*The impact to income taxes is calculated by recasting income before income taxes to include the add-backs involved in determining Adjusted income from continuing operations before income taxes and recalculating the income tax provision (benefit), including current and deferred income taxes, using the Adjusted income from continuing operations before income taxes. The recalculation also adjusts for any discrete tax expense, including transaction related expenses and the release of valuation allowance, or benefit related to the add-backs.

Source: Kratos Defense & Security Solutions, Inc.

eSports Entertainment Group Inc. (GMBL) – Just What The Doctor Ordered

Thursday, November 04, 2021

eSports Entertainment Group, Inc. (GMBL)
Just What The Doctor Ordered

Esports Entertainment Group Inc is a development-stage online gambling company focused purely on esports. The company’s principal business operations include design, develop and test wagering systems.

Michael Kupinski, Director of Research, Noble Capital Markets, Inc.

Refer to the full report for the price target, fundamental analysis, and rating.

    Plans to raise cash. The company announced an offering for 1,500,000 Series A Cumulative Redeemable Convertible Preferred Shares. The price of the newly offered preferred stock will be $10 per share and each share will be convertible to common stock anytime by the holder, at a price of $17.50 per share. At $10 per share, the 1.5-million share offering is set to provide the company with an influx of cash roughly in the amount of $15 million. Additionally, the company has signaled its intention to allow a 45-day window wherein the underwriters can purchase another 225,000 Series A Preferred Shares. With the potential for additional share purchases by the underwriters, the total cash raise for the company could reach $17.25 million. The company has applied to list the new preferred shares on the NASDAQ using the symbol, “GMBLP.” We view the move favorably and believe that it is the right financial instrument at this time to raise cash.

    Resetting the clock.  The company found itself low on cash in recent months. After its $17 million acquisition of Bethard in July, the company’s cash position had been depleted from nearly $20 million as of June 30th to an estimated $2.5 million by October. Moreover, the company’s cash burn has been about $1 million per month, further highlighting the need to raise cash. Therefore, the $15 million …


This Company Sponsored Research is provided by Noble Capital Markets, Inc., a FINRA and S.E.C. registered broker-dealer (B/D).

*Analyst certification and important disclosures included in the full report. NOTE: investment decisions should not be based upon the content of this research summary.  Proper due diligence is required before making any investment decision.