Release – Gray Announces Closing Of Offering Of $1300.0 Million Of 5.375 Senior Notes Due 2031


Gray Announces Closing Of Offering Of $1,300.0 Million Of 5.375% Senior Notes Due 2031


ATLANTA, Nov. 09, 2021 (GLOBE NEWSWIRE) — Gray Television, Inc. (“Gray”) (NYSE: GTN) announced today that it has completed its previously announced offering of $1,300.0 million in aggregate principal amount of 5.375% senior notes due 2031 (the “Notes”) by Gray Escrow II, Inc., a special purpose wholly owned subsidiary of Gray (the “Escrow Issuer”). The Notes were issued at 100.000% of par.

At closing, the proceeds of the Notes were funded into an escrow account. The Notes were sold to finance, together with cash on hand and anticipated borrowings under Gray’s senior credit facility, Gray’s pending merger with Meredith Corporation (“Meredith”), pursuant to which Gray will acquire Meredith’s local media group, immediately after and subject to Meredith’s spin-off of its national media group to the Meredith shareholders (the “Meredith Acquisition”), which is expected to close prior to Gray’s 2021 fiscal year end. If the Meredith Acquisition is consummated and certain other conditions are satisfied, the net proceeds from the offering will be released from the escrow account to fund the Meredith Acquisition, the Escrow Issuer will merge with and into Gray, and Gray will become the primary obligor under the Notes (the “Assumption”).

Following the Assumption, the Notes will be guaranteed, jointly and severally, by each existing and future restricted subsidiary of Gray that guarantees Gray’s existing senior credit facility.

Interest on the Notes accrues from November 9, 2021 and is payable semiannually, on May 15 and November 15 of each year, commencing May 15, 2022. The Notes mature on November 15, 2031.

The Notes and the related guarantees have not been, and will not be, registered under the Securities Act of 1933 or the securities laws of any other jurisdiction and may not be offered or sold in the United States absent registration or an applicable exemption therefrom. The Notes were offered only to qualified institutional buyers under Rule 144A and to persons outside the United States under Regulation S.

Cautionary Statements for Purposes of the “Safe Harbor” Provisions of the Private Securities Litigation Reform Act

This press release contains certain forward-looking statements that are based largely on Gray’s current expectations and reflect various estimates and assumptions by Gray. These statements are statements other than those of historical fact, and may be identified by words such as “estimates,” “expect,” “anticipate,” “will,” “implied,” “assume” and similar expressions. Forward-looking statements are subject to certain risks, trends and uncertainties that could cause actual results and achievements to differ materially from those expressed in such forward-looking statements. Such risks, trends and uncertainties, which in some instances are beyond Gray’s control, include Gray’s ability to complete its pending acquisition of Meredith Corporation’s local media group or other pending transactions on the terms and within the timeframe currently contemplated, any material regulatory or other unexpected requirements in connection therewith, and other future events. Gray is subject to additional risks and uncertainties described in Gray’s quarterly and annual reports filed with the Securities and Exchange Commission from time to time, including in the “Risk Factors,” and management’s discussion and analysis of financial condition and results of operations sections contained therein, which reports are made publicly available via its website, www.gray.tv. Any forward-looking statements in this communication should be evaluated in light of these important risk factors. This press release reflects management’s views as of the date hereof. Except to the extent required by applicable law, Gray undertakes no obligation to update or revise any information contained in this communication beyond the date hereof, whether as a result of new information, future events or otherwise.


Contact Data

Gray Contacts:
www.gray.tv
Jim Ryan, Executive Vice President and Chief Financial Officer, 404-504-9828
Kevin P. Latek, Executive Vice President, Chief Legal and Development Officer, 404-266-8333

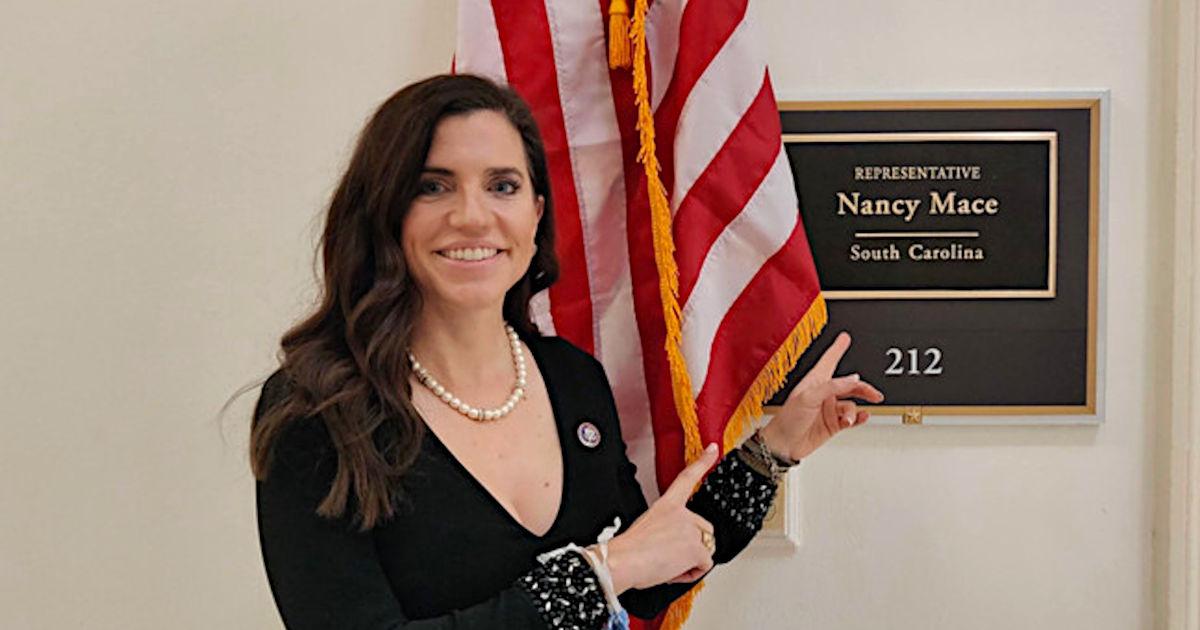
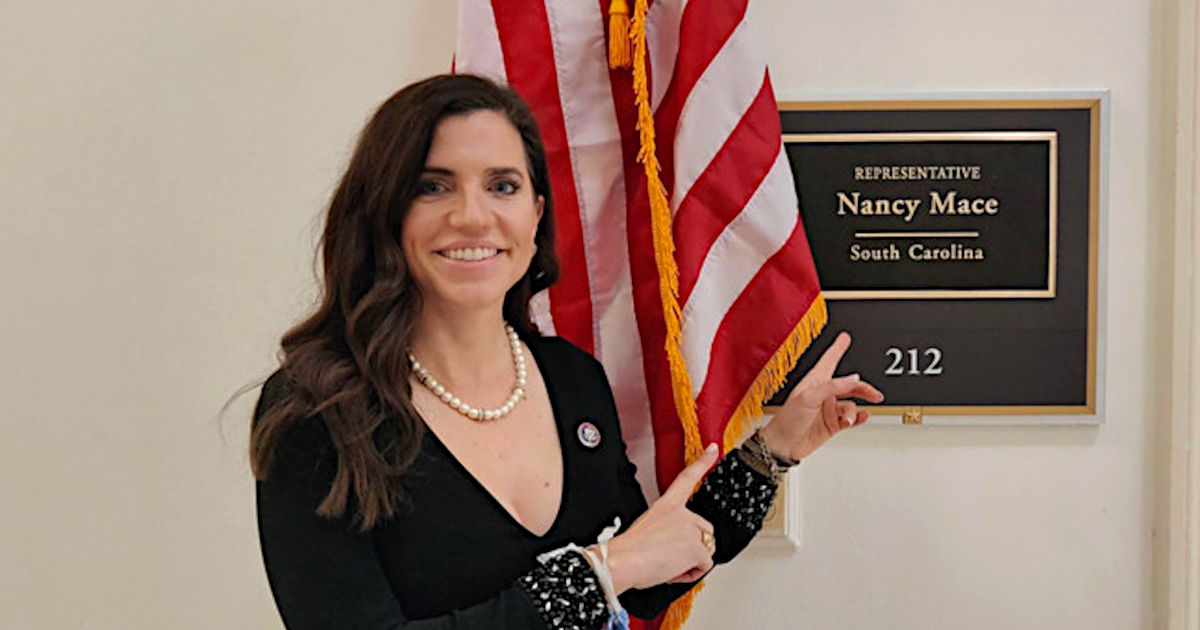
Cannabis Bill Proposed by Republican House Member Softer on Marijuana Taxes


Image Credit: @nancymace (Twitter)

The House Now Has Democrat-led and Republican-led Marijuana Bills, the President is Still Opposed


In a positive turn of events for those supporting federal rescheduling of marijuana, a freshman congresswoman, who was the only Republican vote in favor of a cannabis research bill for veterans last Thursday (11/4), has presented a bill that is an alternative to the Democrats bill in The House’s Marijuana Opportunity, Reinvestment, and Expungement (MORE) Act.

Like the MORE Act, the Republican draft bill aims to decriminalize marijuana. Both proposals would also work to address previous incarcerations and enact criminal and social justice reforms, including the expungement of prior convictions. However, the Republican proposal has specifically mentioned that only those cannabis-related convictions with no-violent records will be eligible for expungement.

One important difference in what may become competing thoughts between this new bill and the MORE Act is the level of excise tax. The tax on cannabis as envisioned in the Republican-led draft bill is 3.75%. The MORE Act Proposes a 5% tax to start with a final rate of 8% over three years.

In the meantime, cannabis stocks have been outperforming the overall market since last Thursday. As of now, using diversified cannabis ETFs as a proxy (MJ, TOKE), stocks in this industry are up on average over 14%.

Oversight

The chief regulator in the market under the proposal would be the Treasury Department’s Alcohol and Tobacco Tax and Trade Bureau (TTB).  The Food and Drug Administration (FDA) oversight would be limited to advising serving size, certifying designated state medical cannabis products, and approving pharmaceutical derivatives.  The FDA would be prevented from banning the use of cannabis products for non-medical use.

Not unlike cigarettes or spirits, advertising could be restricted, and only adults (from 21 years old) will be legally permitted to consume recreational cannabis.

Revenue from taxation would aim to support grant programs for reintegration, law enforcement, and aids for newly licensed businesses and Small Business Administration (SBA) activities, which would need to treat marijuana businesses the same as other regulated markets.

Why it’s Important

The President personally opposes ending marijuana prohibitions. He does; however, support repairing the harm that harsh criminalization has had on individuals and families. This is the first Republican-led bill introduced in the House of Representatives; it could set up a debate over issues in the competing bill rather than just debate as to whether one side is for full decriminalization or against.

As for the President and Congress members who are still opposed to ending prohibition, a new Gallup poll shows that 68% of Americans support legalization. This is the same percentage as one year ago in the previous Gallup Poll. According to the poll, 50% of registered Republicans support legalization and 83% of Democrats support the measure.

Take-Away

Cannabis stocks moved up double digits after a Republican Bill emerged as an alternative to the Democrat’s More Act. This is the first of its kind on the Republican side and could change the discussion from “should we oppose” to, “let’s debate the differences.” One of the major differences is the excise tax level.


Suggested Reading:


Marijuana, CBD, and Hemp Vapes Can Never Be Mailed to Customers


Cannabis Related Businesses (CRB) New Access to Banking Services


Federal Law Questions Still Loom for the Cannabis Industry


Tradestation and Trump Media aren’t the Only Hot SPAC Stories


Sources:

https://news.gallup.com/poll/356939/support-legal-marijuana-holds-record-high.aspx

https://www.congress.gov/bill/117th-congress/house-bill/2916/

https://www.marijuanamoment.net/here-are-the-full-details-of-the-new-federal-marijuana-legalization-bill-from-chuck-schumer-and-senate-colleagues/

https://www.marijuanamoment.net/congressional-lawmakers-approve-marijuana-research-bill-for-veterans-in-committee-vote/

https://www.marijuanamoment.net/republican-led-bill-to-legalize-and-tax-marijuana-emerges-as-alternative-to-democratic-measures/


Stay up to date. Follow us:


Release – Ocugen Provides Business Update and Third Quarter 2021 Financial Results


Ocugen Provides Business Update and Third Quarter 2021 Financial Results


Conference Call and Webcast Today at 8:30 a.m. ET

  • Emergency Use Authorization application filed with the U.S. FDA for the COVID-19 vaccine candidate, COVAXIN™ (BBV152), for children aged 2 – 18 years
  • Investigational New Drug application filed with the U.S. FDA for COVAXIN™ (BBV152)
  • Investigational New Drug application filed with the U.S. FDA for breakthrough modifier gene therapy candidate, OCU400
  • Collaboration with CanSinoBIO expanded to include OCU410 for chemistry, manufacturing, and controls development and manufacturing

MALVERN, Pa. , Nov. 09, 2021 (GLOBE NEWSWIRE) — Ocugen, Inc. (Ocugen or the Company) (NASDAQ: OCGN), a biopharmaceutical company focused on discovering, developing, and commercializing gene therapies to cure blindness diseases and developing a vaccine to save lives from COVID-19, today reported third quarter 2021 financial results along with a general business update.

“We’ve been relentless in our efforts to launch our innovative medicines onto regulatory pathways here in the United States. The submission of COVAXIN for Emergency Use Authorization for pediatrics is another example of Ocugen contributing to public health efforts to curb the pandemic, giving parents another option for protecting their children. Two Investigational New Drug submissions within a span of two weeks is a phenomenal achievement resulting from the work of international teams aligned around serving people with serious diseases. Our capabilities in the areas of R&D, clinical development, manufacturing, and commercial continue to expand with our workforce nearly doubling since the last quarter to deliver for the future. I’m really proud of the teams for their commitment to meeting our mission,” said Dr. Shankar Musunuri, Chairman, Chief Executive Officer, and Co-Founder of Ocugen.

Business Highlights

FORWARD MOMENTUM FOR COVAXIN™ AND OPHTHALMIC PIPELINE

  • The Company filed an Emergency Use Authorization (EUA) application with the U.S. Food and Drug Administration (FDA) for the use of the COVID-19 vaccine candidate, COVAXIN™ (BBV152), for children aged 2 – 18 years. The Company believes its vaccine candidate has the potential to fulfill an unmet need in the national arsenal of COVID-19 vaccines. The inactivated virus platform has been used for decades in vaccines for pediatric populations.
  • The Company also filed an Investigational New Drug (IND) application with the FDA to initiate a Phase 3 clinical trial evaluating COVAXIN™ (BBV152) in support of an upcoming Biologics License Application (BLA) submission. The observer-blind, immuno-bridging study of the whole-virion, inactivated SARS-CoV-2 vaccine candidate in healthy adults, if allowed to proceed, will help demonstrate that the Phase 3 data from the studies conducted by Bharat Biotech International Limited (Bharat Biotech) in India will be applicable to the U.S. population. Under the IND, the Company will also initiate a safety-bridging study, if required.
  • The Company filed an IND application with the FDA for OCU400 for the Phase 1/2 study to assess the safety of OCU400 (NR2E3) in patients with a mutation in NR2E3 and RHO mutation-associated retinal degeneration. If allowed to proceed, the Company is planning to initiate this clinical trial in the United States around the end of 2021.
  • In September 2021, the Company entered into a Development and Commercial Supply Agreement with Bharat Biotech, pursuant to which Bharat Biotech will supply the Company with clinical trial materials and commercial supplies of COVAXIN™ finished drug product prior to the completion of the Company’s technology transfer to Jubilant HollisterStier.
  • In September 2021, the Company and CanSino Biologics, Inc. (“CanSinoBIO”) expanded their current collaboration on the development of OCU400 to now include OCU410. With that, CanSinoBIO will be responsible for the chemistry, manufacturing, and controls (CMC) development and manufacture of clinical supplies of both products and be responsible for the costs associated with such activities.

Third Quarter 2021 Financial Results

  • Ocugen’s cash, cash equivalents, and restricted cash totaled $107.5 million as of September 30, 2021, compared to $24.2 million as of December 31, 2020. Ocugen had 198.9 million shares of common stock outstanding as of September 30, 2021.
  • Research and development expenses for the three months ended September 30, 2021 were $6.3 million compared to $1.5 million for the three months ended September 30, 2020. General and administrative expenses for the three months ended September 30, 2021 were $4.5 million compared to $1.7 million for the three months ended September 30, 2020. Ocugen reported a $0.05 net loss per share for the three months ended September 30, 2021 compared to a $0.07 net loss per share for the three months ended September 30, 2020, which includes the in-process research and development expense of $7.0 million related to the reduction of the carrying value of an asset that was previously recorded as held for sale.

Conference Call and Webcast Details

Ocugen has scheduled a conference call and webcast for 8:30 a.m. eastern time today to discuss the financial results and recent business highlights. Ocugen’s senior management team will host the call, which will be open to all listeners. There will also be a question-and-answer session following the prepared remarks.

The call can be accessed by dialing (844) 873-7330 (U.S.) or (602) 563-8473 (international) and providing the conference ID 8198297. To access a live audio webcast of the call on the “Investors” section of the Ocugen website, please click here. A replay of the webcast will be archived on Ocugen’s website for approximately 45 days following the call.

About Ocugen, Inc.
Ocugen, Inc. is a biopharmaceutical company focused on discovering, developing, and commercializing gene therapies to cure blindness diseases and developing?a vaccine to?save lives from COVID-19. Our breakthrough modifier gene therapy platform has the potential to treat multiple retinal diseases with one drug – “one to many” and our novel biologic product candidate aims to offer better therapy to patients with underserved diseases such as wet age-related macular degeneration, diabetic macular edema, and diabetic retinopathy.?We are co-developing Bharat Biotech’s COVAXIN™ vaccine candidate for COVID-19 in the U.S. and Canadian markets.?For more information, please visit www.ocugen.com.

Cautionary Note on Forward-Looking Statements
This press release contains forward-looking statements within the meaning of The Private Securities Litigation Reform Act of 1995, which are subject to risks and uncertainties. We may, in some cases, use terms such as “predicts,” “believes,” “potential,” “proposed,” “continue,” “estimates,” “anticipates,” “expects,” “plans,” “intends,” “may,” “could,” “might,” “will,” “should” or other words that convey uncertainty of future events or outcomes to identify these forward-looking statements. Such forward-looking statements include information about qualitative assessments of available data, potential benefits, expectations for clinical trials, and anticipated timing of clinical trial readouts and regulatory submissions, including with respect to our belief that COVAXIN™ has the potential to fulfill an unmet need in the national arsenal of COVID-19 vaccines, our plans to initiate the Phase 1/2 study for OCU400, if authorized to proceed, near the end of 2021, and our belief that the results from the Phase 3 study for COVAXIN™, if allowed to proceed, will help demonstrate that the Phase 3 data from the studies conducted by Bharat Biotech Bharat Biotech in India will be applicable to the U.S. population. This information involves risks and uncertainties that could cause actual results to differ materially from those expressed or implied by such statements. Risks and uncertainties include, among other things, the uncertainties inherent in research and development, including the ability to meet anticipated clinical endpoints, commencement and/or completion dates for clinical trials, regulatory submission dates, regulatory approval dates and/or launch dates, including whether the FDA will authorize COVAXIN™ for administration as a vaccine for pediatric uses against COVID-19 pursuant to the EUA we submitted with the FDA and the timing and scope of any such authorization, as well as risks associated with preliminary and interim data, including the possibility of unfavorable new clinical trial data and further analyses of existing clinical trial data; the risk that the results of in-vitro studies will not be duplicated in human clinical trials; the risk that clinical trial data are subject to differing interpretations and assessments, including during the peer review/publication process, in the scientific community generally, and by regulatory authorities; whether and when data from Bharat Biotech’s clinical trials will be published in scientific journal publications and, if so, when and with what modifications; whether the data and results from the preclinical and clinical studies of COVAXIN™, which have been conducted by Bharat Biotech in India, will be accepted by the FDA or otherwise sufficient to support our EUA or IND submissions, as applicable; whether the FDA will accept our IND submissions without any changes, or if we are required to submit additional information to the FDA in support of our IND submissions, the extent and significance of any such changes; the size, scope, timing, and outcome of any additional trials or studies that we may be required to conduct to support an EUA or BLA for COVAXIN™; any additional CMC information that we may be required to submit to the FDA; whether and when a BLA for COVAXIN™ will be submitted to or approved by the FDA; whether developments with respect to the COVID-19 pandemic will affect the regulatory pathway available for vaccines in the United States, Canada, or other jurisdictions; market demand for COVAXIN™ in the United States or Canada; decisions by the FDA or Health Canada impacting labeling, manufacturing processes, safety and/or other matters that could affect the availability or commercial potential of COVAXIN™ in the United States or Canada, including development of products or therapies by other companies. These and other risks and uncertainties are more fully described in our periodic filings with the Securities and Exchange Commission (SEC), including the risk factors described in the section entitled “Risk Factors” in the quarterly and annual reports that we file with the SEC. Any forward-looking statements that we make in this press release speak only as of the date of this press release. Except as required by law, we assume no obligation to update forward-looking statements contained in this press release whether as a result of new information, future events or otherwise, after the date of this press release.

Ocugen Contact:
Ken Inchausti
Head, Investor Relations & Communications
+1 484 237 3398
ken.inchausti@ocugen.com

Please submit investor-related inquiries to: IR@ocugen.com

(tables to follow)

OCUGEN, INC.

CONSOLIDATED BALANCE SHEETS

(in thousands)

(Unaudited)

  September 30, 2021   December 31, 2020
Assets      
Current assets      
Cash and cash equivalents $ 107,349     $ 24,039  
Advance for COVAXIN supply 4,988      
Prepaid expenses and other current assets 1,113     1,839  
Total current assets 113,450     25,878  
Property and equipment, net 1,052     633  
Restricted cash 151     151  
Other assets 1,659     714  
Total assets $ 116,312     $ 27,376  
Liabilities and stockholders’ equity      
Current liabilities      
Accounts payable $ 2,095     $ 395  
Accrued expenses and other current liabilities 3,962     2,941  
Short-term debt, net     234  
Operating lease obligation 172     44  
Total current liabilities 6,229     3,614  
Non-current liabilities      
Operating lease obligation, less current portion 1,280     389  
Long term debt, net 1,693     1,823  
Total liabilities 9,202     5,826  
Stockholders’ equity      
Convertible preferred stock 1      
Common stock 1,990     1,841  
Treasury stock (48 )   (48 )
Additional paid-in capital 222,253     93,059  
Accumulated deficit (117,086 )   (73,302 )
Total stockholders’ equity 107,110     21,550  
Total liabilities and stockholders’ equity $ 116,312     $ 27,376  


OCUGEN, INC.

CONSOLIDATED STATEMENTS OF OPERATIONS

(in thousands, except share and per share amounts)

(Unaudited)

  Three months ended September 30,   Nine months ended September 30,
  2021   2020   2021   2020
Revenues              
Collaboration revenue $       $             43    
Total revenues                   43    
Operating expenses              
Research and development 6,281       1,478       28,006       4,760    
In-process research and development       7,000             7,000    
General and administrative 4,508       1,704       15,450       5,760    
Total operating expenses 10,789       10,182       43,456       17,520    
Loss from operations (10,789 )     (10,182 )     (43,456 )     (17,477 )  
Other income (expense)              
Interest income 5             15          
Interest expense (19 )     (292 )     (59 )     (555 )  
Other income (expense) (4 )           (336 )        
Total other income (expense) (18 )     (292 )     (380 )     (555 )  
Loss before income taxes (10,807 )     (10,474 )     (43,836 )     (18,032 )  
Income tax benefit (52 )           (52 )        
Net loss and comprehensive loss $ (10,755 )     $ (10,474 )     $ (43,784 )     $ (18,032 )  
Deemed dividend related to Warrant Exchange                   (12,546 )  
Net loss to common stockholders $ (10,755 )     $ (10,474 )     $ (43,784 )     $ (30,578 )  
               
Shares used in calculating net loss per common share — basic and diluted 198,790,980       141,591,218       193,599,525       92,764,157    
Net loss per share of common stock — basic and diluted $ (0.05 )     $ (0.07 )     $ (0.23 )     $ (0.33 )  


Release – Endeavour Silver Reports Financial Results for the Third Quarter 2021


Endeavour Silver Reports Financial Results for the Third Quarter 2021; Earnings Conference Call at 10am PST (1pm EST) Today


VANCOUVER, British Columbia, Nov. 09, 2021 (GLOBE NEWSWIRE) — Endeavour Silver Corp. (NYSE: EXK; TSX: EDR) released its financial results today for the three and nine months ended September 30, 2021. The Company operates two silver-gold mines in Mexico: the Guanaceví mine in Durango state and the Bolañitos mine in Guanajuato state and has recently suspended operations at the El Compas mine in Zacatecas state. All amounts reported are in United States (US) dollars.

Dan Dickson, CEO, commented, “Since our Q2 reporting, our operating costs have decreased to levels that are closer to our 2021 guidance. We continued to withhold metals sales in Q3, which has dampened our financial performance and Q3 earnings. At quarter end, we held over 1 million ounces of silver and 1,200 ounces of gold bullion. We expect to sell this inventory in the coming months, which will ensure a strong finish to the year.”

“As of the beginning of November, approximately 90% of our workforce is fully or partially vaccinated. Our operations are running at steady state and we are pleased with the overall performance. Our focus is also on our growth plan, and we have expanded our project development team and commenced preparations for construction at Terronera.”

2021 Third Quarter Highlights

  • Metal Production: 1,305,399 ounces (oz) of silver and 10,541 oz of gold for 2.1 million oz silver equivalent (AgEq) at an 80:1 silver:gold ratio, totaling 6.1 million AgEq oz for the 9 months ended September 30, 2021.
  • Net Revenue: $34.6 million from the sale of 699,539 oz silver and 9,925 oz gold at average realized prices of $24.56 per oz silver and $1,791 per oz gold. Management withheld metal sales during the quarter and continues to carry higher metal inventory totaling 1,030,304 oz silver and 1,211 oz gold of bullion inventory and 37,100 oz silver and 2,028 oz gold in concentrate inventory.
  • Operating Costs: Cash costs(1) of $8.16 per oz payable silver and all-in sustaining costs (AISC)(1) of $17.46 per oz payable silver, net of gold credits.
  • Cash Flow: $7.7 million in cash flow from operations before working capital changes. The Company continued to hold significant finished goods, increased deposits for equipment purchases, invested in exploration activities and advanced the Terronera project.
  • Earnings: Realized loss of $4.5 million or $0.03 loss per share. The loss is due to the fact that the finished goods inventory was carried at a cost of $18.3 million compared to the estimated fair market value of $29.2 million at quarter end.
  • Strong Balance Sheet: Cash position of $101.1 million and working capital $128.7 million. Cash decreased this quarter, as funds were spent to acquire the $10 million Bruner Gold Project and to prepare for construction at Terronera including advancing initial earthworks, site clearing, temporary camp and ordering of long lead items. Withheld sales also impacted the cash balance at quarter end.
  • Acquired the Bruner Gold Project: A strategic acquisition for an advanced stage exploration property in Nevada, a favorable jurisdiction. The transaction closed on August 31, 2021 for $10.0 million in cash.
  • Suspended Operations at El Compas: Management is currently evaluating its alternatives for the assets, with temporary closure estimated to cost $0.3 million in Q4, 2021.

(1)   Mine operating cash flow, cash costs and all-in sustaining costs are non-IFRS measures. Please refer to the definitions in the Company’s Management Discussion & Analysis.

Financial Overview (Consolidated Statement of Operations Appended Below)

For the three months ended September 30, 2021, the Company generated net revenue of $34.6 million a decrease of 3% compared to $35.6 million in the same period in 2020 due to withholding metal sales during the quarter, which significantly increased finished goods inventory. Earnings and financial metrics including mine operating cash flows, operating cash flows and EBITDA were also impacted by the increased holding of production inventory.

Gross sales of $35.0 million in Q3, 2021 represented a 3% decrease over the $36.1 million for the same period in 2020.

There was a 6% decrease in silver ounces sold and a 2% decrease in the realized silver price resulting in an 8% decrease to silver sales. There was a 10% increase in gold ounces with an 8% decrease in the realized gold price resulting in a 2% increase in gold sales. During the period, the Company sold 699,539 oz silver and 9,925 oz gold, for realized prices of $24.56 and $1,791 per oz, respectively, compared to sales of 741,262 oz silver and 8,997 oz gold, for realized prices of $25.08 and $1,952 per oz, respectively, in the same period of 2020. For the three months ended September 30, 2021, silver and gold spot prices averaged $24.36 and $1,790 respectively.

The Company significantly increased its finished goods silver and gold inventory to 1,067,404 oz and 3,239 oz, respectively at September 30, 2021 compared to 459,659 oz silver and 2,835 oz gold at June 30, 2021. The cost allocated to these finished goods was $18.3 million at September 30, 2021, compared to $10.1 million at June 30, 2021. At September 30, 2021, the finished goods inventory estimated fair market value was $29.2 million, compared to $17.3 million at June 30, 2021.

After cost of sales of $26.3 million (Q3, 2020 – $29.3 million), mine operating earnings amounted to a $8.3 million (Q3, 2020 –$6.3 million) from mining and milling operations in Mexico. The decrease in cost of sales was primarily related to the 6% decrease in silver ounces sold offset by higher royalty costs, labour costs and additional costs attributed to global supply constraints. Royalties increased 33% from $2.0 million to $2.7 million due to higher production and realized prices and the increased mining of the high grade Porvenir Cuatro extensions at the Guanaceví operation, which are subject to the higher royalty rates.

Excluding depreciation and depletion of $4.8 million (Q3, 2020 – $8.1 million) and stock-based compensation of $0.1 million (Q3, 2020- $0.1 million) mine operating cash flow before taxes was $13.2 million in Q3, 2021 (Q3, 2020 – $15.1 million) with Q3, 2020 also including a write-down of inventory of $0.6 million. Operating earnings were $3.0 million (Q3, 2020 –$0.4 million) after exploration and evaluation expenditures of $4.7 million (Q3, 2020 – $1.7 million), general and administrative expense recovery of $0.5 million (Q3, 2020 – expense of $3.7 million), severance costs of $0.7 million (Q3, 2020 – $Nil) and care and maintenance costs of $0.4 million (Q3, 2020 – $.6 million). The general and administrative expense recovery was primarily due to mark-to-market fluctuations for director’s cash settled deferred share units, with a $2.8 million recovery in Q3 2021 versus a $1.5 million expense in Q3, 2020.

Net loss was $4.5 million ($0.03 loss per share) compared to net earnings of $0.5 million (loss of $0.00 per share) in Q3, 2020. Compared to Q3, 2020, the Company increased its investment in exploration and evaluation activities by $3.4 million, experienced a $1.2 million loss in foreign exchange and incurred a $3.0 million unrealized loss on marketable securities.

Current income tax expense increased to $0.7 million (Q32 2020 – $0.6 million) due to increased profitability impacting special mining duty, while deferred income tax expense of $3.0 million was recognized due to the estimated use of loss carry forwards to reduce taxable income primarily at Guanacevi (Q3 2020 – $0.6 million).

Direct operating costs per tonne in Q3, 2021 increased 15%, to $115.57 compared with Q3, 2020 due to higher operating costs at all operations. The operations have seen a strengthening of the Mexican Peso, increased labour costs and, increased third party ore purchased Guanaceví compared to prior year and budgeted. Including royalties and special mining duty, direct costs per tonne increased 16% to $130.38. Royalties increased 33% to $2.7 million as increased production from the El Curso and El Porvenir concessions at Guanaceví with higher prices substantially increasing the royalty expense. The improved profitability increased special mining duty expense to $0.6 million for Q3, 2021 compared to $0.4 million for Q3, 2020.

Consolidated cash costs per ounce, net of by-product credits (a non-IFRS measure and a standard of the Silver Institute) increased to $8.16 due to the increased direct costs per tonne. All-in sustaining costs per ounce (also a non-IFRS measure) remained relatively flat at $17.46. In Q3, 2021 corporate general and administrative included a $2.8 million mark-to-market expense recovery for deferred share units whereas the mark to market expense was $1.5 million in Q3, 2020.

The Condensed Consolidated Interim Financial Statements and Management’s Discussion & Analysis can be viewed on the Company’s website at www.edrsilver.com, on SEDAR at www.sedar.com and EDGAR at www.sec.gov.

Conference Call

A conference call to discuss these results will be held today, Tuesday, November 9 at 10am PST (1pm EST). To participate in the conference call, please dial the numbers below. No passcode is necessary.

Toll-free in Canada and the US: 1-800-319-4610
Local Vancouver: 604-638-5340
Outside of Canada and the US: +-604-638-5340
        
A replay of the conference call will be available by dialing 1-800-319-6413 in Canada and the US (toll-free) or +604-638-9010 outside of Canada and the US. The required passcode is 7870 #. The replay will also be available on the Company’s website at www.edrsilver.com.

About Endeavour Silver – Endeavour Silver Corp. is a mid-tier precious metals mining company that owns three and operates two high-grade, underground, silver-gold mines in Mexico. Endeavour is currently advancing the Terronera mine project towards a development decision, pending financing and final permits and exploring its portfolio of exploration and development projects in Mexico, Chile and the United States to facilitate its goal to become a premier senior silver producer.  Our philosophy of corporate social integrity creates value for all stakeholders.

SOURCE Endeavour Silver Corp.

Contact Information:
Galina Meleger, Vice President, Investor Relations
Toll free: (877) 685-9775
Tel: (604) 640-4804
Email: gmeleger@edrsilver.com  
Website: www.edrsilver.com

Follow Endeavour Silver on FacebookTwitterInstagram and LinkedIn

Cautionary Note Regarding Forward-Looking Statements

This news release contains “forward-looking statements” within the meaning of the United States private securities litigation reform act of 1995 and “forward-looking information” within the meaning of applicable Canadian securities legislation. Such forward-looking statements and information herein include but are not limited to statements regarding Endeavour’s anticipated performance in 2021 including changes in mining operations and production levels, the timing and results of various activities and the impact of the COVID 19 pandemic on operations. The Company does not intend to and does not assume any obligation to update such forward-looking statements or information, other than as required by applicable law.

Forward-looking statements or information involve known and unknown risks, uncertainties and other factors that may cause the actual results, level of activity, production levels, performance or achievements of Endeavour and its operations to be materially different from those expressed or implied by such statements. Such factors include but are not limited to the ultimate impact of the COVID 19 pandemic on operations and results, changes in production and costs guidance, national and local governments, legislation, taxation, controls, regulations and political or economic developments in Canada and Mexico; financial risks due to precious metals prices, operating or technical difficulties in mineral exploration, development and mining activities; risks and hazards of mineral exploration, development and mining; the speculative nature of mineral exploration and development, risks in obtaining necessary licenses and permits, and challenges to the Company’s title to properties; as well as those factors described in the section “risk factors” contained in the Company’s most recent form 40F/Annual Information Form filed with the S.E.C. and Canadian securities regulatory authorities.

Forward-looking statements are based on assumptions management believes to be reasonable, including but not limited to: the continued operation of the Company’s mining operations, no material adverse change in the market price of commodities, mining operations will operate and the mining products will be completed in accordance with management’s expectations and achieve their stated production outcomes, and such other assumptions and factors as set out herein. Although the Company has attempted to identify important factors that could cause actual results to differ materially from those contained in forward-looking statements or information, there may be other factors that cause results to be materially different from those anticipated, described, estimated, assessed or intended. There can be no assurance that any forward-looking statements or information will prove to be accurate as actual results and future events could differ materially from those anticipated in such statements or information. Accordingly, readers should not place undue reliance on forward-looking statements or information.


ENDEAVOUR SILVER CORP.
COMPARATIVE HIGHLIGHTS

Three Months Ended September 30 Q3 2021 Highlights
Nine Months Ended September 30
2021 2020 % Change 2021 2020 % Change
Production
1,305,399 942,274 39% Silver ounces produced 3,427,223 2,396,478 43%
10,541 10,260 3% Gold ounces produced 32,816 24,553 34%
1,295,126 932,837 39% Payable silver ounces produced 3,394,103 2,373,246 43%
10,328 10,041 3% Payable gold ounces produced 32,177 24,078 34%
2,148,679 1,763,074 22% Silver equivalent ounces produced 6,052,503 4,360,718 39%
8.16 3.69 121% Cash costs per silver ounce 9.59 4.95 94%
13.14 13.53 (3%) Total production costs per ounce 15.84 13.74 15%
17.46 17.48 (0%) All-in sustaining costs per ounce 20.70 17.16 21%
222,461 206,324 8% Processed tonnes 673,932 519,771 30%
115.57 100.36 15% Direct operating costs per tonne 116.14 99.39 17%
130.38 112.37 16% Direct costs per tonne 133.12 107.68 24%
13.98 13.32 5% Silver co-product cash costs 15.86 11.91 33%
1,020 1,037 (2%) Gold co-product cash costs 1,078 1,117 (4%)
Financial
34.6 35.6 (3%) Revenue ($ millions) 116.8 77.7 50%
699,539 741,262 (6%) Silver ounces sold 2,443,184 2,041,601 20%
9,925 8,997 10% Gold ounces sold 30,398 21,669 40%
24.56 25.08 (2%) Realized silver price per ounce 26.26 19.40 35%
1,791 1,952 (8%) Realized gold price per ounce 1,784 1,820 (2%)
(4.5) 0.5 (1,093%) Net earnings (loss) ($ millions) 14.4 (18.8) 177%
(4.5) 0.5 (1,093%) Adjusted net earnings (loss) ($ millions) (8.2) (18.8) 56%
8.3 6.3 (32%) Mine operating earnings (loss) ($ millions) 24.1 6.5 270%
13.2 15.1 (13%) Mine operating cash flow ($ millions) 43.7 27.1 62%
7.7 10.3 (26%) Operating cash flow before working capital changes 21.6 7.2 (199%)
4.4 10.6 (59%) Earnings before ITDA ($ millions) 44.2 5.1 (763%)
128.7 53.8 139% Working capital ($ millions) 128.7 53.8 139%
Shareholders
(0.03) 0.00 (300%) Earnings (loss) per share – basic 0.09 (0.13) 169%
(0.03) 0.00 (1,011%) Adjusted earnings (loss) per share – basic (0.05) (0.13) 61%
0.04 0.07 (32%) Operating cash flow before working capital changes per share(9) 0.13 0.05 168%
170,432,326 156,265,280 9% Weighted average shares outstanding 166,201,727 148,673,768 12%

The above highlights are key measures used by management, however they should not be the sole measures used in determining the performance of the Company’s operations. The related definitions and reconciliations are contained in the Management Discussion and Analysis.


ENDEAVOUR SILVER CORP.
CONDENSED CONSOLIDATED INTERIM STATEMENT OF CASH FLOWS
(expressed in thousands in U.S. dollars)
                 
    Three months ended   Nine months ended
    September 30, September 30, September 30, September 30,
    2021   2020   2021   2020
                 
Operating activities                
Net earnings (loss) for the period   $ (4,479 )   $ 451     $ 14,426     $ (18,764 )
                 
Items not affecting cash:                
Share-based compensation     725       793       2,918       2,386  
Depreciation, depletion and amortization     4,980       8,296       19,327       18,777  
Impairment reversal of non-current assets                 (16,791 )      
Deferred income tax expense (recovery)     3,017       556       7,260       1,906  
Unrealized foreign exchange loss (gain)     140       (779 )   87       (265 )
Finance costs     195       377       702       1,025  
Write down of inventory to net realizable value           639       272       2,167  
Loss (gain) on asset disposal           27       (5,807 )     162  
Loss (gain) on other investments     3,077       (76 )     (835 )     (190 )
Net changes in non-cash working capital     (7,808 )     5,288       (16,168 )     5,110  
Cash from (used in) operating activities     (153 )     15,572       5,391       12,314  
                 
                 
Investing activities                
Proceeds on disposal of property, plant and equipment           50       7,541       150  
Mineral property, plant and equipment expenditures     (23,373 )     (8,561 )     (38,807 )     (18,945 )
Purchase of marketable securities                 (832 )      
Proceeds from disposal of marketable securities                 9,288        
Redemption of (investment in) non-current deposits     1                    
Cash from (used in) investing activities     (23,372 )     (8,511 )     (22,810 )     (18,795 )
                 
                 
Financing activities                
Repayment of loans payable     (843 )     (847 )     (2,730 )     (2,173 )
Repayment of lease liabilities     (46 )     (45 )     (131 )     (137 )
Interest paid     (159 )     (235 )     (526 )     (696 )
Public equity offerings     864       2,179       59,998       26,367  
Exercise of options           5,569       4,583       5,589  
Share issuance costs     (27 )     (96 )     (1,293 )     (1,133 )
Performance share unit redemption     (189 )           (2,363 )      
Cash from (used in) financing activities     (400 )     6,525       57,538       27,817  
                 
Effect of exchange rate change on cash and cash equivalents   (190 )     833       (126 )     213  
                 
Increase (decrease) in cash and cash equivalents     (23,925 )     13,586       40,119       21,336  
Cash and cash equivalents, beginning of the period     125,191       30,498       61,083       23,368  
Cash and cash equivalents, end of the period   $ 101,076     $ 44,917     $ 101,076     $ 44,917  

This statement should be read in conjunction with the condensed consolidated interim financial statements for the period ended September 30, 2021 and the related notes contained therein.


ENDEAVOUR SILVER CORP.
CONDENSED CONSOLIDATED INTERIM STATEMENT OF COMPREHENSIVE INCOME (LOSS)
(expressed in thousands in U.S. dollars, except for share and per share amounts)
 
    Three months ended Nine months ended
    September 30,   September 30, September 30,   September 30,
    2021   2020 2021   2020
               
Revenue   $ 34,562     $ 35,586 $ 116,803     $ 77,714  
               
Cost of sales:              
Direct production costs     18,639       18,418   63,590       46,940  
Royalties     2,698       2,029   9,498       3,720  
Share-based payments     105       87   334       270  
Depreciation, depletion and amortization     4,843       8,122   18,963       18,096  
Write down of inventory to net realizable value           639   272       2,167  
      26,285       29,295   92,657       71,193  
               
Mine operating earnings     8,277       6,291   24,146       6,521  
               
Expenses:              
Exploration and evaluation     4,660       1,670   13,815       5,717  
General and administrative     (522 )     3,695   7,294       8,837  
Care and maintenance costs     364       533   940       4,789  
Severance costs     737         737        
Impairment reversal of non-current assets             (16,791 )    
      5,239       5,898   5,995       19,343  
               
Operating earnings (loss)     3,038       393   18,151       (12,822 )
               
Finance costs     195       359   702       1,025  
               
Other income (expense):              
Foreign exchange     (1,184 )     890   (1,219 )     (3,287 )
Gain on asset disposals             5,841        
Investment and other     (2,462 )     678   2,091       1,332  
      (3,646 )     1,568   6,713       (1,955 )
               
Earnings (loss) before income taxes     (803 )     1,602   24,162       (15,802 )
               
Income tax expense (recovery):              
Current income tax expense     659       595   2,476       1,056  
Deferred income tax expense (recovery)     3,017       556   7,260       1,906  
      3,676       1,151   9,736       2,962  
               
Net earnings (loss) and comprehensive earnings (loss) for the period   (4,479 )     451   14,426       (18,764 )
               
Basic earnings (loss) per share based on net earnings (loss)   $ (0.03 )   $ 0.00 $ 0.09     $ (0.13 )
Diluted earnings (loss) per share based on net earnings (loss) $ (0.03 )   $ 0.00 $ 0.09     $ (0.13 )
               
Basic weighted average number of shares outstanding     170,432,326       156,265,280   166,201,727       148,673,768  
Diluted weighted average number of shares outstanding     173,689,576       156,265,280   169,628,783       148,673,768  

This statement should be read in conjunction with the condensed consolidated interim financial statements for the period ended September 30, 2021 and the related notes contained therein.


ENDEAVOUR SILVER CORP.
CONDENSED CONSOLIDATED INTERIM STATEMENT OF FINANCIAL POSITION
(expressed in thousands in U.S. dollars, except for share and per share amounts)
         
         
    September 30,   December 31,
    2021   2020
         
ASSETS        
         
Current assets        
Cash and cash equivalents   $ 101,076     $ 61,083  
Other investments     7,047       4,767  
Accounts and other receivable     17,290       20,144  
Income tax receivable     67       52  
Inventories     30,504       16,640  
Prepaid expenses     5,114       2,284  
Total current assets     161,098       104,970  
         
Deposits     591       591  
Deferred financing costs           294  
Income tax recoverable     3,570        
IVA receivable     2,879       2,676  
Deferred income tax asset     5,493       12,753  
Intangible assets     138       492  
Right-of-use leased assets     711       861  
Mineral properties, plant and equipment     108,133       87,955  
Total assets   $ 282,613     $ 210,592  
         
LIABILITIES AND SHAREHOLDERS’ EQUITY        
         
Current liabilities        
Accounts payable and accrued liabilities   $ 25,950     $ 27,764  
Income taxes payable     3,146       3,038  
Loans payable     3,131       3,578  
Lease liabilities     200       173  
Total current liabilities     32,427       34,553  
         
Loans payable     3,801       6,094  
Lease liabilities     848       921  
Provision for reclamation and rehabilitation     7,433       8,876  
Deferred income tax liability     1,080       1,077  
Total liabilities     45,589       51,521  
         
Shareholders’ equity        
Common shares, unlimited shares authorized, no par value, issued        
and outstanding 170,461,307 shares (Dec 31, 2020 – 157,924,708 shares)   585,211       517,711  
Contributed surplus     5,689       9,662  
Retained earnings (deficit)     (353,876 )     (368,302 )
Total shareholders’ equity     237,024       159,071  
Total liabilities and shareholders’ equity   $ 282,613     $ 210,592  
         

This statement should be read in conjunction with the condensed consolidated interim financial statements for the period ended September 30, 2021 and the related notes contained therein.

Source: Endeavour Silver Corporation

Release – Voyager Digital Schedules FYQ1 2022 Results and Business Update Conference Call


Voyager Digital Schedules FYQ1 2022 Results and Business Update Conference Call


Conference call scheduled for November 16 at 8:00 a.m. ET

Voyager Digital Ltd. (“Voyager” or the “Company”) (TSX: VOYG) (OTCQX: VYGVF) (FRA: UCD2), one of the fastest-growing, publicly traded cryptocurrency platforms in the United States, today announced that it will host a live webcast and conference call at 8:00 a.m. Eastern Time on Tuesday, November 16 to discuss financial results for the fiscal first quarter 2022 ended September 30, 2021.

To access the webcast, please register by clicking here.

A live webcast and a replay will be available on the Investor Relations section of the Company’s website at investvoyager.com/investorrelations/events.


About Voyager Digital Ltd.

Voyager Digital Ltd. (TSX: VOYG; OTCQX: VYGVF; FRA: UCD2) is a fast-growing, publicly traded cryptocurrency platform in the United States founded in 2018 to bring choice, transparency, and cost efficiency to the marketplace. Voyager offers a secure way to trade over 60 different crypto assets using its easy-to-use mobile application, and earn rewards up to 12 percent annually on more than 30 cryptocurrencies. Through its subsidiary Coinify ApS, Voyager provides crypto payment solutions for both consumers and merchants around the globe. To learn more about the company, please visit https://www.investvoyager.com.

The TSX has not approved or disapproved of the information contained herein.

SOURCE Voyager Digital, Ltd.


Press Contacts

Voyager Digital Ltd.
Michael Legg
Chief Communications Officer
(212) 547-8807
mlegg@investvoyager.com

Voyager Public Relations Team
pr@investvoyager.com

FenixOro Gold (FDVXF) – Drilling Activity Expected to Accelerate into 2022

Tuesday, November 09, 2021

FenixOro Gold (FDVXF)
Drilling Activity Expected to Accelerate into 2022

FenixOro Gold Corp is a Toronto based company acquiring and exploring high grade gold projects in Colombia. The company’s flagship Abriaqui Project is the nearest exploration project to Continental Gold’s Buritica Mine.

Mark Reichman, Senior Research Analyst of Natural Resources, Noble Capital Markets, Inc.

Refer to the full report for the price target, fundamental analysis, and rating.

    Private placement. FenixOro expects to raise gross proceeds in the amount of C$3,000,000 with the private placement of units priced at C$0.31 per unit and consisting of one common share and one whole common share purchase warrant. For a period of two years from the date of issuance, each warrant is exercisable at a price of C$0.34 for one common share. All securities issued are subject to a hold period of four months and one day. Closing is expected to be completed on or about November 15, 2021. In our view, the placement is priced on favorable terms considering the full purchase warrant.

    Momentum building.  Financially, both the company’s August 2021 quarter expenses and the sizing and terms of the private placement terms were in line with previous assumptions. The company will use the net proceeds to expand and accelerate its Phase 2 drilling program at the Abriaqui gold project by adding one or two drill rigs, identifying and drilling new discovery targets, and accelerating …


This Company Sponsored Research is provided by Noble Capital Markets, Inc., a FINRA and S.E.C. registered broker-dealer (B/D).

*Analyst certification and important disclosures included in the full report. NOTE: investment decisions should not be based upon the content of this research summary.  Proper due diligence is required before making any investment decision. 

CoreCivic, Inc. (CXW) – A Debt Paydown Machine

Tuesday, November 09, 2021

CoreCivic, Inc. (CXW)
A Debt Paydown Machine

CoreCivic is a diversified government solutions company with the scale and experience needed to solve tough government challenges in flexible, cost-effective ways. We provide a broad range of solutions to government partners that serve the public good through corrections and detention management, a growing network of residential reentry centers to help address America’s recidivism crisis, and government real estate solutions. We are a publicly traded real estate investment trust and the nation’s largest owner of partnership correctional, detention and residential reentry facilities. We also believe we are the largest private owner of real estate used by U.S. government agencies. The Company has been a flexible and dependable partner for government for more than 35 years. Our employees are driven by a deep sense of service, high standards of professionalism and a responsibility to help government better the public good.

Joe Gomes, Senior Research Analyst, Noble Capital Markets, Inc.

Joshua Zoepfel, Research Associate, Noble Capital Markets, Inc.

Refer to the full report for the price target, fundamental analysis, and rating.

    Hits Leverage Ratio Early. At quarter’s end, the leverage ratio was 2.7x, at the top end of the Company’s 2.25-2.75x goal, down from 3.2x at the end of 2Q21 and down from 4.0x at the end of 3Q20. The target was achieved roughly nine months sooner than we had expected highlighting not only management’s focus on reducing net debt, but the overall resiliency of the business model.

    Debt Reduction.  CoreCivic repaid $187.5 million of debt in 3Q21, net of the change in cash, including fully paying off its revolving credit facility, which remains undrawn. Subsequent to quarter’s end, the Company paid down $90 million, or 40%, of its Term B loan using cash on hand. CoreCivic ended the quarter with $455.5 million of cash …


This Company Sponsored Research is provided by Noble Capital Markets, Inc., a FINRA and S.E.C. registered broker-dealer (B/D).

*Analyst certification and important disclosures included in the full report. NOTE: investment decisions should not be based upon the content of this research summary.  Proper due diligence is required before making any investment decision. 

The GEO Group Inc. (GEO) – 10-Q Review

Tuesday, November 09, 2021

The GEO Group, Inc. (GEO)
10-Q Review

With over 94,000 beds owned, leased or managed across its business lines and serving over 260,000 people daily, GEO is a leading provider of mission critical real estate to its governmental partners. The Company is the first fully integrated equity REIT specializing in the design, financing, development, and operation of secure facilities, processing centers, and community reentry centers in the U.S., Australia, South Africa, and the U.K.

Joe Gomes, Senior Research Analyst, Noble Capital Markets, Inc.

Joshua Zoepfel, Research Associate, Noble Capital Markets, Inc.

Refer to the full report for the price target, fundamental analysis, and rating.

    10-Q Overview. We were able to perform a deep dive into The GEO Group’s 10-Q which was released November 5th. And while nothing in the 10-Q changes our assessment of GEO and its business prospects, the 10-Q does provide some enhanced details we want to share.

    Populations The surge at the Southwest border and re-opening of the U.S.  Court system, which we have detailed in previous reports, are positively impacting results. Aggregate net increases in populations, transportation services and/or rates contributed an incremental $18.8 million of revenue primarily due to increased occupancies at the USMS and ICE facilities mainly due to the large increase in …


This Company Sponsored Research is provided by Noble Capital Markets, Inc., a FINRA and S.E.C. registered broker-dealer (B/D).

*Analyst certification and important disclosures included in the full report. NOTE: investment decisions should not be based upon the content of this research summary.  Proper due diligence is required before making any investment decision. 

SPACtrac Report – Capstar Special Acquisition Corp: Ready To Address An Unmet Need

Published: Tuesday, November 9, 2021

Capstar Special Acquisition Corp: Ready To Address An Unmet Need

Gregory Aurand, Senior Research Analyst, Healthcare Services & Medical Devices, Noble Capital Markets, Inc.

Refer to end of report for Analyst Certification & Disclosures

The Acquisition. Gelesis, Inc. will be brought public when they merge with publicly traded Capstar Special Acquisition Corp. (CPSR). The deal is expected to close late November or early December with a nearly $1 billion enterprise value transaction.

An approved FDA product targeting a large population. The overweight and obese are at epidemic levels in the U.S. and are a growing crisis globally. Plenity is a novel FDA approved weight management aid that has an addressable market of 150 million in the U.S. alone.

Manufacturing coming on-line for full launch. Gelesis conducted a highly successful beta launch this past year. With lines of manufacturing coming on-line in late 2021 and 2022, the company is prepared to meet initial and future demand with scalable capacity. Given expected demand, the company looks to be EBITDA positive in 2023.

Opportunities globally. The initial focus will be the U.S. market but Plenity also has CE Mark enabling it to be marketed in Europe and other markets. In addition, the company has a strategic partnership to commercialize Plenity in China with potential milestones and royalties. Outside U.S. revenues are expected to contribute 30% of 2023 revenues.

Valuation looks very attractive. At current levels, shares trade about 2.2x Enterprise Value to 2023 guided Revenues, a substantial discount to the Health & Wellness Consumer and DTC peers. If the shares were to trade in-line with the median of its peers, the target value would be $15 per share. As the company is approaching the weight management market in a non-traditional way, a case could be made for an expanded group of comparables that would suggest an even higher current valuation.

Investment Summary

The combination between Gelesis, Inc. and CPSR Gelesis Merger Sub, Inc., a wholly-owned subsidiary of Capstar Special Acquisition Corp. (NYSE:CPSR), a special purpose acquisition company, expected late November or early December, offers tremendous synergies.  Capstar has relationships with influencers to engage consumers and has brand building experience. Gelesis, Inc., a biotherapeutics company, has already obtained FDA clearance for its market-disruptive Plenity weight management product and will subsequently have greater resources and capabilities to fully launch and market Plenity, as well as fund pipeline developments in gastrointestinal (GI) chronic diseases and additional weight loss markets. 

Full launch coming. Plenity has been in beta test launch since last year but will be able to launch when the first full line of new manufacturing capacity comes on-line late 2021.  Capacity expansion is expected in the second and fourth quarters of 2022. 

The planned deal.  Anticipated to consummate late November or early December 2021, Gelesis, Inc. will become a publicly-traded company when the definitive business combination with CPSR Gelesis Merger Sub, Inc. closes.  Capstar Special Acquisition Corp. controls $276 million in trust and will also provide $90 million in PIPE funding from institutional investors. The new combination, with Gelesis as the surviving company, is expected to trade under the ticker “GLS”. CPSR will rename as Gelesis Holdings, Inc. The implied valuation upon closing, based on 131.8 million shares outstanding at $10, is $1,318 million, with an enterprise value of $964 million.

Stock valuation looks very attractive. At current levels, the combined company trades at 2.2x Enterprise Value to guided 2023 Revenues, a considerable discount to Health & Wellness Consumer and DTC comparables as described in the Stock Overview and Valuation section later in this report. Assuming that CPSR shares traded in line with this peer group, the shares would be valued at $15, based upon median (excluding one outlier) EV to 2023 Revenue multiples.  Based on the company’s establishment of consumer-direct marketing, an argument could be made to include a larger group of Disruptive Healthcare and Consumer Subscription comparables. Including this larger group, CPSR could see a higher current valuation.

Investment Highlights

  • Large addressable U.S. market opportunity.  Approximately 150M in the U.S. fall within the addressable market for Plenity. FDA approved for those with Body Mass Index (BMI) scaling from 25 to 40, Plenity has the broadest label of any weight management approach. The Plenity target population is those with BMI ranging from 25-35, considered overweight or slightly obese.
  • FDA cleared product for weight loss with ready to scale manufacturing. FDA clearance for Plenity, a proprietary biomimetic technology prescription product, has already been obtained and, as proof of concept, the company conducted a very successful beta launch.  An initial manufacturing line at 50% capacity is coming online in the fourth quarter, with additional capacity lines expected in Q2 2022 and Q4 2022.  Each full line can produce upward of 160,000 units (a 28-day supply) monthly.
  • Direct-to-patient. Although doctor-prescribed, the company expects to give consumers the option to access the product via a telehealth avenue or with in-person healthcare providers.  Importantly, the company expects to drive awareness and engagement through influence marketing partnerships, as well as patient access telehealth and lifestyle support platforms like Ro and Noom. A contract sales force will also market to practitioners.
  • Low-cost and quick fulfillment.  Prescribed Plenity is delivered to the member patient in about two days at a consumer/patient cost of $98/month, or about $1.75 meal, a substantially less expensive out-of-pocket alternative to other weight loss programs.
  • Pipeline opportunities.  The company has large adjacent market opportunities beyond adult weight loss.  Weight management in adolescents, weight management for people with diabetes or pre-diabetes, Functional Constipation, and Non-alcoholic fatty liver disease (NAFLD) are all in early studies or trials.
  • Solid patent protection. The company has a large patent estate covering composition, method of production and method of use, through at least 2035.


Investment Risks

  • Product real world experience may be different.  Plenity may not be accepted by consumers or may be ineffective. Trial results showed effectiveness, but patients were part of a controlled study that include exercise and a nutritional plan.  Real world experiences may be different.
  • Plenity is an FDA cleared product.  If there are greater side effects than seen in trials, the result might be possible lost revenue or recalled product.
  • Company is in the early days of expanding manufacturing. The company might experience manufacturing delays or hiccups, is not able to scale up manufacturing, or is not able to manufacture at expected cost levels.
  • Marketing and pipeline costs. Marketing the product through different avenues may increase costs or reduce profitability. Developing the pipeline will require greater resources and new funding sources may be needed.
  • Potential competition. Plenity is a novel product with strong patents. However, there is a risk that larger and better funded competitors might enter the weight management market.

Industry Overview

The U.S. weight loss and diet control market is vast and, prior to the Covid-19 pandemic, was estimated at a record $78 billion. Ranging from diet soft drinks and diet foods including frozen entrees, diet books, diet pills, fitness apps and online or home exercise programs, meal replacements and diet plans, commercial diet center chains, and health clubs to medical programs like bariatric surgery and therapeutics, the weight loss and diet market is expected to increase due to an increasing overweight and obese population. In 2016, more than 1.9 billion adults were overweight or obese, with more than a third considered obese. The global and U.S. markets are expected to expand as the number of overweight or obese adults increases (Figures #1 and #2).  

Figure #1 Globally 39% of Adults are Overweight or Obese


Figure #2 Adults Overweight or Obese in the U.S.


Overweight persons, as indicated in Figure #3 below, fall into a BMI range of 25 to 30. Above a 30 BMI, a person is considered obese.  The World Health Organization defines BMI as: “a simple index of weight-for-height that is commonly used to classify underweight, overweight and obesity in adults. It is defined as the weight in kilograms divided by the square of the height in meters (kg/m 2). For example, an adult who weighs 70kg and whose height is 1.75m will have a BMI of 22.9.”

Figure #3 Weight Classification

Source: Hannah Ritchie and Max Roser (2017) – “Obesity”. Published online at OurWorldInData.org. Retrieved from: ‘https://ourworldindata.org/obesity’ [Online Resource]

Over 37% of the U.S. population is considered obese with a BMI index above 30 (Figure #4).  This group, composed of obese and extremely obese, will likely have more co-morbidities like high blood pressure or diabetes, and might seek, in addition to dietary and behavior modification, more expensive and stringent weight loss programs including oral and injectable therapies as well as surgery. However, the downside for more stringent weight loss programs are potential adverse side effects from therapeutics, especially for those with other existing health conditions; hence only about 2% of the population use therapeutics.  Bariatric surgery also can present complications and risk.  Therapeutics and bariatric surgery are also a more expensive option and not viable for those merely overweight and needing to lose fewer pounds. As illustrated in Figure #5, Plenity addresses the needs of the overweight and mildly obese with a weight management aid that is not a drug, has side effects comparable to placebo, is not habit forming and has no duration limitations.

Figure #4 Estimated (Age-Adjusted) Percentage of US Adults with Overweight and Obesity by Sex

Source: 2013–2014 NHANES Data, NIH National Institute of Diabetes and Digestive and Kidney Diseases

Figure #5 Large unmet need

Source:  Company presentation

While the need for weight loss increases due to aging demographics, along with increasing co-morbidities like diabetes, the market is also changing as younger Millennials are expected to surpass the Baby Boomer generation over time. Millennials are much more social media and influencer conscious than the prior generation and perceive brick-and-mortar weight loss centers and gyms as expensive or too structured, and find meal replacements like nutrition bars, low calorie frozen meals, apps, other virtual options and home setups more viable and less expensive. Utilization of online technology like telehealth, apps and streaming services are expected to increase dramatically over time.

The coronavirus pandemic has caused consumers to accelerate their movement away from more traditional brick-and-mortar gyms and weight loss centers. Within the various weight loss management segments in 2020, health clubs and weight loss programs were negatively affected the most as consumers were unable or unwilling to access health centers, clinics and physician offices.  Prescription weight loss medications declined also due to limited access to doctors, clinics and hospitals during the pandemic.

As the following Figure #6 indicates, the pandemic has put a spotlight on weight loss as well as continued access to care.  Americans gained weight during the pandemic and over 50% want to reduce weight. Importantly, partly due to the pandemic as well as changing tastes and greater market acceptance of virtual and digital technologies, over 80% are likely to use telehealth to manage needs after the pandemic ends.

Figure #6 Pandemic Spotlight


Source: Company presentation

It is estimated that 80% of dieters are do-it-yourselfers, going it alone without behavior changes. Regardless, most diets fail, upwards of 95%. Diets typically fail because it’s usually based on deprivation and unnatural eating habits, making normal life difficult long-term.  On average, weight loss diets last four weeks for women and six weeks for men. Unfortunately, dieters subsequently go back to normal eating habits and new weight gain is the result. A more holistic wellness approach, incorporating psychological improvements as well as exercise increase the chances of long-term success. With this knowledge, the approach being taken to commercialize Plenity incorporates a holistic perspective, engaging patients as members to promote long-term satisfaction and results.


Gelesis Company Overview

Gelesis, a biotherapeutics compay was founded in 2006 by Yishai Zohar with PureTech Health (Nasdaq: PRTC; currently 19.2% Gelesis ownership), developing the macromolecular hydrogel and polymer research of co-inventor Alessandro Sannino, the Gelesis Lead Scientist. Gelesis’ focus is to transform weight management using its proprietary technology. Gelesis’ first commercial product, Plenity, is FDA cleared and CE Marked as an aid in weight management in adults with excess weight or obesity, BMI of 25 to 40 when used in conjunction with diet and exercise. Plenity has the broadest BMI range of any prescription weight-management aid to date. Utilizing its platform technology, the company also has potential therapies in development for Type 2 Diabetes, Non-alcoholic Fatty Liver Disease and Non-alcoholic Steatohepatitis (NAFLD/ NASH), and Functional Constipation (Figure #7).  In addition, the company also has a pre-clinical study (GS400) for IBD.

Figure #7 Gelesis pipeline


Source: Company presentation

Plenity works by making you feel more satisfied

The company believes one of the root causes of being overweight or obese is the modern Western diet with larger portions and increased calories.  Plenity is designed to help people manage their weight by feeling satisfied with smaller food portions. It is FDA-cleared for use in adults with a Body Mass Index (BMI) of 25-40 kg/m2  when used as part of a diet and exercise program. The product is a proprietary hydrogel that “mimics” the effect of eating raw vegetables (Figure #8).  It is taken orally as 3 capsules with 16 oz. of water twice a day, 20 minutes before lunch and dinner.  Within minutes of ingestion, the small gel pieces in the capsules expand, increasing volume. The gel pieces absorb water, filling the stomach to ~1/4 of the stomach’s volume. The particles create additional satiety mechanisms between meals and eventually degrade in the large intestine, allowing the water to be re-absorbed as the pieces are eliminated. 


Figure #8 How Plenity Works


Source: Company presentation

Plenity is shown to be efficacious

The GLOW (Gelesis Loss of Weight) study was a 24-week, randomized, double-blind, multi-center trial with 436 overweight or obese patients, with or without type 2 diabetes, in conjunction with prescribed reduced calories and exercise.  The trial co-primary endpoints were: 1) 35% or more of individuals taking Plenity achieved 5% or more weight loss, and 2) placebo-adjusted weight loss assessed as a super-majority margin of 3%, as well as superiority over placebo.  The trial exceeded the first endpoint with 59% of patients losing 5% or greater weight (Figure #9).  While not achieving the second endpoint of super-majority, the trial did achieve superiority over placebo (-6.4% vs. -4.4%, P=0.0007).   Importantly, 26% of adults were considered super-responders to Plenity, losing an average of 14% of their weight (30 lbs.).  In a post-hoc analysis, early weight loss predicted longer term benefit, with a weight loss of 3% or greater as early as after 8 weeks predicting meaningful weight loss at 6 months.

Figure #9 Plenity doubled the chance of 5% or greater weight loss

Source: Company presentation

Side effects are similar to placebo

In the GLOW study, overall adverse events in the Plenity arm was no different than the placebo group (71% in both), and most events were assessed as mild or moderate in both groups. There were no serious adverse events in the Plenity group, but there was one in the placebo group (Figure #10). An important consideration is there are no known interaction issues, nor is Plenity therapy limited to duration.  Consumer/patients can go on for a relatively short period of time or go off therapy temporarily as needed. Plenity is not a drug and is not habit forming.

Figure #10 Strong Safety Profile Similar to Placebo


Source: Company presentation

Full launch coming Q4 2021

Plenity, in its beta test (limited by supply) last year, grew consumer/patient membership to over 48,000, adding approximately 12,000 in only 6 weeks (Figure #11). A key component of the full-scale launch will be the focus on consumer ease, convenience and wellness support, particularly in the current Covid-19 environment.  Plenity’s unique efficacy, safety and tolerability profile allow Gelesis to bring it to market in a very different way. Telehealth, as well other access options like traditional health care interaction, not only focus on the convenience of being prescribed and receiving Plenity (Figure #12) but also keeping the member patient engaged longer-term.


Figure #11 Strong Beta Test Launch


Source: Company presentation

Figure #12 Access is Consumer Focused

Source: Company presentation

 The company developed partnerships (Figure #13) in mail order pharmacy and telehealth to make member patient access easy and, given the high failure rate in regular diets, help achieve improved weight management outcomes.  Ro is a well-recognized patient-centric national telehealth service offering end-to-end health care. The pharmacy GoGoMeds (Specialty Medical Drugstore, LLC) is an accredited and licensed pharmacy in all 50 states and the District of Columbia and currently has an exclusive arrangement to fulfill mail order prescriptions. To expand awareness and create a more holistic wellness approach and to keep members engaged and moving toward their goals, the company has partnerships to offer Plenity through lifestyle support programs like Noom and behavioral weight management programs like WW.  Not only will the member patient have easier access options to Plenity, but they will also be better supported to achieve their weight and wellness goals. 


Figure #13 Partnerships for patient access, awareness and wellness

Source: Company presentation

Commercializing and Marketing Plenity

Since the beta launch, Gelesis has utilized telehealth and social media marketing avenues to drive awareness but was limited by lack of manufacturing capacity from making a strong marketing push to the health care practitioner. With manufacturing capacity expansion, in addition to telehealth and social media, Gelesis has begun working with a contract sales force engaging large practice primary care, targeting 25-35,000 physicians in the U.S. These physicians will be able to directly treat the patient by writing a mail-order prescription or refer the patient to another specialist or telehealth service. 

Prescribed Plenity is delivered to the member patient in about two days at a cost of $98/month, or about $1.75 meal, a substantially less expensive out-of-pocket alternative to other weight loss programs. Not only is pricing transparent and relatively inexpensive for the member patient, practitioners will also find it easy to prescribe as health plan reimbursement is not needed. While potentially health plans may add Plenity to their wellness programs, Gelesis is focused on the cash-pay opportunity.

While the U.S. is the near-term focus, Plenity has CE Mark for commercialization in Europe and other global markets. Importantly, the company strategically partnered with China Medical Systems to commercialize Plenity in China. The partnership will contribute milestones as well as royalties in that market. Expectation is for global revenues to contribute 30% of mix in 2023.

Pipeline

The company believes the method of action underlying the Gelesis technology could be advantageous treating chronic metabolic and inflammation diseases by restoring healthy gut barrier and increase good bacteria.  High-fat diets, especially, may compromise the intestinal barrier. In pre-clinical studies, Gelesis hydrogel showed promise, appearing to restore gut function and the company continues to pursue this method of action.

The company has large adjacent market opportunities beyond adult weight loss (Figure #14). Weight management in adolescents, weight management for people with diabetes or pre-diabetes, Functional Constipation, and Non-alcoholic fatty liver disease (NAFLD) are all in early studies or trials. For weight loss in adolescents, the company is seeking Plenity label expansion and is seeking FDA input and review. The Phase II weight management study for diabetes and pre-diabetes expects data results late 2021. The pilot clinical study in Functional Constipation (formerly known as Chronic Idiopathic Constipation), initiated in 2020, expects top-line results to be available by Q2 2023. Phase II top-line results for NAFLD are expected Q4 2023.

Figure #14 Large addressable U.S. market opportunity pipeline


Source: Company presentation

 Financial Overview

The company has projected to reach EBITDA profitability in 2023 (Figure #15), based on a gross selling price of $98 per monthly (28 day) unit and a net selling price (after partner and other discounts) of $76 monthly, and reaching $442 million in 2023 revenues.  As the company builds and utilizes production capacity, efficiencies should drive gross margin to above 70% from the low 60’s anticipated in 2022. Of the expected revenue generation, 70% are expected U.S. revenues, with 30% international (Figure #16).  Based on an assumption of 6 months patient Rx subscription, each member patient would generate $456 during that time.  Excluding royalties and other sources of revenue from Noom and WW products offered by Gelesis, to reach the U.S. 2023 revenue target, the company would need to engage ~682,000 member patients or ~4.1 million units. To reach the international revenue projection, the company would need to reach ~300,000 patients or ~1.72 million units. The needed member patient numbers would be lower with additional sources of revenue. Of importance, the 2023 total patient engagement is below 0.5% of the eligible market.

Figure #15 EBITDA profitability expected 2023

Source: Company presentation


Figure #16 Projected 2023 revenue based on reaching <0.5% of eligible market

Source: Company presentation

Based on current and projected manufacturing capacity, Gelesis projects each manufacturing line capable of producing 160,000 monthly units.  A 50% capacity line is operational, and a full line at 100% capacity should be online by end of year 2021, with an additional line expected in the second quarter 2022. Based on this coming capacity and adjusting for downtime to convert the 50% line to 100%, the company will be able, by beginning of Q3 2022, to produce more than 400,000 units monthly, or a 4.8 million unit annual run rate at the end of 2022. The company also expects a third new line in Q4 2022, further expanding capability in 2023 to 6.7 million annual units (Figure #17).

Figure #17 Production is expected to meet demand


Source: Company presentation


Anticipating continued demand, Gelesis expects further line additions with an 18-24 month lead time for each line to become operational. For instance, a new line investment initiated in Q3 2022 would be projected to be operational by Q3 2024 or earlier. The company has sufficient expansion capabilities to construct 10 lines, which is 4x greater potential production than expected by the beginning of Q3 2022.


Management Overview

R. Steven Hicks:  A storied executive in media and broadcasting, in 2000 Mr. Hicks founded Capstar Partners, a private investment company with a private and public focus in the Consumer, Healthcare, Media and Hospitality sectors. In 1996, prior to Capstar Partners, where he currently serves as Executive Chairman, he founded Capstar Broadcasting Corporation. After taking Capstar Broadcasting public in 1998, the company was merged with Chancellor Media Corporation, forming AMFM, the nation’s largest operator of radio stations in the United States. He also co-founded SFX Broadcasting in 1993, establishing this company as one of the largest radio broadcasting operations in the United States before leaving in 1996 to build Capstar Broadcasting. Capstar Special Acquisition Corp. was incorporated in 2020, where Mr. Hicks currently serves as Chairman, Chief Executive Officer and Chief Financial Officer. Mr. Hicks received his Bachelor of Arts from the University of Texas at Austin and has served on the Board of the University of Texas Investment Management Company since 2009.

Rodrigo de la Torre: With more than 15 years of experience in multinational organization strategy, finance and business development, Mr. de la Torre currently serves as Lead Director at Capstar Special Acquisition Corp.  Since April 2019, he has been Head of Finance and Strategy at Taco Bell Global, and before that he was Global Director of Finance and Head of M&A at Pizza Hut International, all part of Yum! Brands.  Prior to Yum! Brands, Mr. de la Torre advised on high-profile consumer sector transactions while at Credit Suisse’s Consumer & Retail Investment Banking Group and M&A Strategy at Fonterra Co-operative. He received his Bachelor of Commerce with Honors in Economics and Finance from Victoria University of Wellington in New Zealand and received his Master of Business Administration from the Tuck School of Business at Dartmouth in 2010.

Kathryn Cavanaugh: Ms. Cavanaugh is a Director at Capstar Special Acquisition Corp. and has been, since 2019, Managing Partner at Capstar Ventures GP, LLC, a venture capital firm investing in consumer innovative companies. She has extensive experience in investing in early-stage consumer and retail sector companies, obtained during her tenure as Partner at Grace Beauty Capital. Prior to Grace Beauty Capital, she evaluated equity investments in the MedTech healthcare space at De Novo Ventures. As Senior Process Engineer at Merck & Co., she developed large scale manufacturing.  Ms. Cavanaugh obtained Bachelor of Science degrees in Chemical Engineering and Biochemistry from the University of Notre Dame, and a Master of Business Administration from Harvard Business School.

Clayton Christopher: Currently serving as Special Advisor at Capstar Special Acquisition Corp., Mr. Christopher is the co-founder and advisor to CAVU Venture Partners, an investment firm focused on best-in-class consumer brands. He has extensive consumer experience as 2010 co-founder and CEO at Deep Eddy Vodka, founder of Sweet Leaf Tea in 1998 until acquired by Nestle in 2011 and co-founder of Waterloo Sparkling Water in 2017.

Benjamin Hanson: With extensive healthcare strategic experience, Mr. Hanson serves as Board Advisor to Capstar Special Acquisition Corp.  He co-founded EQ Capital Strategies and is Managing Member, providing advisory services in healthcare, environmental and business service markets. Previous to this, he was Chief Administrative and Strategy Officer for Senior Care Centers, LLC,  and led the corporate development efforts at Harden Healthcare prior to its acquisition by Senior Care Centers, LLC.  Mr. Hanson graduated from the University of Texas at Austin with a double major in Plan II Honors and Government and has his law degree from the Dedman School of Law at Southern Methodist University.

Yishai Zohar: The Founder, Chief Executive Officer, and a member of the Board at Gelesis, Inc., Mr. Zohar has over 25 years’ experience developing healthcare innovation. The co-inventor and developer of PLENITY at Gelesis, Inc., prior to this he was Co-Founder of PureTech Health, leading the obesity/GI therapeutics effort.  Mr. Zohar has a Business Administration degree from the College of Management Academic Studies in Tel Aviv and was a Captain and air force pilot in the Israeli Defense Forces.

Alessandro Sannino: The co-inventor and Lead Project Scientist of the technology behind PLENITY at Gelesis, Inc., Dr. Sannino’s research has focused on macromolecular hydrogels and polymer microstructures.  He is adjunct faculty at MIT and is responsible for the Life Sciences Division of the Puglia District of Technology. An advisor to the NIH and the Italian Ministry of Health. He has published over 100 papers and received his PhD at University of Naples and University of Washington.

David Pass: Dr. Pass is Chief Operating and Commercial Officer at Gelesis, Inc. He has over 20 years experience in therapeutics, focusing on metabolics and diabetes.  Previously, he served as Vice President of Marketing at Boehringer Ingelheim for Diabetes and has extensive experience with Johnson & Johnson and Bristol-Myers Squibb.  Dr. Pass received his B.S. Pharmacy and Doctor of Pharmacy degrees from the Philadelphia College of Pharmacy and Science.

Harry L. Leider: Currently the Chief Medical Officer at Gelesis, Inc., Dr. Leider has over 25 years’ experience in healthcare.  Before joining Gelesis, Inc., Dr. Leider served as Chief Medical Officer and Group Vice President at Walgreens.  Prior to this, he was Chief Medical Officer and Senior Vice President of Ameritox, a specialty lab. He is a past-President and Board Chairman for the American Association of Physician Leadership. He has also been a faculty member of the Harvard Medical School and the Johns Hopkins Carey School of Business. He received his B.A. from Pennsylvania State University, and MD from the University of Pennsylvania, and his MBA from the Foster School of Business at the University of Washington.

Elaine Chiquette: Dr. Chiquette currently serves as Chief Scientific Officer at Gelesis, Inc.  She developed her extensive regulatory strategy experience while at Hoffman La Roche, Amylin Pharmaceuticals, Aegerion, and GI Dynamics. She completed her pharmacy degree at Laval University in Quebec and obtained a Pharm.D at University of Texas Health Science Center at San Antonio.  Her focus and interest has been on cardiometabolic disease therapeutics.

Elliot Maltz: As the Chief Financial Officer at Gelesis, Inc., Mr. Maltz has over 15 years’ experience in corporate finance and accounting with public and private companies, specializing in healthcare and manufacturing. Prior to Gelesis, Mr. Maltz held leadership positions at Deloitte & Touche LLP and Publicis Sapient Corp.  He received his education from Elon University.


Stock Overview and Valuation

As indicated in Figure #18, the common equity PIPE transaction will translate into a 7% ownership of the new company. The PIPE investors include PIMCO, Pritzker Vlock Family Office, Chinese Medical Systems and co-founder PureTech Health. The $276 million held-in-trust provided from Capstar translates into a 20% ownership and Capstar Founders will own 4% of the company.  Gelesis shareholders will end up with approximately 69% of the new company. The newly formed company, as indicated previously, is expected to be listed on the NYSE and trade under the ticker “GLS”.  There will be an estimated 131.8 million shares outstanding following the combination with CPSR. As part of the transaction, there will be 5 million share earn-out increments issued to existing Gelesis shareholders if the stock price reaches $12.50, $15.00, and $17.50 per share over a five-year period following the combination.  

Figure #18 Pro Forma Ownership


Source: Company presentation


Figure #19 provides an extensive list of health and wellness peer comparables.  The valuations provided for CPSR/Gelesis are based on the guided revenues and cash provided.  At current levels, shares trade about 2.2x Enterprise Value to 2023 guided Revenues, a substantial 40% discount to the median Health & Wellness Consumer and DTC peers (excluding INMD outlier). If the shares were to trade in-line with the median of its peers, the target value would be $15 per share.  At the mean, the target value would be $19 per share. As Gelesis is marketing to the weight management market in a very different and disruptive approach, a case could be made for using the expanded group of Disruptive Healthcare and Consumer Subscription comparables that would suggest an even higher current valuation.


Figure #19 Valuation Comparables


GENERAL DISCLAIMERS

All statements or opinions contained herein that include the words “we”, “us”, or “our” are solely the responsibility of Noble Capital Markets, Inc.(“Noble”) and do not necessarily reflect statements or opinions expressed by any person or party affiliated with the company mentioned in this report. Any opinions expressed herein are subject to change without notice. All information provided herein is based on public and non-public information believed to be accurate and reliable, but is not necessarily complete and cannot be guaranteed. No judgment is hereby expressed or should be implied as to the suitability of any security described herein for any specific investor or any specific investment portfolio. The decision to undertake any investment regarding the security mentioned herein should be made by each reader of this publication based on its own appraisal of the implications and risks of such decision.

This publication is intended for information purposes only and shall not constitute an offer to buy/sell or the solicitation of an offer to buy/sell any security mentioned in this report, nor shall there be any sale of the security herein in any state or domicile in which said offer, solicitation or sale would be unlawful prior to registration or qualification under the securities laws of any such state or domicile. This publication and all information, comments, statements or opinions contained or expressed herein are applicable only as of the date of this publication and subject to change without prior notice. Past performance is not indicative of future results.

Noble accepts no liability for loss arising from the use of the material in this report, except that this exclusion of liability does not apply to the extent that such liability arises under specific statutes or regulations applicable to Noble. This report is not to be relied upon as a substitute for the exercising of independent judgement. Noble may have published, and may in the future publish, other research reports that are inconsistent with, and reach different conclusions from, the information provided in this report. Noble is under no obligation to bring to the attention of any recipient of this report, any past or future reports. Investors should only consider this report as single factor in making an investment decision.

IMPORTANT DISCLOSURES

This publication is confidential for the information of the addressee only and may not be reproduced in whole or in part, copies circulated, or discussed to another party, without the written consent of Noble Capital Markets, Inc. (“Noble”). Noble seeks to update its research as appropriate, but may be unable to do so based upon various regulatory constraints. Research reports are not published at regular intervals; publication times and dates are based upon the analyst’s judgement. Noble professionals including traders, salespeople and investment bankers may provide written or oral market commentary, or discuss trading strategies to Noble clients and the Noble proprietary trading desk that reflect opinions that are contrary to the opinions expressed in this research report.

The majority of companies that Noble follows are emerging growth companies. Securities in these companies involve a higher degree of risk and more volatility than the securities of more established companies. The securities discussed in Noble research reports may not be suitable for some investors and as such, investors must take extra care and make their own determination of the appropriateness of an investment based upon risk tolerance, investment objectives and financial status.

Company Specific Disclosures

The following disclosures relate to relationships between Noble and the company (the “Company”) covered by the Noble Research Division and referred to in this research report.

Company Specific Disclosures

The following disclosures relate to relationships between Noble and the company (the “Company”) covered by the Noble Research Division and referred to in this research report.

The SPAC Company in this report is a participant in the Company Sponsored Research Program (CSRP); Noble receives compensation from the Company for such participation. No part of the CSRP compensation was, is, or will be directly or indirectly related to any specific recommendations or views expressed by the analyst in this research report.

Noble is not a market maker in any of the companies mentioned in this report. Noble intends to seek compensation for investment banking services and non-investment banking services (securities and non-securities related) with any or all of the companies mentioned in this report within the next 3 months

WARNING

This report is intended to provide general securities advice, and does not purport to make any recommendation that any securities transaction is appropriate for any recipient particular investment objectives, financial situation or particular needs. Prior to making any investment decision, recipients should assess, or seek advice from their advisors, on whether any relevant part of this report is appropriate to their individual circumstances. If a recipient was referred to Noble Capital Markets, Inc. by an investment advisor, that advisor may receive a benefit in respect of transactions effected on the recipients behalf, details of which will be available on request in regard to a transaction that involves a personalized securities recommendation. Additional risks associated with the security mentioned in this report that might impede achievement of the target can be found in its initial report issued by Noble Capital Markets, Inc.. This report may not be reproduced, distributed or published for any purpose unless authorized by Noble Capital Markets, Inc.

RESEARCH ANALYST CERTIFICATION

Independence Of View
All views expressed in this report accurately reflect my personal views about the subject securities or issuers.

Receipt of Compensation
No part of my compensation was, is, or will be directly or indirectly related to any specific recommendations or views expressed in the public
appearance and/or research report.

Ownership and Material Conflicts of Interest
Neither I nor anybody in my household has a financial interest in the securities of the subject company or any other company mentioned in this report.

NOBLE RATINGS DEFINITIONS % OF SECURITIES COVERED % IB CLIENTS
Outperform: potential return is >15% above the current price 95% 33%
Market Perform: potential return is -15% to 15% of the current price 5% 2%
Underperform: potential return is >15% below the current price 0% 0%

NOTE: On August 20, 2018, Noble Capital Markets, Inc. changed the terminology of its ratings (as shown above) from “Buy” to “Outperform”, from “Hold” to “Market Perform” and from “Sell” to “Underperform.” The percentage relationships, as compared to current price (definitions), have remained the same.

Additional information is available upon request. Any recipient of this report that wishes further information regarding the subject company or the disclosure information mentioned herein, should contact Noble Capital Markets, Inc. by mail or phone.

Noble Capital Markets, Inc.
150 East Palmetto Park Rd., Suite 110
Boca Raton, FL 33432
561-994-1191

Noble Capital Markets, Inc. is a FINRA (Financial Industry Regulatory Authority) registered broker/dealer.
Noble Capital Markets, Inc. is an MSRB (Municipal Securities Rulemaking Board) registered broker/dealer.
Member – SIPC (Securities Investor Protection Corporation)

Report ID: 24170

Release – Sierra Metals Reports Q3 2021 Consolidated Financial Results And Provides Revised Ebitda Guidance For 2021


Sierra Metals Reports Q3 2021 Consolidated Financial Results And Provides Revised Ebitda Guidance For 2021


CONFERENCE CALL NOVEMBER 9, 2021, AT 10:30 AM (EST)

___________________________________________________________________

(All $ figures reported in USD)

  • Revenue from metals payable of $60.7 million in Q3 2021 decreased by 17% from $73.2 million in Q3 2020, largely due to the lower grades at the Yauricocha and Bolivar mines combined with operational challenges at the Cusi mine
  • Adjusted EBITDA(1) of $17.4 million for Q3 2021 decreased by 53% compared to $37.2 million in Q3 2020 due to the decrease in revenues realized
  • Revised EBITDA Guidance for 2021 ($105M-$110M) primarily due to temporary operating restrictions at Bolivar Mine resulting from residual effect of COVID-19. Yauricocha and Cusi Mines are operating at near nameplate capacity levels.
  • Operating cash flows before movements in working capital of $16.5 million in Q3 2021 decreased from $37.9 million in Q3 2020
  • $58.3 million of cash and cash equivalents as at September 30, 2021
  • $38.1 million of working capital as at September 30, 2021
  • A shareholder conference call to be held Tuesday, November 9, 2021, at 10:30 AM (EST)

(1) This is a non-IFRS performance measure, see Non-IFRS Performance Measures section of the MD&A.

TORONTO–(BUSINESS WIRE)– Sierra Metals Inc. (TSX: SMT) (BVL: SMT) (NYSE AMERICAN: SMTS) (“Sierra Metals” or “the Company”) today reported revenue of $60.7 million and adjusted EBITDA of $17.4 million on the throughput of 750,208 tonnes and metal production of 21.9 million copper equivalent pounds, for the quarter ended September 30, 2021.

Consolidated production of copper equivalent pounds decreased 38% to 21.9 million pounds. The Company earned revenues of $60.7 million, Adjusted EBITDA of $17.4 million, and operating cash flows before movements in working capital of $16.5 million. Lower revenues, despite higher base metal prices compared to Q3 2020, are primarily attributable to the decrease in throughput and head grades at our Mexican operations primarily at the Bolivar Mine.

Luis Marchese, CEO of Sierra Metals, commented, “The third quarter was exceptionally difficult for the Company as we encountered sequencing issues at our Mexican operations. The Bolivar Mine has had limitations on mine development, infill drilling, equipment availability over the last year which have heavily impacted throughput, head grades and recoveries.While we believe these issues to be temporary in nature, we are currently conducting a comprehensive review of all operational processes at the Bolivar Mine, from Geology to Mine to Mill. We aim to incorporate the findings into the Bolivar Mine operations to allow for a return to a normal, steady, and profitable state of operations at the Mine. The early findings of this review will be incorporated into the 2022 Bolivar Mine budget, currently being prepared, to provide an updated projection of the Bolivar Mine’s capabilities and operations potential going forward. The Cusi Mine has also experienced operational limitations caused by high temperatures at the available mineable areas, which have been overcome by the installation of a new raise bore and upgraded pumping system. Stronger metal prices have supported revenue. After reviewing the nature of this limitations moving forward, and issued revised production guidance, we felt it was prudent to lower EBITDA and Capex guidance and increase cost guidance for Bolivar to better reflect the expected outcome for 2021.”

He continued, “Looking ahead at the remainder of 2021 and into 2022, we see normal operations at Yauricocha and Cusi. Bolivar still has a backlog of development and infill drilling that will affect its production. This issue is being addressed with additional internal and external resources. Also, we have reinitiated work on a backlog of accumulated sustaining infrastructure projects as well as on exploration from our brownfield drilling programs which are expected to improve the quality and tonnage of our mineral resources.”

He concluded, “The Company despite the challenges faced this year still has a strong balance sheet. We are focused on improving operations and we continue to push for production growth while optimizing operations at all three mines, with cost reductions being a priority. These efforts are expected to benefit all stakeholders in the Company.”

Quarterly revenues at Yauricocha were in line with the third quarter of 2020, as the increase in average realized sale prices and lower treatment and refining costs were offset by lower payable metals, except zinc and silver, as compared to Q3 2020. Operating at an average daily throughput rate of 3,705 tpd, the Yauricocha Mine processed 324,196 tonnes during Q3 2021, representing a 2% increase compared to Q3 2020, despite continuing to face various operational challenges related to COVID-19. The negative variances in the head grades from the polymetallic zones are due to regulatory limitations. The negative variances in the copper sulfide head grades were mainly due to the delay in the contribution of the Esperanza zone due to ground conditions, which have since been corrected. Metal production in the third quarter of 2021 was 25%, 23%, 14% and 13% lower for lead, zinc, copper, and silver, respectively, while gold production was 9% higher compared to the third quarter of 2020

Revenue from the Bolivar mine declined 52% as compared to Q3 2020 as the increase in copper price was not enough to offset the decrease in production attributable to lower throughput and grades. The Bolivar Mine processed 364,941 tonnes in Q3 2021, or a decrease of 11% from the 410,468 tonnes processed in Q3 2020, due to the low availability of equipment, including mining scoops during the quarter. The average daily ore throughput realized during the quarter was approximately 4,171 tpd. Head grades were impacted by a COVID-induced lag on development and infill drilling, which resulted in changes of the mining sequence, as well as dilution issues, which are being corrected.

Revenue from the Cusi mine were 5% lower due to a decline in average realized prices for gold and silver, and higher treatment and refining costs for the quarter as compared to Q3 2020. The Cusi mine processed 61,071 tonnes during Q3 2021, which is a 13% decrease as compared to Q3 2020. Silver equivalent production for Q3 2021 was 306 thousand ounces or a 7% decline from Q3 2020, resulting from lower throughput and 5% lower silver head grades partially offset by 3% higher recoveries as compared to Q3 2020. The decline in silver grades resulted from the inability to operate in some of the targeted higher-grade zones due to issues related to excessive underground water and heat. A newly driven raise bore and upgraded pumping system were installed during the quarter allowing access to these areas.

The following table displays selected unaudited financial information for the three months and nine months (“9M 2021”) ended September 30, 2021:

Three Months Ended Nine Months Ended
(In thousands of dollars, except per share and cash cost amounts, consolidated figures unless noted otherwise)

September 30, 2021

September 30, 2020

September 30, 2021

September 30, 2020

Operating
Ore Processed / Tonnes Milled


750,208


798,458


2,312,163


2,050,641


Silver Ounces Produced (000’s)


807


1,023


2,722


2,543


Copper Pounds Produced (000’s)


8,256


12,153


25,686


33,636


Lead Pounds Produced (000’s)


7,841


9,855


24,805


25,340


Zinc Pounds Produced (000’s)


19,112


24,869


64,368


60,256


Gold Ounces Produced


2,261


3,989


7,709


10,408


Copper Equivalent Pounds Produced (000’s)1


21,870


35,170


71,966


89,100


Zinc Equivalent Pounds Produced (000’s)1


68,489


96,867


228,824


242,563


Silver Equivalent Ounces Produced (000’s)1


3,842


4,193


11,622


12,119


Cash Cost per Tonne Processed

$

44.63


$

36.02


$

46.25


$

39.44


Cost of sales per AgEqOz

$

11.22


$

8.35


$

10.84


$

8.29


Cash Cost per AgEqOz2

$

9.41


$

7.68


$

10.22


$

7.84


AISC per AgEqOz2

$

19.08


$

15.67


$

19.42


$

14.51


Cost of sales per CuEqLb2

$

1.97


$

1.00


$

1.75


$

1.13


Cash Cost per CuEqLb2

$

1.65


$

0.92


$

1.65


$

1.07


AISC per CuEqLb2

$

3.35


$

1.87


$

3.14


$

1.97


Cost of sales per ZnEqLb2

$

0.63


$

0.36


$

0.55


$

0.41


Cash Cost per ZnEqLb2

$

0.53


$

0.33


$

0.52


$

0.39


AISC per ZnEqLb2

$

1.07


$

0.68


$

0.99


$

0.73


Cash Cost per ZnEqLb (Yauricocha)2

$

0.44


$

0.30


$

0.45


$

0.36


AISC per ZnEqLb (Yauricocha)2

$

0.91


$

0.70


$

0.84


$

0.73


Cash Cost per CuEqLb (Yauricocha)2

$

1.37


$

0.82


$

1.42


$

0.97


AISC per CuEqLb (Yauricocha)2

$

2.83


$

1.93


$

2.69


$

2.00


Cash Cost per CuEqLb (Bolivar)23

$

2.02


$

1.01


$

1.76


$

1.06


AISC per CuEqLb (Bolivar)23

$

4.34


$

1.72


$

3.63


$

1.72


Cash Cost per AgEqOz (Cusi)2

$

17.06


$

11.56


$

19.15


$

17.20


AISC per AgEqOz (Cusi)2

$

28.93


$

16.47


$

31.65


$

23.54


Financial
Revenues

$

60,701


$

73,211


$

209,774


$

170,670


Adjusted EBITDA2

$

17,444


$

37,186


$

85,889


$

65,855


Operating cash flows before movements in working capital

$

16,512


$

37,852


$

77,986


$

66,746


Adjusted net income (loss) attributable to shareholders2

$

(3,063

)

$

18,377

$

14,001

$

20,931

Net income (loss) attributable to shareholders

$

(4,815

)

$

17,531


$

7,353


$

15,816


Cash and cash equivalents

$

58,288


$

63,846


$

58,288


$

63,846


Working capital

$

38,096


$

62,931


$

38,096


$

62,931


(1) Silver equivalent ounces and copper and zinc equivalent pounds for Q3 2021 were calculated using the following realized prices: $24.20/oz Ag, $4.25/lb Cu, $1.36/lb Zn, $1.07/lb Pb, $1,790/oz Au. Silver equivalent ounces and copper and zinc equivalent pounds for Q3 2020 were calculated using the following realized prices: $24.89/oz Ag, $2.97/lb Cu, $1.08/lb Zn, $0.85/lb Pb, $1,916/oz Au. Silver equivalent ounces and copper and zinc equivalent pounds for 9M 2021 were calculated using the following realized prices: $25.81/oz Ag, $4.17/lb Cu, $1.31/lb Zn, $0.99/lb Pb, $1,796/oz Au. Silver equivalent ounces and copper and zinc equivalent pounds for 9M 2020 were calculated using the following realized prices: $19.35/oz Ag, $2.63/lb Cu, $0.97/lb Zn, $0.80/lb Pb, $1,742/oz Au.
(2) This is a non-IFRS performance measure, see Non-IFRS Performance Measures section of the MD&A.
(3) Cash costs and AISC for the three month ended September 30, 2021 exclude prior period inventory adjustments of $3.8 million, which are not considered as costs for Q3 2021. These adjustments have no impact on the cash costs and AISC for the nine-month period ended September 30, 2021

Q3 2021 Financial Highlights

Revenue from metals payable of $60.7 million in Q3 2021 decreased by 17% from $73.2 million in Q3 2020. Revenues in Q3 2021 from the Yauricocha Mine in Peru were $44.4 million, in line with $44.6 million in Q3 2020, as the increase in average realized sale prices and lower treatment and refining costs were offset by lower payable metals, except zinc and silver, as compared to Q3 2020. Revenue from the Bolivar mine was $11.3 million or a decline of 52% as compared to Q3 2020 as the increase in copper price was not enough to offset the decrease in production attributable to lower throughput and grades. Revenue from the Cusi mine were 5% lower due to a decline in average realized prices for gold and silver, and higher treatment and refining costs for the quarter as compared to Q3 2020.

Yauricocha’s cost of sales per copper equivalent payable pound was $1.44 (Q3 2020 – $0.92), cash cost per copper equivalent payable pound was $1.37 (Q3 2020 – $0.82), and AISC per copper equivalent payable pound of $2.83 (Q3 2020 – $1.93). Cash costs per pound were driven higher by the combined impact of 16% higher operating costs per tonne and 30% lower copper equivalent payable pounds during Q3 2021 as compared to Q3 2020. The increase in the AISC per copper equivalent payable pound for Q3 2021 compared to Q3 2020 was mainly due to the lower copper equivalent payable pounds as the increase in operating costs and sustaining capital was partially offset by the decrease in treatment and refining costs.

Bolivar’s cost of sales per copper equivalent payable pound was $2.90 (Q3 2020 – $1.02), cash cost per copper equivalent payable pound was $2.02 (Q3 2020 – $1.01), and AISC per copper equivalent payable pound was $4.34 (Q3 2020 – $1.72) for Q3 2021. The increase in the AISC per copper equivalent payable pound was due to higher operating costs per tonne, sustaining capital, general and administrative costs and treatment and refining costs as compared to Q3 2020. Additionally, copper equivalent payable pounds declined 52% during Q3 2021 as compared to the same quarter of 2020.

Cusi’s cost of sales per silver equivalent payable ounce was $22.49 (Q3 2020 – $13.53), cash cost per silver equivalent payable ounce was $17.06 (Q3 2020 – $11.56), and AISC per silver equivalent payable ounce was $28.93 (Q3 2020 – $16.47) for Q3 2021. AISC per silver equivalent payable ounce increased despite 19% higher silver equivalent ounces payable due to higher operating cost per tonne combined with the increase in treatment and refining costs during Q3 2021 as compared to Q3 2020. Sustaining capital increased as compared to Q3 2020 due to timing of development activities.

Adjusted EBITDA(1) of $17.4 million for Q3 2021 decreased by 53% compared to $37.2 million in Q3 2020. Adjusted EBITDA declined in Q3 2021 due to the decrease in revenues realized and increase in operating costs at all three mines.

Cash flow generated from operations before movements in working capital of $16.5 million for Q3 2021 decreased compared to $37.9 million in Q3 2020. The decrease in operating cash flow is mainly the result of lower revenues generated.

Net loss attributable to Shareholders of the Company for Q3 2021 was $(4.8) million (Q3 2020: net income of $17.5 million) or $(0.03) per share (basic and diluted) (Q3 2020: $0.11).

Cash and cash equivalents of $58.3 million and working capital of $38.1 million as at September 30, 2021 compared to $71.5 million and $70.1 million, respectively, at the end of 2020. Cash and cash equivalents decreased during 9M 2021 as the cash used in investing activities of $53.9 million and cash used in financing activities ($15.0 million used for repayment of the credit facility and interest, and $6.4 million of dividends to minority shareholders) exceeded the cash generated from operating activities of $62.2 million. The decrease in working capital resulted from lower cash and cash equivalents combined with the increase in current liabilities.

(1) This is a non-IFRS performance measure, see Non-IFRS Performance Measures section of the MD&A.

Project Development

Mine development at Bolivar during Q3 2021 totaled 2,550 meters, which included 1,162 meters of development to prepare stopes for mine production. Of the remainder, 588 meters were related to the integration tunnel connecting Bolivar West and the Piedras Verdes plant, and 800 meters to development of ramps. During Q3 2021, at the Cusi property, mine development totaled 1,541 meters, which was targeted towards achieving the planned throughput of 1,100 tpd.

Exploration Update

Peru:

During Q3 2021, surface exploration using diamond drills continued in the Kilkasca, El Estacion and Yauricocha Medio zones. A total of 2,341 meters were drilled during the quarter. Further, 3,306 meters of underground exploration was completed with the aim of replacing and increasing the mineral resources exploited during the year.

Mexico:

Bolivar
At Bolívar during Q3 2021, 9,768 meters were drilled, including 3,151 meters of brownfield exploration and 6,617 meters of infill drilling, with the objective of converting inferred and indicated resources to reserves. Major exploration targets include Bolivar West and Mina de Fierro zones.

Cusi
During Q3 2021, a total of 7,262 meters of infill drilling was completed in Cusi to support the definition of San Antonio, San Nicolas, Gallo, Bajo Promontorio and the high-grade NE-SW veins.

Revised Guidance

The production and financial results of the Company in the first 9 months of 2021 were impacted by COVID-19 and operational challenges. While the Company has tried to manage the COVID related challenges and achieve normal production levels, our sites have faced other operational challenges particularly during Q3 2021. At Yauricocha, regulatory restrictions have limited production to come from lower grade, higher tonnage areas to reach production targets. Bolivar is impacted by delays in mine development, infill drilling and high personnel turnover. Further, excessive underground water and heat conditions at Cusi impacted its ability to mine some of the targeted high-grade zones, hence reduced throughput and head grade.

While the Management believes that these issues are temporary in nature and will not affect the Company’s results in the medium to longer term time frame, these require an adjustment to the 2021 EBITDA and cost guidance primarily related to the Bolivar Mine. Appropriate actions are being taken to return to full operational efficiency at Bolivar, while continuing to manage the outstanding risks related to COVID-19 at all Mines.

The Company had previously lowered its production guidance for 2021 copper equivalent production to fall between 110 – 115 million pounds. However, EBITDA guidance is now being lowered primarily due to operational issues at our Mexican operations and is now expected to range between $105 – $110M this year (previously $130M – $140M). The lower range is largely because of lower EBITDA projected at Bolivar which is now expected to range between $22M – $26M for that Mine (previously $44M – $48M). Capex guidance for 2021 is also being lowered and is now expected to range between $75M – $80M (previously $100M). The lower Capex guidance is primarily due to the deferral of the magnetite iron ore project at the Bolivar Mine until 2022 as detailed engineering on the project is completed and the bulk freight market normalizes. Cost guidance at Bolivar is also being revised to include higher than previously guided costs for the 2021 year as seen in the table below:

Cash costs range AISC(1) range
Mine per CuEqLb per CuEqLb
 
Revised 2021 guidance
Bolivar Copper Eq Lbs (‘000) $1.67 – $1.75 $3.30 – 3.47
 
Previous guidance
Bolivar Copper Eq Lbs (‘000) $1.32 – $1.40 $2.60 – 2.74
 
(1) AISC includes treatment and refining charges, selling costs, G&A costs and sustaining capital expenditure

Conference Call Webcast

Sierra Metals’ senior management will host a conference call on Tuesday, November 9, 2021, at 10:30 AM (EST) to discuss the Company’s financial and operating results for the three and nine months ended September 30, 2021.

Due to the expected number or participants on the call, and in the interest of timing, callers are asked to limit their questions to two each. Additional questions will be answered through Investor Relations after the completion of the call.

Via Webcast:

A live audio webcast of the meeting will be available on the Company’s website:

https://event.on24.com/wcc/r/3408832/5D1D447434FB0425E6DE1CDA1E5662AF

The webcast, along with presentation slides, will be archived for 180 days on www.sierrametals.com.

Via phone:

For those who prefer to listen by phone, dial-in instructions are below. To ensure your participation, please call approximately five minutes prior to the scheduled start time of the call.

Canada dial-in number (Toll Free): 1 833 950 0062
Canada dial-in number (Local): 1 226 828 7575
United States: 1 844 200 6205
United States (Local): 1 646 904 5544
All other locations: +1 929 526 1599

Access code: 049437

Press *1 to ask a question, *2 to withdraw your question, or *0 for operator assistance.

Quality Control

The contents of this press release have been reviewed by Américo Zuzunaga, FAusIMM CP (Mining Engineer) and Vice President of Corporate Planning, who is a Qualified Person under National Instrument 43-101 – Standards of Disclosure for Mineral Projects.

About Sierra Metals

Sierra Metals Inc. is a diversified Canadian mining company with Green Metal exposure including increasing copper production and base metal production with precious metals byproduct credits, focused on the production and development of its Yauricocha Mine in Peru, and Bolivar and Cusi Mines in Mexico. The Company is focused on increasing production volume and growing mineral resources. Sierra Metals has recently had several new key discoveries and still has many more exciting brownfield exploration opportunities at all three Mines in Peru and Mexico that are within close proximity to the existing mines. Additionally, the Company also has large land packages at all three mines with several prospective regional targets providing longer-term exploration upside and mineral resource growth potential.

The Company’s Common Shares trade on the Bolsa de Valores de Lima and on the Toronto Stock Exchange under the symbol “SMT” and on the NYSE American Exchange under the symbol “SMTS.”

Continue to Follow, Like and Watch our progress:

Webwww.sierrametals.com | Twittersierrametals | FacebookSierraMetalsInc | LinkedInSierra Metals Inc

Forward-Looking Statements

This press release contains “forward-looking information” and “forward-looking statements” within the meaning of Canadian and U.S. securities laws (collectively, “forward-looking information“). Forward-looking information includes, but is not limited to, statements with respect to the date of the 2020 Shareholders’ Meeting and the anticipated filing of the Compensation Disclosure. Any statements that express or involve discussions with respect to predictions, expectations, beliefs, plans, projections, objectives, assumptions or future events or performance (often, but not always, using words or phrases such as “expects,” “anticipates,” “plans,” “projects,” “estimates,” “assumes,” “intends,” “strategy,” “goals,” “objectives,” “potential” or variations thereof, or stating that certain actions, events or results “may,” “could,” “would,” “might” or “will” be taken, occur or be achieved, or the negative of any of these terms and similar expressions) are not statements of historical fact and may be forward-looking information.

Forward-looking information is subject to a variety of risks and uncertainties, which could cause actual events or results to differ from those reflected in the forward-looking information, including, without limitation, the risks described under the heading “Risk Factors” in the Company’s annual information form dated March 18, 2021 for its fiscal year ended December 31, 2020 and other risks identified in the Company’s filings with Canadian securities regulators and the United States Securities and Exchange Commission, which filings are available at www.sedar.com and www.sec.gov, respectively.

The risk factors referred to above are not an exhaustive list of the factors that may affect any of the Company’s forward-looking information. Forward-looking information includes statements about the future and is inherently uncertain, and the Company’s actual achievements or other future events or conditions may differ materially from those reflected in the forward-looking information due to a variety of risks, uncertainties and other factors. The Company’s statements containing forward-looking information are based on the beliefs, expectations and opinions of management on the date the statements are made, and the Company does not assume any obligation to update such forward-looking information if circumstances or management’s beliefs, expectations or opinions should change, other than as required by applicable law. For the reasons set forth above, one should not place undue reliance on forward-looking information.

For further information regarding Sierra Metals, please visit www.sierrametals.com.

Mike McAllister
VP, Investor Relations
Sierra Metals Inc.
+1 (416) 366-7777
info@sierrametals.com

Ed Guimaraes
CFO
Sierra Metals Inc.
+1 (416) 366-7777

Luis Marchese
CEO
Sierra Metals Inc.
+1 (416) 366-7777

Source: Sierra Metals Inc.

Release – CoreCivic Reports Third Quarter 2021 Financial Results


CoreCivic Reports Third Quarter 2021 Financial Results


BRENTWOOD, Tenn., Nov. 08, 2021 (GLOBE NEWSWIRE) — CoreCivic, Inc. (NYSE: CXW) (the Company) announced today its financial results for the third quarter of 2021.

Financial Highlights – Third Quarter 2021

  • Total revenue of $471.2 million
    • CoreCivic Safety revenue of $431.5 million
    • CoreCivic Community revenue of $25.5 million
    • CoreCivic Properties revenue of $13.9 million
  • Diluted earnings per share of $0.25
  • Adjusted diluted EPS of $0.28
  • Normalized FFO per diluted share of $0.48
  • Adjusted EBITDA of $100.9 million
  • Issuance of $225.0 million of Unsecured Senior Notes
  • Leverage decreased to 2.7x

Damon T. Hininger, CoreCivic’s President and Chief Executive Officer, said, “Our cash flow generation remains strong despite the ongoing global pandemic and the unique challenges presented by the current employment market. We continue to execute on our capital allocation strategy with a priority of reducing debt, and enhancing our overall capital structure. During the third quarter we sufficiently reduced debt to fall within the high end of our targeted leverage ratio, and continue to make progress in obtaining the clarity needed to move to the next phase of our capital allocation strategy. Our capital allocation strategy continues to benefit our cost of borrowing, as shown with our recent $225 million unsecured bond issuance which priced nearly 100 basis points lower than the April 2021 issuance.

Hininger continued, “Our business is very durable, and continues to generate cash flow even during these unprecedented disruptions to the economy and criminal justice system. This resiliency is due to the essential nature of our facilities and services in our Safety and Community segments, further enhanced by the stability of our Properties segment, all supported by payments from highly rated federal, state, and local government agencies.”

Third Quarter 2021 Financial Results Compared With Third Quarter 2020

Net income attributable to common stockholders in the third quarter of 2021 totaled $30.0 million, or $0.25 per diluted share, compared with net income attributable to common stockholders generated in the third quarter of 2020 of $26.7 million, or $0.22 per diluted share. Adjusted for special items, net income in the third quarter of 2021 was $33.7 million, or $0.28 per diluted share (Adjusted Diluted EPS), compared with adjusted net income in the third quarter of 2020 of $34.1 million, or $0.28 per diluted share. Special items for each period are presented in detail in the calculation of Adjusted Diluted EPS following the financial statements presented herein. Financial results in 2021 reflect higher income tax expense following the revocation of our election to be taxed as a real estate investment trust (REIT) effective January 1, 2021. As a REIT, we were entitled to a deduction for dividends paid, which resulted in a significantly lower income tax expense in the prior year.

Earnings before interest, taxes, depreciation and amortization (EBITDA) was $95.7 million in the third quarter of 2021, compared with $87.8 million in the third quarter of 2020. Adjusted EBITDA, which excludes the special items referred to above, was $100.9 million in the third quarter of 2021, compared with $94.6 million in the third quarter of 2020. Adjusted EBITDA increased from the prior year quarter despite a $7.3 million reduction in facility EBITDA attributable to the 42 properties sold in the fourth quarter of 2020 and the five additional non-core real estate assets sold in the second quarter of 2021.  

Funds From Operations (FFO) was $54.9 million, or $0.45 per diluted share, in the third quarter of 2021, compared to $53.4 million, or $0.44 per diluted share, in the third quarter of 2020. Normalized FFO, which excludes the special items referred to above, was $58.6 million, or $0.48 per diluted share, in the third quarter of 2021, compared with $62.3 million, or $0.52 per diluted share, in the third quarter of 2020. FFO and Normalized FFO were also impacted by our new corporate tax structure.

Adjusted Net Income, EBITDA, Adjusted EBITDA, FFO, and Normalized FFO, and, where appropriate, their corresponding per share amounts, are measures calculated and presented on the basis of methodologies other than in accordance with generally accepted accounting principles (GAAP). Please refer to the Supplemental Financial Information and related note following the financial statements herein for further discussion and reconciliations of these measures to net income, the most directly comparable GAAP measure.

Business Updates

Notes Offering and Debt Reduction.   On September 29, 2021, we completed an underwritten registered tack-on offering of $225.0 million aggregate principal amount of 8.25% senior unsecured notes due 2026 (the “Additional Notes”) at an issue price of 102.25% of their aggregate principal amount, plus accrued interest from the April 14, 2021 issue date for the $450.0 million aggregate principal amount of 8.25% senior unsecured notes due 2026 (the “Original Notes”). The Additional Notes have an effective yield to maturity of 7.65%, nearly 100 basis points below the effective yield of the Original Notes.

We have made substantial progress in reducing debt, repaying $187.5 million of debt during the third quarter of 2021, net of the change in cash. During the third quarter of 2021, we fully repaid the $112.0 million outstanding balance on our revolving credit facility, which remains undrawn. Including the repayments of mortgage notes associated with the sale of non-core assets, we have reduced our net debt balance by over $500.0 million during the nine months ended September 30, 2021. Subsequent to quarter-end, we repaid $90.0 million, or approximately 40%, of the outstanding balance on our Term Loan B using cash on hand. Using the trailing twelve months ended September 30, 2021, our leverage, or net debt to Adjusted EBITDA, was 2.7x, falling within the high end of our targeted leverage of 2.25x to 2.75x, and down from 4.0x using the trailing twelve months ended September 30, 2020.

New Lease Agreement with the State of New Mexico at the Northwest New Mexico Correctional Center. On September 21, 2021, we entered into a new three-year lease agreement with the State of New Mexico at the Company’s 596-bed Northwest New Mexico Correctional Center. We previously operated the Northwest New Mexico Correctional Center under a contract with New Mexico and transitioned facility operations to the New Mexico Corrections Department when the new lease agreement commenced on November 1, 2021. We will retain responsibility for facility maintenance throughout the term of the lease. The new lease agreement includes automatic extension options that could extend the term of the lease through October 31, 2041.

Financial Guidance

At this time we are not providing 2021 financial guidance because of uncertainties associated with COVID-19, including a resurgence caused by the Delta variant, as well as uncertainties associated with the application of the administration’s various executive actions and policies related to immigration and criminal justice. We currently expect to provide full year 2022 financial guidance in February 2022, when we expect to report our financial results for the fourth quarter and full year 2021.   

Supplemental Financial Information and Investor Presentations

We have made available on our website supplemental financial information and other data for the third quarter of 2021. Interested parties may access this information through our website at http://ir.corecivic.com/ under “Financial Information” of the Investors section. We do not undertake any obligation, and disclaim any duties to update any of the information disclosed in this report.  

Management may meet with investors from time to time during the fourth quarter of 2021. Written materials used in the investor presentations will also be available on our website beginning on or about November 15, 2021. Interested parties may access this information through our website at http://ir.corecivic.com/ under “Events & Presentations” of the Investors section.

Conference Call, Webcast and Replay Information

We will host a webcast conference call at 10:00 a.m. central time (11:00 a.m. eastern time) on Tuesday, November 9, 2021, which will be accessible through the Company’s website at www.corecivic.com under the “Events & Presentations” section of the “Investors” page. The live broadcast can also be accessed by dialing 800-437-2398 in the U.S. and Canada, including the confirmation passcode 1667596. An online replay of the call will be archived on our website promptly following the conference call. In addition, there will be a telephonic replay available beginning at 1:00 p.m. central time (2:00 p.m. eastern time) on November 9, 2021, through 1:00 p.m. central time (2:00 p.m. eastern time) on November 17, 2021. To access the telephonic replay, dial 888-203-1112 in the U.S. and Canada. International callers may dial +1 719-457-0820 and enter passcode 1667596.

About CoreCivic

CoreCivic is a diversified government-solutions company with the scale and experience needed to solve tough government challenges in flexible, cost-effective ways. CoreCivic provides a broad range of solutions to government partners that serve the public good through corrections and detention management, a network of residential reentry centers to help address America’s recidivism crisis, and government real estate solutions. CoreCivic is the nation’s largest owner of partnership correctional, detention and residential reentry facilities, and believes it is the largest private owner of real estate used by government agencies in the U.S. CoreCivic has been a flexible and dependable partner for government for more than 35 years. CoreCivic’s employees are driven by a deep sense of service, high standards of professionalism and a responsibility to help government better the public good.

Forward-Looking Statements

This press release contains statements as to our beliefs and expectations of the outcome of future events that are “forward-looking” statements within the meaning of Section 21E of the Securities Exchange Act of 1934, as amended, and the Private Securities Litigation Reform Act of 1995. These forward-looking statements are subject to risks and uncertainties that could cause actual results to differ materially from the statements made. These include, but are not limited to, the risks and uncertainties associated with: (i) changes in government policy (including the United States Department of Justice, or DOJ, not renewing contracts as a result of President Biden’s Executive Order on Reforming Our Incarceration System to Eliminate the Use of Privately Operated Criminal Detention Facilities, or the Private Prison EO) (two agencies of the DOJ, the United States Federal Bureau of Prisons and the United States Marshals Service utilize our services), legislation and regulations that affect utilization of the private sector for corrections, detention, and residential reentry services, in general, or our business, in particular, including, but not limited to, the continued utilization of our correctional and detention facilities by the federal government, and the impact of any changes to immigration reform and sentencing laws (our company does not, under longstanding policy, lobby for or against policies or legislation that would determine the basis for, or duration of, an individual’s incarceration or detention); (ii) our ability to obtain and maintain correctional, detention, and residential reentry facility management contracts because of reasons including, but not limited to, sufficient governmental appropriations, contract compliance, negative publicity and effects of inmate disturbances; (iii) changes in the privatization of the corrections and detention industry, the acceptance of our services, the timing of the opening of new facilities and the commencement of new management contracts (including the extent and pace at which new contracts are utilized), as well as our ability to utilize available beds; (iv) general economic and market conditions, including, but not limited to, the impact governmental budgets can have on our contract renewals and renegotiations, per diem rates, and occupancy; (v) fluctuations in our operating results because of, among other things, changes in occupancy levels, competition, contract renegotiations or terminations, increases in costs of operations, fluctuations in interest rates and risks of operations; (vi) the duration of the federal government’s denial of entry at the United States southern border to asylum-seekers and anyone crossing the southern border without proper documentation or authority in an effort to contain the spread of COVID-19; (vii) government and staff responses to staff or residents testing positive for COVID-19 within public and private correctional, detention and reentry facilities, including the facilities we operate; (viii)  restrictions associated with COVID-19 that disrupt the criminal justice system, along with government policies on prosecutions and newly ordered legal restrictions that affect the number of people placed in correctional, detention, and reentry facilities, including those associated with a resurgence of COVID-19; (ix) whether revoking our REIT election, effective January 1, 2021, and our revised capital allocation strategy can be implemented in a cost effective manner that provides the expected benefits, including facilitating our planned debt reduction initiative and planned return of capital to shareholders; (x) our ability to successfully identify and consummate future development and acquisition opportunities and our ability to successfully integrate the operations of our completed acquisitions and realize projected returns resulting therefrom; (xi) our ability, following our revocation of our REIT election, to identify and initiate service opportunities that were unavailable under the REIT structure; (xii) our ability to have met and maintained qualification for taxation as a REIT for the years we elected REIT status; and (xiii) the availability of debt and equity financing on terms that are favorable to us, or at all. Other factors that could cause operating and financial results to differ are described in the filings we make from time to time with the Securities and Exchange Commission.

CoreCivic takes no responsibility for updating the information contained in this press release following the date hereof to reflect events or circumstances occurring after the date hereof or the occurrence of unanticipated events or for any changes or modifications made to this press release or the information contained herein by any third-parties, including, but not limited to, any wire or internet services.


CORECIVIC, INC. AND SUBSIDIARIES
CONSOLIDATED BALANCE SHEETS
(UNAUDITED AND AMOUNTS IN THOUSANDS, EXCEPT PER SHARE AMOUNTS)

       
ASSETS September 30,
2021
  December 31,
2020
       
Cash and cash equivalents $ 455,544     $ 113,219  
Restricted cash   11,134       23,549  
Accounts receivable, net of credit loss reserve of $7,338 and $6,103,  respectively   228,889       267,705  
Prepaid expenses and other current assets   33,875       33,243  
Assets held for sale         279,406  
Total current assets   729,442       717,122  
Real estate and related assets:      
Property and equipment, net of accumulated depreciation of $1,631,521 and $1,559,388, respectively   2,295,570       2,350,272  
Other real estate assets   220,733       228,243  
Goodwill   4,844       5,902  
Non-current deferred tax assets         11,113  
Other assets   371,388       396,663  
       
Total assets $ 3,621,977     $ 3,709,315  
       
LIABILITIES AND STOCKHOLDERS’ EQUITY      
       
Accounts payable and accrued expenses $ 353,678     $ 274,318  
Current portion of long-term debt   33,685       39,087  
Total current liabilities   387,363       313,405  
       
Long-term debt, net   1,586,363       1,747,664  
Deferred revenue   28,793       18,336  
Non-current deferred tax liabilities   82,736        
Other liabilities   197,364       216,468  
       
Total liabilities   2,282,619       2,295,873  
       
Commitments and contingencies      
       
Preferred stock ? $0.01 par value; 50,000 shares authorized; none issued and outstanding at September 30, 2021, and December 31, 2020, respectively          
Common stock ? $0.01 par value; 300,000 shares authorized; 120,285 and 119,638 shares issued and outstanding at September 30, 2021 and December 31, 2020, respectively   1,203       1,196  
Additional paid-in capital   1,864,861       1,835,494  
Accumulated deficit   (526,706 )     (446,519 )
Total stockholders’ equity   1,339,358       1,390,171  
Non-controlling interest – operating partnership         23,271  
Total equity   1,339,358       1,413,442  
       
Total liabilities and equity $ 3,621,977     $ 3,709,315  
               

CORECIVIC, INC. AND SUBSIDIARIES
CONSOLIDATED STATEMENTS OF OPERATIONS
(UNAUDITED AND AMOUNTS IN THOUSANDS, EXCEPT PER SHARE AMOUNTS)

       
  For the Three Months Ended
September 30,
  For the Nine Months Ended
September 30,
    2021       2020       2021       2020  
               
REVENUES:              
Safety $ 431,534     $ 420,032     $ 1,261,183     $ 1,281,914  
Community   25,535       24,067       74,122       80,670  
Properties   13,940       24,134       54,927       69,296  
Other   185       33       251       128  
    471,194       468,266       1,390,483       1,432,008  
               
EXPENSES:              
Operating              
Safety   314,283       319,335       926,990       973,811  
Community   20,427       21,095       61,551       67,745  
Properties   3,381       7,411       15,323       21,271  
Other   101       86       282       342  
Total operating expenses   338,192       347,927       1,004,146       1,063,169  
General and administrative   34,600       35,883       97,358       97,307  
Depreciation and amortization   33,991       37,865       100,787       114,436  
Contingent consideration for acquisition of businesses         620             620  
Shareholder litigation expense               54,295        
Asset impairments   5,177       805       9,351       13,058  
    411,960       423,100       1,265,937       1,288,590  
               
OTHER INCOME (EXPENSE):              
Interest expense, net   (20,653 )     (20,193 )     (62,303 )     (63,727 )
Expenses associated with debt repayments and refinancing transactions               (52,167 )      
Gain on sale of real estate assets, net         2,102       38,766       4,920  
Other income (expense)   49       11       (107 )     713  
               
INCOME BEFORE INCOME TAXES   38,630       27,086       48,735       85,324  
               
Income tax expense   (8,618 )     (369 )     (128,668 )     (3,183 )

NET INCOME (LOSS)
  30,012       26,717       (79,933 )    
82,141
 
               
Net income attributable to non-controlling interest                     (1,181 )
               
NET INCOME (LOSS) ATTRIBUTABLE TO COMMON STOCKHOLDERS $ 30,012     $ 26,717     $ (79,933 )   $ 80,960  
               
               
BASIC EARNINGS (LOSS) PER SHARE $ 0.25     $ 0.22     $ (0.67 )   $ 0.68  
               
DILUTED EARNINGS (LOSS) PER SHARE $ 0.25     $ 0.22     $ (0.67 )   $ 0.68  
                               

CORECIVIC, INC. AND SUBSIDIARIES
SUPPLEMENTAL FINANCIAL INFORMATION
(UNAUDITED AND AMOUNTS IN THOUSANDS, EXCEPT PER SHARE AMOUNTS)

CALCULATION OF ADJUSTED NET INCOME AND ADJUSTED DILUTED EPS

       
  For the Three Months Ended
September 30,
  For the Nine Months Ended
September 30,
    2021       2020       2021       2020  
               
Net income (loss) attributable to common stockholders $ 30,012     $ 26,717     $ (79,933 )   $ 80,960  
Non-controlling interest                     1,181  
Diluted net income (loss) attributable to common stockholders $ 30,012     $ 26,717     $ (79,933 )   $ 82,141  
               
Special items:              
Expenses associated with debt repayments and refinancing transactions               52,167        
Expenses associated with mergers and acquisitions                     338  
Expenses associated with COVID-19         2,820       2,434       10,985  
Expenses associated with changes in corporate tax structure         4,698             5,045  
Income taxes associated with change in corporate tax structure and other special tax items               114,249       3,085  
Contingent consideration for acquisition of businesses         620             620  
Gain on sale of real estate assets, net         (2,102 )     (38,766 )     (4,920 )
Shareholder litigation expense               54,295        
Asset impairments   5,177       805       9,351       13,058  
Income tax expense (benefit) for special items   (1,449 )     532       (19,694 )     532  
Adjusted net income $ 33,740     $ 34,090     $ 94,103     $ 110,884  
Weighted average common shares outstanding – basic   120,285       119,632       120,161       119,533  
Effect of dilutive securities:              
Restricted stock-based awards   641       6       397       25  
Non-controlling interest – operating partnership units   1,123       1,342       1,269       1,342  
Weighted average shares and assumed conversions – diluted   122,049       120,980       121,827       120,900  
Adjusted Earnings Per Diluted Share $ 0.28     $ 0.28     $ 0.77     $ 0.92  
                               

CORECIVIC, INC. AND SUBSIDIARIES
SUPPLEMENTAL FINANCIAL INFORMATION
(UNAUDITED AND AMOUNTS IN THOUSANDS, EXCEPT PER SHARE AMOUNTS)

CALCULATION OF FUNDS FROM OPERATIONS AND NORMALIZED FUNDS FROM OPERATIONS

       
  For the Three Months Ended
September 30,
  For the Nine Months Ended
September 30,
    2021       2020       2021       2020  
               
Net income (loss) $ 30,012     $ 26,717     $ (79,933 )   $ 82,141  
Depreciation and amortization of real estate assets   24,877       28,249       73,562       84,599  
Impairment of real estate assets               1,308       10,155  
Gain on sale of real estate assets, net         (2,102 )     (38,766 )     (4,920 )
Income tax expense for special items         532       9,291       532  
Funds From Operations $ 54,889     $ 53,396     $ (34,538 )   $ 172,507  
               
Expenses associated with debt repayments and refinancing transactions               52,167        
Expenses associated with mergers and acquisitions                     338  
Contingent consideration for acquisition of businesses         620             620  
Expenses associated with COVID-19         2,820       2,434       10,985  
Expenses associated with changes in corporate tax structure         4,698             5,045  
Income taxes associated with change in corporate tax structure and other special tax items               114,249       3,085  
Shareholder litigation expense               54,295        
Goodwill and other impairments   5,177       805       8,043       2,903  
Income tax benefit for special items   (1,449 )           (28,985 )      
Normalized Funds From Operations $ 58,617     $ 62,339     $ 167,665     $ 195,483  
               
Funds From Operations Per Diluted Share $ 0.45     $ 0.44     $ (0.28 )   $ 1.43  
Normalized Funds From Operations Per Diluted Share $ 0.48     $ 0.52     $ 1.38     $ 1.62  
                               

CORECIVIC, INC. AND SUBSIDIARIES
SUPPLEMENTAL FINANCIAL INFORMATION
(UNAUDITED AND AMOUNTS IN THOUSANDS, EXCEPT PER SHARE AMOUNTS)

CALCULATION OF EBITDA AND ADJUSTED EBITDA

       
  For the Three Months Ended
September 30,
  For the Nine Months Ended
September 30,
    2021     2020       2021       2020  
               
Net income (loss) $ 30,012   $ 26,717     $ (79,933 )   $ 82,141  
Interest expense   23,097     22,809       69,865       71,237  
Depreciation and amortization   33,991     37,865       100,787       114,436  
Income tax expense   8,618     369       128,668       3,183  
EBITDA $ 95,718   $ 87,760     $ 219,387     $ 270,997  
Expenses associated with debt repayments and refinancing transactions             52,167        
Expenses associated with mergers and acquisitions                   338  
Expenses associated with COVID-19       2,820       2,434       10,985  
Expenses associated with changes in corporate tax structure       4,698             5,045  
Contingent consideration for acquisition of businesses       620             620  
Gain on sale of real estate assets, net       (2,102 )     (38,766 )     (4,920 )
Shareholder litigation expense             54,295        
Asset impairments   5,177     805       9,351       13,058  
Adjusted EBITDA $ 100,895   $ 94,601     $ 298,868     $ 296,123  
                             

NOTE TO SUPPLEMENTAL FINANCIAL INFORMATION

Adjusted Net Income, EBITDA, Adjusted EBITDA, FFO, and Normalized FFO, and, where appropriate, their corresponding per share metrics are non-GAAP financial measures. The Company believes that these measures are important operating measures that supplement discussion and analysis of the Company’s results of operations and are used to review and assess operating performance of the Company and its properties and their management teams. The Company believes that it is useful to provide investors, lenders and security analysts disclosures of its results of operations on the same basis that is used by management. FFO, in particular, is a widely accepted non-GAAP supplemental measure of performance of real estate companies, grounded in the standards for FFO established by the National Association of Real Estate Investment Trusts (NAREIT).

NAREIT defines FFO as net income computed in accordance with GAAP, excluding gains (or losses) from sales of property and extraordinary items, plus depreciation and amortization of real estate and impairment of depreciable real estate and after adjustments for unconsolidated partnerships and joint ventures calculated to reflect funds from operations on the same basis. EBITDA, Adjusted EBITDA, and Normalized FFO are useful as supplemental measures of performance of the Company’s properties because such measures do not take into account depreciation and amortization, or with respect to EBITDA, the impact of the Company’s tax provisions and financing strategies. Because the historical cost accounting convention used for real estate assets requires depreciation (except on land), this accounting presentation assumes that the value of real estate assets diminishes at a level rate over time. Because of the unique structure, design and use of the Company’s properties, management believes that assessing performance of the Company’s properties without the impact of depreciation or amortization is useful. The Company may make adjustments to FFO from time to time for certain other income and expenses that it considers non-recurring, infrequent or unusual, even though such items may require cash settlement, because such items do not reflect a necessary or ordinary component of the ongoing operations of the Company.   Normalized FFO excludes the effects of such items. The Company calculates Adjusted Net Income by adding to GAAP Net Income expenses associated with the Company’s debt repayments and refinancing transactions, M&A activity, and certain impairments and other charges that the Company believes are unusual or non-recurring to provide an alternative measure of comparing operating performance for the periods presented. Even though expenses associated with mergers and acquisitions may be recurring, the magnitude and timing fluctuate based on the timing and scope of M&A activity, and therefore, such expenses, which are not a necessary component of the ongoing operations of the Company, may not be comparable from period to period.

Other companies may calculate Adjusted Net Income, EBITDA, Adjusted EBITDA, FFO, and Normalized FFO differently than the Company does, or adjust for other items, and therefore comparability may be limited. Adjusted Net Income, EBITDA, Adjusted EBITDA, FFO, and Normalized FFO and, where appropriate, their corresponding per share measures are not measures of performance under GAAP, and should not be considered as an alternative to cash flows from operating activities, a measure of liquidity or an alternative to net income as indicators of the Company’s operating performance or any other measure of performance derived in accordance with GAAP. This data should be read in conjunction with the Company’s consolidated financial statements and related notes included in its filings with the Securities and Exchange Commission.

Contact: Investors: Cameron Hopewell – Managing Director, Investor Relations – (615) 263-3024
Financial Media: David Gutierrez, Dresner Corporate Services – (312) 780-7204

Ocugen (OCGN) – Covaxin Pediatric Application Filed Listed for Emergency Use

Monday, November 08, 2021

Ocugen (OCGN)
Covaxin Pediatric Application Filed, Listed for Emergency Use

Ocugen Inc is a clinical stage biopharmaceutical company. It is focused on discovering, developing and commercializing a pipeline of innovative therapies that address rare and underserved eye diseases. Ocugen offers a diversified ophthalmology portfolio that includes novel gene therapies, biologics, and small molecules and targets a broad range of high-need retinal and ocular surface diseases.

Robert LeBoyer, Senior Research Analyst, Noble Capital Markets, Inc.

Refer to the full report for the price target, fundamental analysis, and rating.

    Emergency Pediatric Use Application Filed. Ocugen announced that it has filed an Emergency Pediatric Use application for Covaxin in children from age 2 to 18 year of age. The data for the application was from the Phase 2/3 study conducted by Bharat Biotech that included 529 children in its total enrollment of 25,800 patients. Separately, the World Health Organization (WHO) has issued an Emergency Use Listing for Covaxin.

    WHO Listing Followed Clinical Data Assessment.  Covaxin was reviewed by the WHO’s Strategic Advisory Group of Experts on immunization (SAGE), the advisory group that makes WHO vaccination policy. SAGE evaluated the Phase 2 and Phase 3 clinical data for safety and efficacy. It determined that Covaxin meets WHO standards and endorsed its use for vaccination programs worldwide …


This Company Sponsored Research is provided by Noble Capital Markets, Inc., a FINRA and S.E.C. registered broker-dealer (B/D).

*Analyst certification and important disclosures included in the full report. NOTE: investment decisions should not be based upon the content of this research summary.  Proper due diligence is required before making any investment decision. 

Information Services (III) – Post Call Commentary Raising PT

Monday, November 08, 2021

Information Services (III)
Post Call Commentary; Raising PT

ISG (Information Services Group) (Nasdaq: III) is a leading global technology research and advisory firm. A trusted business partner to more than 700 clients, including more than 70 of the top 100 enterprises in the world, ISG is committed to helping corporations, public sector organizations, and service and technology providers achieve operational excellence and faster growth. The firm specializes in digital transformation services, including automation, cloud and data analytics; sourcing advisory; managed governance and risk services; network carrier services; strategy and operations design; change management; market intelligence and technology research and analysis. Founded in 2006, and based in Stamford, Conn., ISG employs more than 1,300 digital-ready professionals operating in more than 20 countries—a global team known for its innovative thinking, market influence, deep industry and technology expertise, and world-class research and analytical capabilities based on the industry’s most comprehensive marketplace data. For more information, visit www.isg-one.com

Joe Gomes, Senior Research Analyst, Noble Capital Markets, Inc.

Joshua Zoepfel, Research Associate, Noble Capital Markets, Inc.

Refer to the full report for the price target, fundamental analysis, and rating.

    All Things Digital. ISG’s portfolio of products and services built around all things digital is in high demand, and the success is being amplified by ISG’s NEXT operating model. This was the fifth consecutive quarter of outstanding results coming out of the pandemic.

    ISG NEXT.  The Company’s ISG NEXT operating model is generating significant operating improvement. For example, SG&A expenses fell to 27.1% of revenues in the qtr., down from 33.0% last year. Adjusted EBITDA margin grew to 14.4% from 13.3% last year …


This Company Sponsored Research is provided by Noble Capital Markets, Inc., a FINRA and S.E.C. registered broker-dealer (B/D).

*Analyst certification and important disclosures included in the full report. NOTE: investment decisions should not be based upon the content of this research summary.  Proper due diligence is required before making any investment decision.