PDS Biotech Provides Business Update and Reports Third Quarter 2021 Financial Results


PDS Biotech Provides Business Update and Reports Third Quarter 2021 Financial Results


FLORHAM PARK, N.J., Nov. 10, 2021 (GLOBE NEWSWIRE) — PDS Biotechnology Corporation (Nasdaq: PDSB), a clinical-stage immunotherapy company developing novel cancer therapies and infectious disease vaccines based on the Company’s proprietary Versamune® T-cell activating technology, will discuss its financial results for the quarter ended September 30, 2021 and provide a business update on its conference call today.

Recent Business Highlights:

  • Achieved several milestones in the VERSATILE-002 Phase 2 Combination Trial of PDS0101-KEYTRUDA® for recurrent and/or metastatic human papillomavirus (HPV)16-associated head and neck cancer. These milestones include:
    • Achievement of the preliminary safety benchmark for the first 12 patients
    • Completion of enrollment for the first stage of the checkpoint inhibitor naïve arm (1st line treatment of recurrent or metastatic head and neck cancer).
    • Initiated enrollment of the second arm of the study addressing checkpoint inhibitor refractory patients (2nd line treatment of recurrent or metastatic head and neck cancer)
  • Completed a licensing agreement with the National Cancer Institute (NCI) for intellectual property related to the NCI’s proprietary T-cell receptor gamma alternate reading frame protein (TARP) tumor antigen for use in PDS0102.
    • PDS0102 is being developed to treat prostate cancer, breast cancer and acute myeloid leukemia or AML.
    • PDS0102 has demonstrated powerful induction of TARP-specific killer T-cells in preclinical studies.
  • Entered agreement to license COBRA (Computationally Optimized Broadly Reactive Antigen) antigens from the University of Georgia for use in the development of PDS0202, a novel Versamune®-based universal flu vaccine.
  • Announced temporary administrative suspension of enrollment into the NCI-led study of the PDS0101 triple combination. PDS Biotech continues to be in contact with the NCI. Treatment of already enrolled patients has continued without interruption.
  • Announced the hiring of Matthew Hill as Chief Financial Officer, who has more than 25 years of experience in finance and operational leadership roles for life sciences companies.

“PDS Biotech has continued to build on its momentum from the interim data of the last quarter in 2nd and 3rd line treatment of HPV16-positive anal, cervical, head and neck, vaginal and vulvar cancers,” commented Dr. Frank Bedu-Addo, President and Chief Executive Officer of PDS Biotech. “We have achieved numerous clinical milestones, and formalized agreements with development partners to continue to progress both our Versamune®-based oncology pipeline and our Versamune®-based infectious diseases pipeline. We also welcomed Matthew Hill as our new Chief Financial Officer. Matt has decades of experience as a financial leader in publicly traded life sciences companies and will be a key player in our next phase of growth. The groundwork has been laid for the execution of multiple pipeline development milestones in 2022 and into 2023.”

Third Quarter 2021 Financial Results

PDS Biotech reported a net loss of approximately $7.0 million, or $(0.24) per basic and diluted share, for the three months ended September 30, 2021, compared to a net loss of approximately $3.9 million, or $(0.21) per basic and diluted share, for the three months ended September 30, 2020.

Research and development expenses increased to approximately $3.7 million for the three months ended September 30, 2021 from approximately $2.1 million for the three months ended September 30, 2020. The increase of $1.6 million was primarily attributable to an increase of $0.7 million in personnel costs of which $0.5 million was stock compensation costs, and $0.9 million in costs related to clinical studies.

General and administrative expenses increased to approximately $3.2 million for the three months ended September 30, 2021 from approximately $1.8 million for the three months ended September 30, 2020. The increase of $1.4 million is primarily attributable to an increase in personnel costs of $1.6 million, of which $1.0 million was stock compensation costs and $0.4 million was severance, partially offset by a decrease in professional fees of $0.2 million.

 PDS Biotech’s cash and cash equivalents as of September 30, 2021, were approximately $69.7 million.

Conference Call and Webcast

The conference call is scheduled to begin at 8:00 am ET on Wednesday, November 10, 2021. Participants should dial 877-407-3088 (United States) or 201-389-0927 (International) and mention PDS Biotechnology. A live webcast of the conference call will also be available on the investor relations page of the Company’s corporate website at www.pdsbiotech.com.

After the live webcast, the event will be archived on PDS Biotech’s website for 6 months. In addition, a telephonic replay of the call will be available for 6 months. The replay can be accessed by dialing 877-660-6853 (United States) or 201-612-7415 (International) with confirmation code 13722558.

About PDS Biotechnology

PDS Biotech is a clinical-stage immunotherapy company developing a growing pipeline of cancer immunotherapies based on the Company’s proprietary Versamune® T-cell activating technology platform. Our Versamune®-based products have demonstrated the potential to overcome the limitations of current immunotherapy by inducing in vivo, large quantities of high-quality, highly potent polyfunctional tumor specific CD4+ helper and CD8+ killer T-cells. PDS Biotech has developed multiple therapies, based on combinations of Versamune® and disease-specific antigens, designed to train the immune system to better recognize diseased cells and effectively attack and destroy them. The company’s pipeline products address various cancers including breast, colon, lung, prostate and ovarian cancers. To learn more, please visit www.pdsbiotech.com or follow us on Twitter at @PDSBiotech.

About PDS0101

PDS Biotech’s lead candidate, PDS0101, combines the utility of the Versamune® platform with targeted antigens in HPV-expressing cancers. In partnership with Merck & Co., PDS Biotech is evaluating a combination of PDS0101 and KEYTRUDA® in a Phase 2 study in first-line treatment of recurrent or metastatic head and neck cancer, and also in second line treatment of recurrent or metastatic head and neck cancer in patients who have failed prior checkpoint inhibitor therapy. PDS Biotech is also conducting a Phase 2 clinical study in both second- and third-line treatment of multiple advanced HPV-associated cancers with the National Cancer Institute (NCI). A third phase 2 clinical trial in first line treatment of locally advanced cervical cancer is being performed with The University of Texas, MD Anderson Cancer Center.

Forward Looking Statements

This communication contains forward-looking statements (including within the meaning of Section 21E of the United States Securities Exchange Act of 1934, as amended, and Section 27A of the United States Securities Act of 1933, as amended) concerning PDS Biotechnology Corporation (the “Company”) and other matters. These statements may discuss goals, intentions and expectations as to future plans, trends, events, results of operations or financial condition, or otherwise, based on current beliefs of the Company’s management, as well as assumptions made by, and information currently available to, management. Forward-looking statements generally include statements that are predictive in nature and depend upon or refer to future events or conditions, and include words such as “may,” “will,” “should,” “would,” “expect,” “anticipate,” “plan,” “likely,” “believe,” “estimate,” “project,” “intend,” “forecast,” “guidance”, “outlook” and other similar expressions among others. Forward-looking statements are based on current beliefs and assumptions that are subject to risks and uncertainties and are not guarantees of future performance. Actual results could differ materially from those contained in any forward-looking statement as a result of various factors, including, without limitation: the Company’s ability to protect its intellectual property rights; the Company’s anticipated capital requirements, including the Company’s anticipated cash runway and the Company’s current expectations regarding its plans for future equity financings; the Company’s dependence on additional financing to fund its operations and complete the development and commercialization of its product candidates, and the risks that raising such additional capital may restrict the Company’s operations or require the Company to relinquish rights to the Company’s technologies or product candidates; the Company’s limited operating history in the Company’s current line of business, which makes it difficult to evaluate the Company’s prospects, the Company’s business plan or the likelihood of the Company’s successful implementation of such business plan; the timing for the Company or its partners to initiate the planned clinical trials for PDS0101, PDS0203 and other Versamune® based products; the future success of such trials; the successful implementation of the Company’s research and development programs and collaborations, including any collaboration studies concerning PDS0101, PDS0203 and other Versamune® based products and the Company’s or monitoring committees’ or other third parties’ interpretation of the results and findings of such programs and collaborations and whether such results are sufficient to support the future success of the Company’s product candidates; the success, timing and cost of the Company’s ongoing clinical trials and anticipated clinical trials for the Company’s current product candidates, including statements regarding the timing of initiation, pace of enrollment, significance of milestones, and completion of the trials (including our ability to fully fund our disclosed clinical trials, which assumes no material changes to our currently projected expenses), futility analyses, presentations at conferences and data reported in an abstract, and receipt of interim results, which are not necessarily indicative of the final results of the Company’s ongoing clinical trials; any Company statements about its understanding of product candidates mechanisms of action and interpretation of preclinical and early clinical results from its clinical development programs and any collaboration studies; the acceptance by the market of the Company’s product candidates, if approved; the timing of and the Company’s ability to obtain and maintain U.S. Food and Drug Administration or other regulatory authority approval of, or other action with respect to, the Company’s product candidates; and other factors, including legislative, regulatory, political and economic developments not within the Company’s control, including unforeseen circumstances or other disruptions to normal business operations arising from or related to COVID-19. The foregoing review of important factors that could cause actual events to differ from expectations should not be construed as exhaustive and should be read in conjunction with statements that are included herein and elsewhere, including the risk factors included in the Company’s annual and periodic reports filed with the SEC. The forward-looking statements are made only as of the date of this press release and, except as required by applicable law, the Company undertakes no obligation to revise or update any forward-looking statement, or to make any other forward-looking statements, whether as a result of new information, future events or otherwise.

Media & Investor Relations Contact:

Deanne Randolph
PDS Biotech
Phone: +1 (908) 517-3613
Email: drandolph@pdsbiotech.com

Rich Cockrell
CG Capital
Phone: +1 (404) 736-3838
Email: pdsb@cg.capital


PDS BIOTECHNOLOGY CORPORATION AND SUBSIDIARIES
Condensed Consolidated Balance Sheets

  September 30,
2021
  December 31,
2020
ASSETS (unaudited)    
Current assets:      
Cash and cash equivalents $ 69,744,004     $ 28,839,565  
Prepaid expenses and other   1,596,810       1,497,665  
Total current assets   71,340,814       30,337,230  
           
Property and equipment, net   1,037       5,443  
Operating lease right-to-use asset   406,171       547,706  
           
Total assets $ 71,748,022     $ 30,890,379  
           
LIABILITIES AND STOCKHOLDERS’ EQUITY          
LIABILITIES          
Current liabilities:          
Accounts payable $ 1,445,585     $ 1,415,224  
Accrued expenses   1,923,846       1,735,322  
Operating lease obligation-short term   207,717       119,904  
Total current liabilities   3,577,148       3,270,450  
           
Noncurrent liability:          
Operating lease obligation-long term   313,976       490,353  
           
Total Liabilities $ 3,891,124     $ 3,760,803  
           
STOCKHOLDERS’ EQUITY          
Common stock, $0.00033 par value, 75,000,000 shares authorized at September 30, 2021 and December 31, 2020, 28,435,067 shares and 22,261,619 shares issued and outstanding at September 30, 2021 and December 31, 2020, respectively   9,383       7,346  
Additional paid-in capital   122,231,115       70,907,315  
Accumulated deficit   (54,383,600 )     (43,785,085 )
Total stockholders’ equity   67,856,898       27,129,576  
           
Total liabilities and stockholders’ equity $ 71,748,022     $ 30,890,379  


PDS BIOTECHNOLOGY CORPORATION AND SUBSIDIARIES
Condensed Consolidated Statements of Operations and Comprehensive Loss
(Unaudited)

  Three Months Ended
September 30,
  Nine Months Ended
September 30,
  2021   2020   2021   2020
Operating expenses:              
Research and development expenses $ 3,687,999     $ 2,060,815     $ 7,865,249     $ 5,446,718  
General and administrative expenses   3,274,325       1,846,214       7,252,371       5,428,098  
Total operating expenses   6,962,324       3,907,029       15,117,620       10,874,816  
                       
Loss from operations   (6,962,324 )     (3,907,029 )     (15,117,620 )     (10,874,816 )
                       
Other income:                      
Interest income   1,358       1,207       2,617       54,242  
                       
Loss before income taxes   (6,960,966 )     (3,905,822 )     (15,115,003 )     (10,820,574 )
Benefit from income taxes               4,516,488        
Net loss and comprehensive loss   (6,960,966 )     (3,905,822 )     (10,598,515 )     (10,820,574 )
                       
Per share information:                      
Net loss per share, basic and diluted $ (0.24 )   $ (0.21 )   $ (0.43 )   $ (0.73 )
                       
Weighted average common shares outstanding, basic and diluted   28,425,850       18,961,619       24,639,299       14,892,764  

ESG Ratings Could Miss Problematic Supply Chain Issues


Image Credit: Pixabay (Pexels)

ESG Investing Has a Blind Spot that Puts the $35 Trillion Industry’s Sustainability Promises in Doubt: Supply Chains


If you own stocks, chances are good you have heard the term ESG. It stands for environmental, social and governance, and it’s a way to laud corporate leaders who take sustainability – including climate change – and social responsibility seriously, and ignore those who do not.

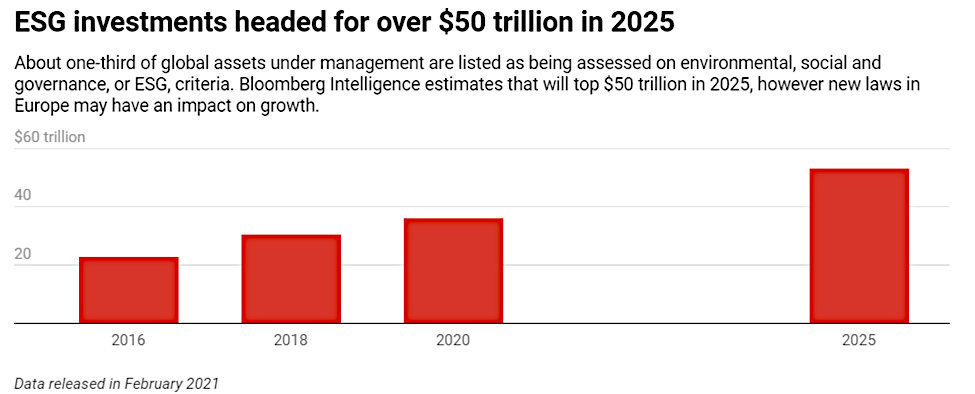
In less than two decades since a United Nations report drew attention to the concept, ESG investing has evolved into a US$35 trillion industry. Money managers overseeing one-third of total U.S. assets under management said they used ESG criteria in 2020, and by 2025 global assets managed in portfolios labeled “ESG” are expected to reach $53 trillion.


This article was republished with permission from The Conversation, a news site dedicated to sharing ideas from academic experts. It was written by and represents the research-based opinions of Tinglong Dai, Professor of Operations Management & Business Analytics, Carey Business School, Johns Hopkins University and Christopher S. Tang, Professor of Supply Chain Management, University of California, Los Angeles.


These investments have gained momentum in part because they cater to investors’ growing desire to have a positive impact on society. By quantifying a company’s actions and outcomes on environmental, social and governance issues, ESG measures offer investors a way to make informed trading decisions.

However, investors’ trust in ESG funds may be misplaced. As scholars in the field of supply chain management and sustainable operations, we see a major flaw in how rating agencies, such as Bloomberg, MSCI and Sustainalytics, are measuring companies’ ESG risk: the performance of their supply chains.


Chart : Bloomberg Intelligence


The Problem with Ignoring Supply Chains

Nearly every company’s operations are backed by a global supply chain that consists of workers, information and resources. To accurately measure a company’s ESG risks, its end-to-end supply chain operations must be considered.

Our recent examination of ESG measures shows that most ESG rating agencies do not measure companies’ ESG performance from the lens of the global supply chains supporting their operations. For example, Bloomberg’s ESG measure lists “supply chain” as an item under the “S” (social) pillar. By this measure, supply chains are treated separately from other items, such as carbon emissions, climate change effects, pollutants, and human rights. This means all those items, if not captured in the ambiguous “supply chain” metric, reflect each company’s own actions but not their supply chain partners.

Even when companies collect their suppliers’ performance, “selective reporting” can arise because there is no unified reporting standard. One recent study found that companies tend to report environmentally responsible suppliers and conceal “bad” suppliers, effectively “greenwashing” their supply chain.

Carbon emissions are another example. Many companies, such as Timberland, have claimed great successes in reducing emissions from their own operations. Yet the emissions from their supply chain partners and customers, known as “Scope 3 emissions,” may remain high. ESG rating agencies have not been able to adequately include Scope 3 emissions because of a lack of data: Only 19% of companies in the manufacturing industry and 22% in the service industry disclose this data.

More broadly, without accounting for a company’s entire supply chain, ESG measures fail to reflect global supply chain networks that today’s big and small companies alike depend on for their day-to-day operations.


Amazon and the Third-Party-Supplier Problem

Amazon, for example, is among ESG funds’ largest and favorite holdings. As a company bigger than Walmart in terms of annual sales, Amazon has reported emissions from shipping that are only one-seventh of Walmart’s. But when researchers for two advocacy groups reviewed public data on imports, they found only about 15% of Amazon’s ocean shipments could be tracked.

In addition, Amazon’s figure does not reflect emissions generated by its many third-party sellers and their suppliers who operate outside the U.S. This difference matters: Whereas Walmart’s supply chain relies on a centralized procurement strategy, Amazon’s supply chain is highly decentralized – a large percentage of its revenue comes from third-party suppliers, about 40% of which sell directly from China, which further complicates emissions tracking and reporting.

Another important ESG metric concerns consumer protection. Amazon prides itself as “Earth’s most customer-centric company.” However, when its customers have been injured by products sold by third-party sellers on its platform, Amazon has argued that it should not be held liable for the damage, because it functions as an “online marketplace” matching buyers and sellers. Amazon’s foreign third-party sellers are often not subject to U.S. jurisdiction so can’t be held accountable.

Yet major ESG rating agencies do not appear to reflect the supply chain implication on customer protection when measuring Amazon supply chain performance.

For example, in 2020, MSCI, the largest ESG ratings agency, upgraded Amazon’s ESG rating from BB to BBB, reflecting its strength in areas such as corporate governance and data security, despite its consumer liability risk.

These gaps are also concerns for ratings of companies such as 3M, ExxonMobil and Tesla.


Other Countries are Adding Pressure

Currently, there is no unified reporting standard, so different companies may cherry-pick certain ESG performance measures to report to boost their sustainability and social ratings.

To improve consistency, the next step would be for ESG rating agencies to redesign their methodology to take into account what may be environmentally harmful and unethical operations across the entire global supply chain. ESG rating agencies could, for example, create incentives for companies to collect and disclose their supply chain partners’ activities, such as Scope 3 emissions.

In June 2021, the German Parliament passed the Supply Chain Due Diligence Act, which will become effective in 2023. Under this new law, large companies based in Germany will be responsible for social and environmental issues arising from their global supply chain networks.

This includes prohibitions on child labor and forced labor and attention to occupational health and safety throughout the entire supply chain. Those who violate the law face a fine of up to 2% of their annual revenues.

The European Union’s new Sustainable Finance Disclosure Regulation, which went into effect in March 2021, adds pressure in a different way. It requires funds to report details on how they integrate ESG characteristics into their investment decisions. That has led some money managers to drop the phrase “ESG integrated” from some of their assets, Bloomberg reported.

Without similar laws in the U.S., we believe ESG rating agencies could fill an important gap. To be sure, surveying a company’s entire supply chain’s ESG performance is far more complex. Yet by tying all the ESG dimensions to a company’s supply chain end-to-end operations, rating agencies can nudge corporate leaders to be responsible for actions across their supply chains that would otherwise be kept in the dark.


Suggested Reading:


What’s an ESG Score?


Five Reasons Investors Increasingly Use ESG Standards


Biofuels, Biodiversity and Climate Change


Can Mining be Green and Sustainable?


Stay up to date. Follow us:


Release – Kelly Reports Third-Quarter 2021 Earnings and Announces Dividend


Kelly® Reports Third-Quarter 2021 Earnings and Announces Dividend


Financial Highlights

  • Q3 revenue up 15.1%; 14.5% in constant currency
  • Q3 operating earnings of $9.0 million; up from a loss a year ago and up 25.9% on an adjusted basis
  • Q3 earnings per share of $0.87 up from $0.42 a year ago; adjusted EPS of $0.25 compared to $0.29

TROY, Mich., Nov. 10, 2021 (GLOBE NEWSWIRE) — Kelly® (Nasdaq: KELYAKELYB), a leading specialty talent solutions provider, today announced results for the third quarter of 2021.

Peter Quigley, president and chief executive officer, announced revenue for the third quarter of 2021 totaled $1.2 billion, a 15.1% increase compared to the corresponding quarter of 2020. Revenue improved year-over-year in the quarter reflecting increased customer demand compared to the COVID-19-impacted prior year period.

Earnings from operations in the third quarter of 2021 totaled $9.0 million, compared to a loss of $2.4 million reported in the third quarter of 2020. Included in the third quarter of 2020 was a $9.5 million charge related to a customer dispute in Mexico. On an adjusted basis, earnings from operations improved 25.9%.

Diluted earnings per share in the third quarter of 2021 were $0.87 compared to $0.42 per share in the third quarter of 2020. Included in the earnings per share is a non-cash gain per share, net of tax, on Kelly’s investment in Persol Holdings common stock of $0.62 in the third quarter of 2021 and $0.29 in the third quarter of 2020. On an adjusted basis, earnings per share were $0.25 in the third quarter of 2021 compared to $0.29 in the corresponding quarter of 2020.

“We’re pleased that all five of our specialty operating segments delivered organic year-over-year gains in the third quarter, contributing to solid revenue and GP dollar growth for the company,” said Quigley, who noted that Kelly has already begun taking actions to better leverage top-line growth heading into 2022. “Demand for our solutions is strong, and we’re finding innovative ways to connect talent and clients in a tight labor market. We’re confident that Kelly’s specialty strategy will continue to deliver top and bottom-line growth throughout the recovery and into the post-COVID environment.”

Kelly also reported that on November 10, its board of directors declared a dividend of $0.05 per share. The dividend is payable on December 8, 2021, to stockholders of record as of the close of business on November 24, 2021.

In conjunction with its third-quarter earnings release, Kelly has published a financial presentation on the Investor Relations page of its public website and will host a conference call at 9 a.m. ET on November 10 to review the results and answer questions. The call may be accessed in one of the following ways:

Via the Internet:
Kellyservices.com

Via the Telephone
(877) 692-8955 (toll free) or (234) 720-6979 (caller paid)
Enter access code 5728672
After the prompt, please enter “#”

A recording of the conference call will be available after 2:30 p.m. ET on November 10, 2021, at (866) 207-1041 (toll-free) and (402) 970-0847 (caller-paid). The access code is 2025741#. The recording will also be available at kellyservices.com during this period.

This release contains statements that are forward looking in nature and, accordingly, are subject to risks and uncertainties. These factors include, but are not limited to, changing market and economic conditions, the recent novel coronavirus (COVID-19) outbreak, competitive market pressures including pricing and technology introductions and disruptions, disruption in the labor market and weakened demand for human capital resulting from technological advances, competition law risks, the impact of changes in laws and regulations (including federal, state and international tax laws), unexpected changes in claim trends on workers’ compensation, unemployment, disability and medical benefit plans, or the risk of additional tax liabilities in excess of our estimates, our ability to achieve our business strategy, our ability to successfully develop new service offerings, material changes in demand from or loss of large corporate customers as well as changes in their buying practices, risks particular to doing business with government or government contractors, the risk of damage to our brand, our exposure to risks associated with services outside traditional staffing, including business process outsourcing, services of licensed professionals and services connecting talent to independent work, our increasing dependency on third parties for the execution of critical functions, our ability to effectively implement and manage our information technology strategy, the risks associated with past and future acquisitions, including risk of related impairment of goodwill and intangible assets, exposure to risks associated with investments in equity affiliates including PersolKelly Pte. Ltd., risks associated with conducting business in foreign countries, including foreign currency fluctuations, the exposure to potential market and currency exchange risks relating to our investment in Persol Holdings, risks associated with violations of anti-corruption, trade protection and other laws and regulations, availability of qualified full-time employees, availability of temporary workers with appropriate skills required by customers, liabilities for employment-related claims and losses, including class action lawsuits and collective actions, our ability to sustain critical business applications through our key data centers, risks arising from failure to preserve the privacy of information entrusted to us or to meet our obligations under global privacy laws, the risk of cyberattacks or other breaches of network or information technology security, our ability to realize value from our tax credit and net operating loss carryforwards, our ability to maintain specified financial covenants in our bank facilities to continue to access credit markets, and other risks, uncertainties and factors discussed in this release and in the Company’s filings with the Securities and Exchange Commission. Actual results may differ materially from any forward-looking statements contained herein, and we undertake no duty to update any forward-looking statement to conform the statement to actual results or changes in the Company’s expectations.

About Kelly®

Kelly Services, Inc. (Nasdaq: KELYA, KELYB) connects talented people to companies in need of their skills in areas including Science, Engineering, Education, Office, Contact Center, Light Industrial, and more. We’re always thinking about what’s next in the evolving world of work, and we help people ditch the script on old ways of thinking and embrace the value of all workstyles in the workplace. We directly employ nearly 370,000 people around the world, and we connect thousands more with work through our global network of talent suppliers and partners in our outsourcing and consulting practice. Revenue in 2020 was $4.5 billion. Visit kellyservices.com and let us help with what’s next for you.

MEDIA CONTACT:     ANALYST CONTACT:
Jane Stehney     James Polehna
(248) 765-6864     (248) 244-4586
stehnja@kellyservices.com     james.polehna@kellyservices.com


KELLY SERVICES, INC. AND SUBSIDIARIES
CONSOLIDATED STATEMENTS OF EARNINGS
FOR THE 13 WEEKS ENDED OCTOBER 3, 2021 AND SEPTEMBER 27, 2020
(UNAUDITED)
(In millions of dollars except per share data)
                %   CC %
    2021   2020   Change   Change   Change
                     
Revenue from services $ 1,195.4     $ 1,038.2     $ 157.2     15.1 %   14.5 %
                     
Cost of services   966.5       847.2       119.3     14.1      
                     
Gross profit   228.9       191.0       37.9     19.8     19.2  
                     
Selling, general and administrative expenses   219.9       193.4       26.5     13.7     13.2  
                     
Earnings (loss) from operations   9.0       (2.4 )     11.4     NM      
                     
Gain (loss) on investment in Persol Holdings   35.5       16.8       18.7     112.0      
                     
Other income (expense), net   (0.3 )     (0.7 )     0.4     50.1      
                     
Earnings (loss) before taxes and equity in net earnings (loss) of affiliate   44.2       13.7       30.5     222.8      
                     
Income tax expense (benefit)   11.1       (1.2 )     12.3     NM      
                     
Net earnings (loss) before equity in net earnings (loss) of affiliate   33.1       14.9       18.2     122.4      
                     
Equity in net earnings (loss) of affiliate   1.7       1.8       (0.1 )   (3.6 )    
                     
Net earnings (loss) $ 34.8     $ 16.7     $ 18.1     108.9      
                     
Basic earnings (loss) per share $ 0.87     $ 0.42     $ 0.45     107.1      
Diluted earnings (loss) per share $ 0.87     $ 0.42     $ 0.45     107.1      
                     
                     
STATISTICS:                    
                     
Permanent placement revenue (included in revenue from services) $ 19.7     $ 9.1     $ 10.6     118.0 %   116.6 %
                     
Gross profit rate   19.2 %     18.4 %     0.8  pts.        
                     
Conversion rate   3.9 %     (1.3 )%     5.2  pts.        
                     
Adjusted EBITDA $ 17.3     $ 13.2     $ 4.1          
Adjusted EBITDA margin   1.4 %     1.3 %     0.1  pts.        
                     
Effective income tax rate   25.2 %     (8.5 )%     33.7  pts.        
                     
Average number of shares outstanding (millions):                    
Basic   39.4       39.3                
Diluted   39.5       39.4                


KELLY SERVICES, INC. AND SUBSIDIARIES
CONSOLIDATED STATEMENTS OF EARNINGS
FOR THE 39 WEEKS ENDED OCTOBER 3, 2021 AND SEPTEMBER 27, 2020
(UNAUDITED)
(In millions of dollars except per share data)
                %   CC %
    2021   2020   Change   Change   Change
                     
Revenue from services $ 3,659.4     $ 3,274.6     $ 384.8     11.8 %   10.3 %
                     
Cost of services   2,986.2       2,671.1       315.1     11.8      
                     
Gross profit   673.2       603.5       69.7     11.5     10.1  
                     
Selling, general and administrative expenses   639.9       591.0       48.9     8.3     7.0  
                     
Goodwill impairment charge         147.7       (147.7 )   NM      
                       
Gain on sale of assets         (32.1 )     32.1     NM      
                       
Earnings (loss) from operations   33.3       (103.1 )     136.4     NM      
                       
Gain (loss) on investment in Persol Holdings   71.8       (31.4 )     103.2     NM      
                     
Other income (expense), net   (4.0 )     3.6       (7.6 )   (211.5 )    
                     
Earnings (loss) before taxes and equity in net earnings (loss) of affiliate   101.1       (130.9 )     232.0     NM      
                       
Income tax expense (benefit)   19.0       (36.5 )     55.5     152.0      
                       
Net earnings (loss) before equity in net earnings (loss) of affiliate   82.1       (94.4 )     176.5     NM      
                       
Equity in net earnings (loss) of affiliate   2.3       (1.0 )     3.3     NM      
                       
Net earnings (loss) $ 84.4     $ (95.4 )   $ 179.8     NM      
                       
Basic earnings (loss) per share $ 2.12     $ (2.43 )   $ 4.55     NM      
Diluted earnings (loss) per share $ 2.12     $ (2.43 )   $ 4.55     NM      
                     
                     
STATISTICS:                    
                     
Permanent placement revenue (included in revenue from services) $ 54.3     $ 28.9     $ 25.4     87.8 %   84.5 %
                     
Gross profit rate   18.4 %     18.4 %      pts.        
                     
Conversion rate   4.9 %     (17.1 )%     22.0  pts.        
                     
Adjusted EBITDA $ 56.4     $ 48.6     $ 7.8          
Adjusted EBITDA margin   1.5 %     1.5 %      pts.        
                     
Effective income tax rate   18.8 %     27.9 %     (9.1 ) pts.        
                     
Average number of shares outstanding (millions):                    
Basic   39.4       39.3                
Diluted   39.5       39.3                


KELLY SERVICES, INC. AND SUBSIDIARIES
RESULTS OF OPERATIONS BY SEGMENT
(UNAUDITED)
(In millions of dollars)
                   
    Third Quarter
                   
              %   CC %
    2021     2020   Change   Change
Professional & Industrial                  
Revenue from services $ 452.6     $ 446.5     1.4 %   1.0 %
Gross profit   76.6       77.1     (0.5 )   (0.9 )
SG&A expenses excluding restructuring charges   69.4       65.4     6.2     5.9  
Restructuring charges         (0.1 )   NM     NM  
Total SG&A expenses   69.4       65.3     6.2     5.9  
Earnings (loss) from operations   7.2       11.8     (38.1 )      
Earnings (loss) from operations excluding restructuring charges   7.2       11.7     (38.1 )      
                       
Gross profit rate   16.9 %     17.3 %   (0.4 ) pts.      
                       
Science, Engineering & Technology                      
Revenue from services $ 306.2     $ 244.0     25.5 %   25.3 %
Gross profit   68.1       50.7     34.5     34.4  
SG&A expenses excluding restructuring charges   48.4       31.3     54.8     54.6  
Restructuring charges             NM     NM  
Total SG&A expenses   48.4       31.3     54.8     54.6  
Earnings (loss) from operations   19.7       19.4     1.7      
Earnings (loss) from operations excluding restructuring charges   19.7       19.4     1.7      
                   
Gross profit rate   22.3 %     20.8 %   1.5  pts.    
                   
Education                  
Revenue from services $ 66.6     $ 27.5     142.1 %   142.1 %
Gross profit   10.0       4.1     139.7     139.7  
SG&A expenses excluding restructuring charges   17.0       11.6     45.9     45.9  
Restructuring charges             NM     NM  
Total SG&A expenses   17.0       11.6     46.1     46.1  
Earnings (loss) from operations   (7.0 )     (7.5 )   6.6      
Earnings (loss) from operations excluding restructuring charges   (7.0 )     (7.5 )   6.7      
                   
Gross profit rate   15.1 %     15.2 %   (0.1 ) pts.    
                   
Outsourcing & Consulting                  
Revenue from services $ 113.4     $ 87.9     29.1 %   28.6 %
Gross profit   37.3       29.1     27.9     26.9  
SG&A expenses excluding restructuring charges   30.7       25.4     20.5     19.8  
Restructuring charges             NM     NM  
Total SG&A expenses   30.7       25.4     20.5     19.7  
Earnings (loss) from operations   6.6       3.7     79.1        
Earnings (loss) from operations excluding restructuring charges   6.6       3.7     78.7        
                       
Gross profit rate   32.8 %     33.1 %   (0.3 ) pts.      
                       
International                      
Revenue from services $ 256.8     $ 232.4     10.5 %   8.8 %
Gross profit   36.9       30.0     22.7     21.0  
SG&A expenses excluding restructuring charges   34.5       39.9     (13.6 )   (14.8 )
Restructuring charges             NM     NM  
Total SG&A expenses   34.5       39.9     (13.6 )   (14.8 )
Earnings (loss) from operations   2.4       (9.9 )   NM        
Earnings (loss) from operations excluding restructuring charges   2.4       (9.9 )   NM      
                   
Gross profit rate   14.4 %     12.9 %   1.5  pts.    


KELLY SERVICES, INC. AND SUBSIDIARIES
RESULTS OF OPERATIONS BY SEGMENT
(UNAUDITED)
(In millions of dollars)
                   
    September Year to Date
                   
              %   CC %
    2021     2020   Change   Change
Professional & Industrial                  
Revenue from services $ 1,386.7     $ 1,346.7     3.0 %   2.5 %
Gross profit   227.7       241.1     (5.5 )   (6.0 )
SG&A expenses excluding restructuring charges   207.8       206.1     0.8     0.5  
Restructuring charges         4.3     NM     NM  
Total SG&A expenses   207.8       210.4     (1.2 )   (1.6 )
Earnings (loss) from operations   19.9       30.7     (34.9 )    
Earnings (loss) from operations excluding restructuring charges   19.9       35.0     (43.0 )    
                   
Gross profit rate   16.4 %     17.9 %   (1.5 ) pts.    
                   
Science, Engineering & Technology                  
Revenue from services $ 859.1     $ 761.5     12.8 %   12.6 %
Gross profit   187.8       156.0     20.4     20.2  
SG&A expenses excluding restructuring charges   131.0       98.6     32.9     32.7  
Restructuring charges         0.5     NM     NM  
Total SG&A expenses   131.0       99.1     32.2     32.0  
Earnings (loss) from operations   56.8       56.9     (0.2 )      
Earnings (loss) from operations excluding restructuring charges   56.8       57.4     (1.1 )      
                       
Gross profit rate   21.9 %     20.5 %   1.4  pts.      
                       
Education                      
Revenue from services $ 284.1     $ 195.1     45.6 %   45.6 %
Gross profit   44.0       28.8     52.5     52.5  
SG&A expenses excluding restructuring charges   46.5       36.9     26.0     26.0  
Restructuring charges         0.8     NM     NM  
Total SG&A expenses   46.5       37.7     23.1     23.1  
Earnings (loss) from operations   (2.5 )     (8.9 )   72.1      
Earnings (loss) from operations excluding restructuring charges   (2.5 )     (8.1 )   69.0      
                   
Gross profit rate   15.5 %     14.8 %   0.7  pts.    
                   
Outsourcing & Consulting                  
Revenue from services $ 320.0     $ 261.0     22.6 %   21.2 %
Gross profit   103.4       87.1     18.7     16.3  
SG&A expenses excluding restructuring charges   89.2       79.1     12.7     10.9  
Restructuring charges             NM     NM  
Total SG&A expenses   89.2       79.1     12.6     10.8  
Earnings (loss) from operations   14.2       8.0     79.0        
Earnings (loss) from operations excluding restructuring charges   14.2       8.0     77.5        
                       
Gross profit rate   32.3 %     33.4 %   (1.1 ) pts.      
                       
International                      
Revenue from services $ 810.1     $ 710.6     14.0 %   9.0 %
Gross profit   110.3       90.5     21.8     16.3  
SG&A expenses excluding restructuring charges   102.2       100.3     1.8     (2.8 )
Restructuring charges         1.1     NM     NM  
Total SG&A expenses   102.2       101.4     0.7     (3.9 )
Earnings (loss) from operations   8.1       (10.9 )   NM        
Earnings (loss) from operations excluding restructuring charges   8.1       (9.8 )   NM        
                   
Gross profit rate   13.6 %     12.7 %   0.9  pts.    


KELLY SERVICES, INC. AND SUBSIDIARIES
CONSOLIDATED BALANCE SHEETS
(UNAUDITED)
(In millions of dollars)
             
    October 3, 2021   January 3, 2021   September 27, 2020
Current Assets            
Cash and equivalents $ 43.5   $ 223.0   $ 248.2  
Trade accounts receivable, less allowances of            
$12.3, $13.3, and $11.4, respectively   1,423.9     1,265.2     1,111.4  
Prepaid expenses and other current assets   71.0     61.4     71.4  
Total current assets   1,538.4     1,549.6     1,431.0  
             
Noncurrent Assets            
Property and equipment, net   36.1     41.0     40.8  
Operating lease right-of-use assets   79.3     83.2     84.0  
Deferred taxes   304.0     282.0     273.3  
Goodwill, net   114.8     3.5      
Investment in Persol Holdings   222.6     164.2     145.8  
Investment in equity affiliate   122.0     118.5     115.6  
Other assets   386.3     319.9     301.2  
Total noncurrent assets   1,265.1     1,012.3     960.7  
             
Total Assets $ 2,803.5   $ 2,561.9   $ 2,391.7  
             
Current Liabilities            
Short-term borrowings $   $ 0.3   $ 0.5  
Accounts payable and accrued liabilities   645.2     536.8     458.4  
Operating lease liabilities   18.4     19.6     19.5  
Accrued payroll and related taxes   334.9     293.0     240.7  
Accrued workers’ compensation and other claims   21.1     22.7     25.0  
Income and other taxes   58.4     53.2     52.4  
Total current liabilities   1,078.0     925.6     796.5  
             
Noncurrent Liabilities            
Operating lease liabilities   64.1     67.5     68.1  
Accrued payroll and related taxes   58.2     58.5     75.7  
Accrued workers’ compensation and other claims   39.1     42.2     44.4  
Accrued retirement benefits   213.5     205.8     188.2  
Other long-term liabilities   76.5     59.3     52.7  
Total noncurrent liabilities   451.4     433.3     429.1  
             
Stockholders’ Equity            
Common stock   40.1     40.1     40.1  
Treasury stock   (15.2 )   (17.1 )   (17.2 )
Paid-in capital   23.2     21.3     20.6  
Earnings invested in the business   1,245.3     1,162.9     1,139.5  
Accumulated other comprehensive income (loss)   (19.3 )   (4.2 )   (16.9 )
Total stockholders’ equity   1,274.1     1,203.0     1,166.1  
             
Total Liabilities and Stockholders’ Equity $ 2,803.5   $ 2,561.9   $ 2,391.7  
             
STATISTICS:            
Working Capital $ 460.4   $ 624.0   $ 634.5  
Current Ratio   1.4     1.7     1.8  
Debt-to-capital %   0.0 %   0.0 %   0.0 %
Global Days Sales Outstanding   63     64     61  
Year-to-Date Free Cash Flow $ 23.5   $ 170.5   $ 204.2  


KELLY SERVICES, INC. AND SUBSIDIARIES
CONSOLIDATED STATEMENTS OF CASH FLOWS
FOR THE 39 WEEKS ENDED OCTOBER 3, 2021 AND SEPTEMBER 27, 2020
(UNAUDITED)
(In millions of dollars)
    2021   2020
Cash flows from operating activities:        
Net earnings (loss) $ 84.4   $ (95.4 )
Adjustments to reconcile net earnings (loss) to net cash from operating activities:        
Goodwill impairment charge       147.7  
Deferred income taxes on goodwill impairment charge       (23.0 )
Depreciation and amortization   22.0     18.0  
Operating lease asset amortization   16.0     15.9  
Provision for credit losses and sales allowances   0.8     10.7  
Stock-based compensation   4.0     2.9  
(Gain) loss on investment in Persol Holdings   (71.8 )   31.4  
Gain on sale of assets       (32.1 )
Equity in net (earnings) loss of PersolKelly Pte. Ltd.   (2.3 )   1.0  
Other, net   4.6     1.8  
Changes in operating assets and liabilities, net of acquisitions   (26.7 )   137.6  
         
Net cash from operating activities   31.0     216.5  
         
Cash flows from investing activities:        
Capital expenditures   (7.5 )   (12.3 )
Proceeds from sale of assets       55.5  
Acquisition of companies, net of cash received   (213.0 )   (36.4 )
Proceeds from company-owned life insurance   10.4     2.3  
Proceeds from sale of Brazil, net of cash disposed       1.2  
Proceeds from loans with equity affiliate   5.8      
Proceeds from (investment in) equity securities   5.0     (0.2 )
Other investing activities   0.9     0.2  
         
Net cash (used in) from investing activities   (198.4 )   10.3  
         
Cash flows from financing activities:        
Net change in short-term borrowings   (0.2 )   (1.5 )
Financing lease payments   (1.3 )   (1.0 )
Dividend payments   (2.0 )   (3.0 )
Payments of tax withholding for stock awards   (0.6 )   (1.2 )
Contingent consideration payments   (1.6 )    
Other financing activities       (0.1 )
         
Net cash used in financing activities   (5.7 )   (6.8 )
         
Effect of exchange rates on cash, cash equivalents and restricted cash   (3.9 )   3.4  
         
Net change in cash, cash equivalents and restricted cash   (177.0 )   223.4  
Cash, cash equivalents and restricted cash at beginning of period   228.1     31.0  
         
Cash, cash equivalents and restricted cash at end of period $ 51.1   $ 254.4  


KELLY SERVICES, INC. AND SUBSIDIARIES
REVENUE FROM SERVICES BY GEOGRAPHY
(UNAUDITED)
(In millions of dollars)
                 
    Third Quarter
                 
            %   CC %
    2021   2020   Change   Change
                 
Americas                
United States $ 851.7   $ 740.6     15.0 %   15.0 %
Canada   43.3     30.3     42.8     35.1  
Puerto Rico   25.5     18.4     39.2     39.2  
Mexico   14.4     27.4     (47.4 )   (52.7 )
Brazil       1.8     NM     NM  
Total Americas Region   934.9     818.5     14.2     13.8  
                 
Europe                
France   56.3     48.8     15.4     14.3  
Switzerland   54.5     49.6     10.0     9.8  
Portugal   36.6     31.7     15.6     14.6  
Russia   33.0     27.2     21.3     21.1  
Italy   18.5     14.5     27.5     26.4  
United Kingdom   17.2     16.4     4.5     (2.1 )
Germany   9.0     7.0     28.2     27.3  
Ireland   7.4     4.9     49.9     48.8  
Other   17.3     12.0     44.4     43.0  
Total Europe Region   249.8     212.1     17.8     16.6  
                 
Total Asia-Pacific Region   10.7     7.6     41.4     39.3  
                 
Total Kelly Services, Inc. $ 1,195.4   $ 1,038.2     15.1 %   14.5 %


KELLY SERVICES, INC. AND SUBSIDIARIES
REVENUE FROM SERVICES BY GEOGRAPHY
(UNAUDITED)
(In millions of dollars)
                 
    September Year to Date
                 
            %   CC %
    2021   2020   Change   Change
                 
Americas                
United States $ 2,604.8   $ 2,369.2     9.9 %   9.9 %
Canada   116.9     88.7     31.8     21.9  
Mexico   82.1     78.6     4.5     (1.8 )
Puerto Rico   76.6     56.1     36.6     36.6  
Brazil       17.0     NM     NM  
Total Americas Region   2,880.4     2,609.6     10.4     9.8  
                 
Europe                
France   168.1     141.2     19.0     11.9  
Switzerland   161.2     141.2     14.2     9.6  
Portugal   120.9     99.1     22.0     14.5  
Russia   99.3     88.6     12.1     17.5  
Italy   56.0     42.5     31.7     23.9  
United Kingdom   51.9     56.5     (8.2 )   (15.8 )
Germany   24.6     22.1     11.3     5.1  
Ireland   18.8     14.0     34.1     26.8  
Other   49.9     38.7     29.0     21.6  
Total Europe Region   750.7     643.9     16.6     11.6  
                 
Total Asia-Pacific Region   28.3     21.1     33.9     24.9  
                 
Total Kelly Services, Inc. $ 3,659.4   $ 3,274.6     11.8 %   10.3 %


KELLY SERVICES, INC. AND SUBSIDIARIES
RECONCILIATION OF NON-GAAP MEASURES
THIRD QUARTER
(UNAUDITED)
(In millions of dollars)
       
  2021   2020
SG&A Expenses: As Reported   Restructuring(5)   Adjusted   Adjusted
Professional & Industrial $ 69.4     $     $ 69.4     $ 65.4  
Science, Engineering & Technology 48.4         48.4     31.3  
Education 17.0         17.0     11.6  
Outsourcing & Consulting 30.7         30.7     25.4  
International 34.5         34.5     30.4  
Corporate 19.9     0.1     20.0     19.9  
Total Company $ 219.9     $ 0.1     $ 220.0     $ 184.0  


  2021   2020
Earnings (loss) from Operations: As Reported   Restructuring(5)   Adjusted   Adjusted
Professional & Industrial $ 7.2     $     $ 7.2     $ 11.7  
Science, Engineering & Technology 19.7         19.7     19.4  
Education (7.0 )       (7.0 )   (7.5 )
Outsourcing & Consulting 6.6         6.6     3.7  
International 2.4         2.4     (0.4 )
Corporate (19.9 )   (0.1 )   (20.0 )   (19.9 )
Total Company $ 9.0     $ (0.1 )   $ 8.9     $ 7.0  


KELLY SERVICES, INC. AND SUBSIDIARIES
RECONCILIATION OF NON-GAAP MEASURES
THIRD QUARTER
(UNAUDITED)
(In millions of dollars)
               
  2020
SG&A Expenses: As Reported   Customer Dispute(4)   Restructuring(5)   Adjusted
Professional & Industrial $ 65.3     $     $ 0.1     $ 65.4  
Science, Engineering & Technology 31.3             31.3  
Education 11.6             11.6  
Outsourcing & Consulting 25.4             25.4  
International 39.9     (9.5 )       30.4  
Corporate 19.9             19.9  
Total Company $ 193.4     $ (9.5 )   $ 0.1     $ 184.0  


  2020
Earnings (loss) from Operations: As Reported   Customer Dispute(4)   Restructuring(5)   Adjusted
Professional & Industrial $ 11.8     $     $ (0.1 )   $ 11.7  
Science, Engineering & Technology 19.4             19.4  
Education (7.5 )           (7.5 )
Outsourcing & Consulting 3.7             3.7  
International (9.9 )   9.5         (0.4 )
Corporate (19.9 )           (19.9 )
Total Company $ (2.4 )   $ 9.5     $ (0.1 )   $ 7.0  


KELLY SERVICES, INC. AND SUBSIDIARIES
RECONCILIATION OF NON-GAAP MEASURES
SEPTEMBER YEAR TO DATE
(UNAUDITED)
(In millions of dollars)
               
  2021   2020
SG&A Expenses: As Reported   Restructuring(5)   Adjusted   Adjusted
Professional & Industrial $ 207.8     $     $ 207.8     $ 206.1  
Science, Engineering & Technology 131.0         131.0     98.6  
Education 46.5         46.5     36.9  
Outsourcing & Consulting 89.2         89.2     79.1  
International 102.2         102.2     90.8  
Corporate 63.2     0.1     63.3     61.6  
Total Company $ 639.9     $ 0.1     $ 640.0     $ 573.1  


  2021   2020
Earnings (loss) from Operations: As Reported   Restructuring(5)   Adjusted   Adjusted
Professional & Industrial $ 19.9     $     $ 19.9     $ 35.0  
Science, Engineering & Technology 56.8         56.8     57.4  
Education (2.5 )       (2.5 )   (8.1 )
Outsourcing & Consulting 14.2         14.2     8.0  
International 8.1         8.1     (0.3 )
Corporate (63.2 )   (0.1 )   (63.3 )   (61.6 )
Total Company $ 33.3     $ (0.1 )   $ 33.2     $ 30.4  


KELLY SERVICES, INC. AND SUBSIDIARIES
RECONCILIATION OF NON-GAAP MEASURES
SEPTEMBER YEAR TO DATE
(UNAUDITED)
(In millions of dollars)
 
  2020
SG&A Expenses: As Reported   Customer Dispute(4)   Restructuring(5)   Adjusted
Professional & Industrial $ 210.4     $     $ (4.3 )   $ 206.1  
Science, Engineering & Technology 99.1         (0.5 )   98.6  
Education 37.7         (0.8 )   36.9  
Outsourcing & Consulting 79.1             79.1  
International 101.4     (9.5 )   (1.1 )   90.8  
Corporate 63.3         (1.7 )   61.6  
Total Company $ 591.0     $ (9.5 )   $ (8.4 )   $ 573.1  


  2020
Earnings (loss) from Operations: As Reported   Goodwill impairment(1)   Gain on sale
of assets(3)
  Customer Dispute(4)   Restructuring(5)   Adjusted
Professional & Industrial $ 30.7     $     $     $     $ 4.3     $ 35.0  
Science, Engineering & Technology 56.9                 0.5     57.4  
Education (8.9 )               0.8     (8.1 )
Outsourcing & Consulting 8.0                     8.0  
International (10.9 )           9.5     1.1     (0.3 )
Corporate (178.9 )   147.7     (32.1 )       1.7     (61.6 )
Total Company $ (103.1 )   $ 147.7     $ (32.1 )   $ 9.5     $ 8.4     $ 30.4  


KELLY SERVICES, INC. AND SUBSIDIARIES
RECONCILIATION OF NON-GAAP MEASURES
(UNAUDITED)
(In millions of dollars except per share data)
                 
                 
    Third Quarter   September Year to Date
    2021   2020   2021   2020
Income tax expense (benefit)   $ 11.1     $ (1.2 )   $ 19.0     $ (36.5 )
Taxes on goodwill impairment charge(1)               23.0  
Taxes on investment in Persol Holdings(2)   (10.9 )   (5.2 )   (22.0 )   9.6  
Taxes on gain on sale of assets(3)               (8.1 )
Taxes on customer dispute(4)       2.8         2.8  
Taxes on restructuring charges(5)               2.2  
Adjusted income tax expense (benefit)   $ 0.2     $ (3.6 )   $ (3.0 )   $ (7.0 )
                 
    Third Quarter   September Year to Date
    2021   2020   2021   2020
Net earnings (loss)   $ 34.8     $ 16.7     $ 84.4     $ (95.4 )
Goodwill impairment charge, net of taxes(1)               124.7  
(Gain) loss on investment in Persol Holdings, net of taxes(2)   (24.6 )   (11.6 )   (49.8 )   21.8  
(Gain) loss on sale of assets, net of taxes(3)       0.1         (23.9 )
Customer dispute, net of taxes(4)       6.7         6.7  
Restructuring charges, net of taxes(5)   (0.1 )   (0.1 )   (0.1 )   6.2  
Adjusted net earnings   $ 10.1     $ 11.8     $ 34.5     $ 40.1  
                 
    Third Quarter   September Year to Date
    2021   2020   2021   2020
    Per Share   Per Share
Net earnings (loss)   $ 0.87     $ 0.42     $ 2.12     $ (2.43 )
Goodwill impairment charge, net of taxes(1)               3.18  
(Gain) loss on investment in Persol Holdings, net of taxes(2)   (0.62 )   (0.29 )   (1.25 )   0.56  
Gain on sale of assets, net of taxes(3)               (0.61 )
Customer dispute, net of taxes(4)       0.17         0.17  
Restructuring charges, net of taxes(5)               0.16  
Adjusted net earnings   $ 0.25     $ 0.29     $ 0.86     $ 1.02  

Note: Earnings per share amounts for each quarter are required to be computed independently and may not equal the amounts computed for the total year.


KELLY SERVICES, INC. AND SUBSIDIARIES
RECONCILIATION OF NON-GAAP MEASURES
(UNAUDITED)
(In millions of dollars)
               
  Third Quarter   September Year to Date
  2021   2020   2021   2020
Net earnings (loss) $ 34.8     $ 16.7     $ 84.4     $ (95.4 )
Other (income) expense, net 0.3     0.7     4.0     (3.6 )
Income tax expense (benefit) 11.1     (1.2 )   19.0     (36.5 )
Depreciation and amortization 8.4     6.2     23.2     18.2  
EBITDA 54.6     22.4     130.6     (117.3 )
Equity in net (earnings) loss of affiliate (1.7 )   (1.8 )   (2.3 )   1.0  
Goodwill impairment charge(1)             147.7  
(Gain) loss on investment in Persol Holdings(2) (35.5 )   (16.8 )   (71.8 )   31.4  
Gain on sale of assets(3)             (32.1 )
Customer dispute(4)     9.5         9.5  
Restructuring(5) (0.1 )   (0.1 )   (0.1 )   8.4  
Adjusted EBITDA $ 17.3     $ 13.2     $ 56.4     $ 48.6  
Adjusted EBITDA margin 1.4 %   1.3 %   1.5 %   1.5 %


KELLY SERVICES, INC. AND SUBSIDIARIES
RECONCILIATION OF NON-GAAP MEASURES
(UNAUDITED)

Management believes that the non-GAAP (Generally Accepted Accounting Principles) information excluding the 2020 goodwill impairment charge, the 2021 and 2020 gains and losses on the investment in Persol Holdings, the 2020 gain on sale of assets, the 2020 customer dispute and the 2020 restructuring charges, are useful to understand the Company’s fiscal 2021 financial performance and increases comparability. Specifically, Management believes that removing the impact of these items allows for a meaningful comparison of current period operating performance with the operating results of prior periods. Management also believes that such measures are used by those analyzing performance of companies in the staffing industry to compare current performance to prior periods and to assess future performance.

Management uses Adjusted EBITDA (adjusted earnings before interest, taxes, depreciation and amortization) and Adjusted EBITDA Margin (percent of total GAAP revenue) which Management believes is useful to compare operating performance compared to prior periods and uses it in conjunction with GAAP measures to assess performance. Our calculation of Adjusted EBITDA may not be consistent with similarly titled measures of other companies and should be used in conjunction with GAAP measurements.

These non-GAAP measures may have limitations as analytical tools because they exclude items which can have a material impact on cash flow and earnings per share. As a result, Management considers these measures, along with reported results, when it reviews and evaluates the Company’s financial performance. Management believes that these measures provide greater transparency to investors and provide insight into how Management is evaluating the Company’s financial performance. Non-GAAP measures should not be considered a substitute for, or superior to, measures of financial performance prepared in accordance with GAAP.

(1) The goodwill impairment charge is the result of an interim impairment test the Company performed during the first quarter of 2020, due to a triggering event caused by a decline in the Company’s common stock price.

(2) The gains and losses on the investment in Persol Holdings represent the change in fair value of the investment during the period presented and the related tax expense and benefit.

(3) Gain on sale of assets in 2020 primarily represents the excess of the proceeds over the cost of the headquarters properties sold during the first quarter of 2020.

(4) Customer dispute represents a non-cash charge in Mexico to increase the reserve against a long-term receivable from a former customer based on an updated probability of loss assessment.

(5) Restructuring charges in 2020 and subsequent adjustments in 2021 represent severance costs and lease terminations in preparation for the new operating model adopted in the third quarter of 2020.

CPI and PPI Both Suggests Persistent Inflation


The Last Time Inflation Was This High Fed Funds Were 14.5%


The year-over-year inflation rate ending October, as measured by CPI-U, is 6.2%. During the month of October alone, prices rose nearly 1% (0.9%). This is the largest increase since July 1982. And yesterday’s PPI report suggests consumer inflation may be persistent. The question now is, will Fed Chairman Powell continue extending the length of time in his definition of “transitory,” and will the Fed move quicker than initially presented to pull in the price pressures that continue to surprise on the high side?

October CPI Data

  • October Consumer Price Index (CPI-U): +0.9% vs. +0.5% consensus and +0.4% prior.
  • +6.2% YOY vs. +5.8% consensus and +5.4% prior.
  • Core CPI:
     +0.6% vs. +0.4% consensus and +0.2% prior.
  • +4.6% YoY vs. +4.3% consensus and +4.0% prior.
  • The increases are broad-based, with continued increases in energy, shelter, food, used cars, and new vehicles.

By itself, the rampant rise in prices does not necessarily argue against Chairman Powell’s expectations that what the U.S. is experiencing is the result of bottlenecks that will begin to fade. But, investors do have to stay aware of market expectations, even if they deviate from the Federal Reserve Bank chairman’s mindset – and with each new inflation report, market participants are questioning it more. 

The question for investors of all stripes (stocks, bonds, precious metals, real estate, crypto, etc.) is whether the Fed will show less patience than it has to date and act soon to tighten economic activity.

A Fed tightening in the form of targeting higher overnight bank rates and slowing the pace of bond purchases (tapering) would not necessarily be bad for stock investors but could signal the end of easy money, which many believe has been the tailwind behind the substantial growth in stocks. As for current bond portfolios, they would experience their bond values decline as newer investors would expect higher returns on their bond investments. Bond prices would be present-valued for the new rate environment, which mathematically pushes values down (rates up).

If Powell is wrong on inflation being transitory, or if the Fed keeps lengthening their definition of what that means, holding rates down could cause larger problems down the road. Recent indications are that the inflation growth we’re seeing now could stay in the manufacturing pipeline a while.

Manufacturing Pipeline Inflation

Yesterday the Producer Price Index (PPI) was reported for October. PPI measures the increases at the producer not consumer level. These are input costs at various stages of manufacturing that are part of the pipeline. These either work their way into consumer prices months later, or serve to hurt corporate profits. Part of the series of numbers in the PPI release is PPI Final Demand. This covers the input prices for consumer-facing industries whose prices go on to enter headline CPI. As reported yesterday (November 9), the PPI Final Demand jumped by 0.6% in October from September. This means the year-over-year increase is 8.6% (same as September). These are the biggest jumps in this data going back to eleven years.

This high PPI Final Demand number suggests future CPI releases could easily continue climbing into next year.

Take-Away

The one-year inflation rate for the period ending October 31, 2021, is 6.2%. Investors that did not earn 6.2% or more on their money will find they have lower purchasing power today. While the Federal Reserve stimulus is slowing, earlier this month, the Fed Chairman reiterated the term transitory in relation to his future price expectations. He also left the window open to act sooner if this expectation changes.

For perspective, the last time year-over-year inflation was this high was July of 1982; Fed Funds traded at 14.5%. By October of that year, inflation had fallen and was running at a 5% pace. With the new lower pace, then Chairman Volcker reduced the overnight Fed Funds rate to 9%.

Stay up to date on market-moving information by registering (no cost) for Channelchek email.

Paul Hoffman

Managing Editor, Channelchek


Suggested Reading:


Inflation Seems Persistent, What Now?


Deflation Not Inflation is Risk Says Cathie Wood


The Fed is Clear that they Intend to Hold Rates Down


The Limits of Government Economic Tinkering (July 2020)


Sources:

https://www.bls.gov/news.release/cpi.nr0.htm

https://www.providentmetals.com/knowledge-center/precious-metals-resources/inflation-precious-metals.html#:~:text=Unlike%20paper%20currency%20and%20stocks,general%20health%20of%20the%20economy.

https://www.bls.gov/ppi/

https://www.federalreservehistory.org/essays/recession-of-1981-82


Stay up to date. Follow us:


Release – Voyager Digital Surpasses One Million Funded Accounts


Voyager Digital Surpasses One Million Funded Accounts


Funded accounts grew 23x since December 31, 2020 as marketing initiatives take hold

Voyager Digital Ltd. (“Voyager” or the “Company”) (TSX: VOYG; OTCQX: VYGVF; FRA: UCD2), one of the fastest-growing, publicly traded cryptocurrency platforms in the United States, today announced it surpassed one million funded accounts on its platform, an increase of 23 times from December 31, 2020 when it had 43,000 funded accounts, and an increase of 135,000 funded accounts from September 30, 2021. The Company also announced it surpassed 2.7 million verified users.
 
“Reaching one million funded accounts is an incredible milestone for Voyager,” said Steve Ehrlich, CEO and co-founder of Voyager. “Our strategy of focusing on our loyalty program and on customer acquisition in the September quarter paid off extremely well for us as we continue to gain market share reflected by our increased App Store rankings.”
 
In a little over ten months, Voyager entered into significant marketing partnerships, including partnering with professional athletes Landon Cassill and Rob Gronkowski, and a five-year integrated partnership with the Dallas Mavericks. In addition, Voyager recently partnered with Fundstrat and its renowned and award-winning co-founder and industry expert Tom Lee, and Market Rebellion led by Jon and Pete Najarian.
 
“Our focus on the Voyager community and building a robust loyalty program benefiting consumers separates Voyager from the competition,” said Mr. Ehrlich. “As crypto continues to gain mainstream traction, we keep enhancing the Voyager app with valuable wealth-building tools to truly make crypto accessible for all.”
 
About Voyager Digital Ltd.
Voyager Digital Ltd. (TSX: VOYG; OTCQX: VYGVF; FRA: UCD2) is a fast-growing, publicly traded cryptocurrency platform in the United States founded in 2018 to bring choice, transparency, and cost efficiency to the marketplace. Voyager offers a secure way to trade over 60 different crypto assets using its easy-to-use mobile application, and earn rewards up to 12 percent annually on more than 30 cryptocurrencies. Through its subsidiary Coinify ApS, Voyager provides crypto payment solutions for both consumers and merchants around the globe. To learn more about the company, please visit https://www.investvoyager.com.
 
The TSX has not approved or disapproved of the information contained herein.
 
SOURCE Voyager Digital, Ltd.

Press Contacts
 
Voyager Digital, Ltd.
Michael Legg
Chief Communications Officer
(212) 547-8807
mlegg@investvoyager.com

Voyager Public Relations Team
pr@investvoyager.com

Release – Allegiant Appoints Gordon Bogden As Chairman Of The Board


Allegiant Appoints Gordon Bogden As Chairman Of The Board


Reno, Nevada /November 10, 2021 – Allegiant Gold Ltd. (“Allegiant” or the “Company”) (AUAU: TSX-V) (AUXXF: OTCQX) today announced that Gordon Bogden will assume the role of Chairman of the Board of Allegiant effective immediately.

Mr. Bogden is a Senior Advisor and member of the Advisory Board of Origin Merchant Partners and the Founder and Chairman of Black Loon Group, a private mining investment and financial advisory company. He began his professional career as an engineer and geophysicist moving on to CIBC World Markets as a mining investment banker, then to N.M. Rothschild Canada, Newcrest Capital Inc., and National Bank Financial, advising on over $20 billion of M&A and capital markets transactions. Gordon retired from investment banking in 2012 after the acquisition of Gryphon Partners, where he was a Co-Founder and Managing Partner, by Standard Chartered Bank. Gordon is a former director of several public mining companies including Royal Gold, Inc., IAMGOLD Corporation, International Royalty Corporation (acquired by Royal Gold, Inc.), Volta Resources Inc. (acquired by B2Gold Corp.), Orvana Minerals Corp., Canplats Resources Corp. (acquired by Goldcorp Inc. He is the past Chairman of the Board of the Canada Mining Innovation Council (“CMIC”) and a member of the Advisory Board of Sapling Financial Consultants. In 2013, he was awarded the Queen Elizabeth II Diamond Jubilee Medal for his work with Right To Play where he continues as a member of the Canadian Advisory Board. Mr. Bogden holds a B.Sc. in Applied Science (Geology) from Queen’s University, is a Professional Engineer (Ontario), and earned his professional certification as a Corporate Director (ICD.D) from the Institute of Corporate Directors.

Peter Gianulis, CEO of Allegiant Gold, commented: “Over the past year, I have had the pleasure of working closely with Gord on numerous projects at Allegiant Gold. He is the consummate professional who will serve Allegiant very well as our Chairman as we transition from a project generator to a project developer with Eastside as our flagship project.”

The Board also approved the granting of 1.1 million restricted stock units (“RSUs”) and 1.8 million stock options to directors, officers and consultants. The options are exercisable at $0.35 for a period of 5 years and will vest in four equal parts over 18 months. The RSUs will vest annually over 36 months.

ABOUT ALLEGIANT

Allegiant owns 100% of 10 highly-prospective gold projects in the United States, 7 of which are located in the mining-friendly jurisdiction of Nevada. Four of Allegiant’s projects are farmed-out, providing for cost reductions and cash-flow. Allegiant’s flagship, district-scale Eastside project hosts a large and expanding gold resource and is located in an area of excellent infrastructure. Preliminary metallurgical testing indicates that both oxide and sulphide gold mineralization at Eastside is amenable to heap leaching.

ON BEHALF OF THE BOARD

Peter Gianulis
CEO

For more information contact:

Investor Relations
(604) 634-0970 or
1-888-818-1364
ir@allegiantgold.com

Neither TSX Venture Exchange nor its Regulation Services Provider (as that term is defined in policies of the TSX Venture Exchange) accepts responsibility for the adequacy or accuracy of this release.

Certain statements and information contained in this press release constitute “forward-looking statements” within the meaning of applicable U.S. securities laws and “forward-looking information” within the meaning of applicable Canadian securities laws, which are referred to collectively as “forward-looking statements”. The United States Private Securities Litigation Reform Act of 1995 provides a “safe harbor” for certain forward-looking statements.Allegiant Gold Ltd.’s (“Allegiant”) exploration plans for its gold exploration properties, the drill program at Allegiant’s Eastside project, the preparation and publication of an updated resource estimate in respect of the Original Zone at the Eastside project, Allegiant’s future exploration and development plans, including anticipated costs and timing thereof; Allegiant’s plans for growth through exploration activities, acquisitions or otherwise; and expectations regarding future maintenance and capital expenditures, and working capital requirements. Forward-looking statements are statements and information regarding possible events, conditions or results of operations that are based upon assumptions about future economic conditions and courses of action. All statements and information other than statements of historical fact may be forward-looking statements. In some cases, forward-looking statements can be identified by the use of words such as “seek”, “expect”, “anticipate”, “budget”, “plan”, “estimate”, “continue”, “forecast”, “intend”, “believe”, “predict”, “potential”, “target”, “may”, “could”, “would”, “might”, “will” and similar words or phrases (including negative variations) suggesting future outcomes or statements regarding an outlook. Such forward-looking statements are based on a number of material factors and assumptions and involve known and unknown risks, uncertainties and other factors which may cause actual results, performance or achievements, or industry results, to differ materially from those anticipated in such forward-looking information. You are cautioned not to place undue reliance on forward-looking statements contained in this press release. Some of the known risks and other factors which could cause actual results to differ materially from those expressed in the forward-looking statements are described in the sections entitled “Risk Factors” in Allegiant’s Listing Application, dated January 24, 2018, as filed with the TSX Venture Exchange and available on SEDAR under Allegiant’s profile at www.sedar.com. Actual results and future events could differ materially from those anticipated in such statements. Allegiant undertakes no obligation to update or revise any forward-looking statements included in this press release if these beliefs, estimates and opinions or other circumstances should change, except as otherwise required by applicable law.

Release – QuoteMedia Announces 22 Revenue Growth for Q3 2021


QuoteMedia Announces 22% Revenue Growth for Q3 2021


PHOENIX, Nov. 10, 2021 (GLOBE NEWSWIRE) — QuoteMedia, Inc. (OTCQB: QMCI), a leading provider of market data and financial applications, announced financial results for the quarter ended September 30, 2021.

QuoteMedia provides banks, brokerage firms, private equity firms, financial planners and sophisticated investors with a more economical, higher quality alternative source of stock market data and related research information. We compete with several larger legacy organizations and a modest community of other smaller companies. QuoteMedia provides comprehensive market data services, including streaming data feeds, on-demand request-based data (XML/JSON), web content solutions (financial content for website integration) and applications such as Quotestream Professional desktop and mobile.

Highlights for Q3 2021 include the following:

  • Quarterly revenue increased to $3,818,713 in Q3 2021 from $3,140,358 in Q3 2020, a year over year increase of 22%.
  • Revenue for the nine-month period ended September 30, 2021 increased to $11,257,949 compared to $9,136,141 in same 2020 period, an increase of 23%.
  • Our net income for Q3 2021 was $154,931 compared to a net loss of $75,305 in Q3 2020.
  • Adjusted EBITDA for Q3 2021 was $539,534 compared to $271,091 in Q3 2020.

“We are very pleased with our performance”, said Robert J. Thompson, Chairman of the Board. “We experienced very strong revenue growth, both for the quarter and year to date, and we are expecting to finish the year strong. We are continuing to expand our product offerings, grow our market share and explore exciting new opportunities. This is an exciting time for our company, and the future certainly looks bright.”

QuoteMedia will host a conference call Wednesday, November 10, 2021 at 2:00 PM Eastern Time to discuss the Q3 2021 financial results and provide a business update.

Conference Call Details:

Date: November 10, 2021

Time: 2:00 PM Eastern

Dial-in number: 877?876?9176

Conference ID: QUOTEMEDIA

An audio rebroadcast of the call will be available later at: www.quotemedia.com

About QuoteMedia

QuoteMedia is a leading software developer and cloud-based syndicator of financial market information and streaming financial data solutions to media, corporations, online brokerages, and financial services companies. The Company licenses interactive stock research tools such as streaming real-time quotes, market research, news, charting, option chains, filings, corporate financials, insider reports, market indices, portfolio management systems, and data feeds. QuoteMedia provides industry leading market data solutions and financial services for companies such as the Nasdaq Stock Exchange, TMX Group (TSX Stock Exchange), Canadian Securities Exchange (CSE), London Stock Exchange Group, FIS, U.S. Bank, Broadridge Financial Systems, JPMorgan Chase, CI Financial, Canaccord Genuity Corp., Hilltop Securities, HD Vest, Stockhouse, Zacks Investment Research, General Electric, Boeing, Bombardier, Telus International, Business Wire, PR Newswire, FolioFN, Regal Securities, ChoiceTrade, Cetera Financial Group, Dynamic Trend, Inc., Qtrade Financial, CNW Group, IA Private Wealth, Ally Invest, Inc., Suncor, Virtual Brokers, Leede Jones Gable, Firstrade Securities, Charles Schwab, First Financial, Cirano, Equisolve, Stock-Trak, Mergent, Cision, Warrior Trading and others. Quotestream®, QMod™ and Quotestream Connect™ are trademarks of QuoteMedia. For more information, please visit www.quotemedia.com.

Statements about QuoteMedia’s future expectations, including future revenue, earnings, and transactions, as well as all other statements in this press release other than historical facts are “forward-looking statements” within the meaning of the Private Securities Litigation Reform Act of 1995. QuoteMedia intends that such forward-looking statements be subject to the safe harbors created thereby. These statements involve risks and uncertainties that are identified from time to time in the Company’s SEC reports and filings and are subject to change at any time. QuoteMedia’s actual results and other corporate developments could differ materially from that which has been anticipated in such statements.

Below are the specific forward-looking statements included in this press release:

  • We experienced very strong revenue growth, both for the quarter and year to date, and we are expecting to finish the year strong. We are continuing to expand our product offerings, grow our market share and explore exciting new opportunities. This is an exciting time for our company, and the future certainly looks bright

QuoteMedia Investor Relations
Brendan Hopkins
Email: investors@quotemedia.com
Call: (407) 645-5295

Note 1 on Non-GAAP Financial Measures

We believe that Adjusted EBITDA, as a non-GAAP pro forma financial measure, provides meaningful information to investors in terms of enhancing their understanding of our operating performance and results, as it allows investors to more easily compare our financial performance on a consistent basis compared to the prior year periods. This non-GAAP financial measure also corresponds with the way we expect investment analysts to evaluate and compare our results. Any non-GAAP pro forma financial measures should be considered only as supplements to, and not as substitutes for or in isolation from, or superior to, our other measures of financial information prepared in accordance with GAAP, such as net income attributable to QuoteMedia, Inc.

We define and calculate Adjusted EBITDA as net income attributable to QuoteMedia, Inc., plus: 1) depreciation and amortization, 2) stock compensation expense, 3) interest expense, 4) foreign exchange loss (or minus a foreign exchange gain), and 5) income tax expense. We disclose Adjusted EBITDA because we believe it is a useful metric by which to compare the performance of our business from period to period. We understand that measures similar to Adjusted EBITDA are broadly used by analysts, rating agencies, investors and financial institutions in assessing our performance. Accordingly, we believe that the presentation of Adjusted EBITDA provides useful information to investors. The table below provides a reconciliation of Adjusted EBITDA to net income attributable to QuoteMedia, Inc., the most directly comparable GAAP financial measure.

Quotemedia, Inc. Adjusted EBITDA Reconciliations to Net Income (Loss)

Three-months ended September 30, Nine-months ended September 30,
2021 2020 2021 2020
Net income (loss) $ 154,931 $ (75,305 ) $ 98,393 $ (319,728 )
Depreciation and amortization 432,051 343,935 1,182,917 971,274
Stock-based compensation 6,939 6,939 20,817 30,933
Interest expense 101 701 1,560 3,419
Foreign exchange loss (gain) (55,278 ) (5,930 ) (77,606 ) (11,887 )
Income tax expense 790 751 2,403 2,216
PPP loan forgiveness (133,257 )
Adjusted EBITDA $ 539,534 $ 271,091 $ 1,095,227 $ 676,227

Release – Comstock Announces Third Quarter 2021 Results and Business Update


Comstock Announces Third Quarter 2021 Results and Business Update


Commercializing Breakthroughs in both Lithium and Carbon Extractions

VIRGINIA CITY, Nev., Nov. 10, 2021 (GLOBE NEWSWIRE) — Comstock Mining Inc. (NYSE: LODE) (“Comstock” and the “Company”), a developer of advanced new clean technologies for use in meeting the rapidly increasing global demand for clean energy, carbon-neutrality, and natural products, today announced its unaudited financial results for the period ending September 30, 2021, and provided a business update.

“We are now enabling systemic decarbonization, that is our mission,” said Corrado De Gasperis, Comstock’s Executive Chairman and Chief Executive Officer. “Our acquisitions have assembled breakthrough clean technologies with intellectual property, operating systems, facilities and a senior management team focused on one goal: to accelerate decarbonization through self-sustaining, throughput generating businesses capable of exponential growth.”

Selected Strategic Highlights

  • Cellulosic Fuels. Acquired Plain Sight Innovations Corporation (“PSI”) with its first facility expected to scale up to an initial capacity exceeding 330,000 tons per year of forestry wastes over its first three years of operations, as it extracts and refines carbon-neutral woody biomasses into ethanol, biodiesel and marine fuels.

  • Lithium-ion Battery Metal Recycling. Acquired the rights to a majority equity stake in LINICO Corporation, a lithium-ion battery (“LIB”) recycling company that owns the rights to a 100,000 ton per annum state-of-the-art battery metal recycling facility in the Tahoe Reno Industrial (“TRI”) Center in Storey County, Nevada.

  • Enabling Lithium Extraction. LINICO’s facility and separation systems are designed for, and situated to, receive, crush and separate battery materials into high purity black mass, and is currently enabling a breakthrough, front-end lithium extraction technology.

  • Engineering, Construction and Manufacturing. Acquired Renewable Process Solutions (RPS) with the direct engineering and construction management for engineering, manufacturing, and commissioning state of the art cellulosic fuel extraction facilities and unique LIB crushing, separating and lithium extraction solutions.

  • Mineral Extraction and Remediation. Acquired fifty percent of MCU Philippines Inc. (MCU-P), currently operating in Monkayo, Davao de Oro, Philippines, as the Naboc River Rehabilitation begins full ramp up.

  • Quantum Sensing and Material Generation. Acquired the rights to a fifty percent equity stake in Quantum Generative Materials LLC (GenMat), which is accelerating the generation of new materials for use in batteries, carbon capture and utilization, aerospace, and mining applications.

“We are systemically strengthening our organization in ways that sustainably contribute to humanity’s rapidly-escalating demand for increasingly scarce natural resources, including the strategic resources needed to fuel the worldwide surge in, and transition to, clean energy and carbon-neutrality,” added DeGasperis. “We have a singular focus on a few, breakthrough businesses that will lead in renewable minerals and fuels used mostly in transportation.”

Unaudited Nine Month Selected Financial Highlights

  • Total operating costs were $3.5 million for the nine months ended September 30, 2021, corresponding to a 13.9% decrease from the comparable prior period due to lower mining and mine claim costs and reclamation liability estimates, offset somewhat by higher selling, general and administrative costs.

  • Net loss was $7.6 million, or a loss of $0.17 per common share, for the nine months ended September 30, 2021, as compared to net income of $18.3 million, or $0.63 per common share, for the comparable 2020 period. The 2021 loss primarily was the result of a $3.0 million loss from operations, versus a $3.9 million loss from operations for the comparable prior year period, a $2.7 million decrease in the fair value of derivative assets and liabilities, and $2.2 million of unrealized losses on Tonogold common shares. The 2020 income was primarily attributed to the gain on the sale to Tonogold of the entity owning the Lucerne mine.

  • Total assets increased to $107.4 million at September 30, 2021, a 149% increase from December 31, 2020;

  • Total debt decreased to $0, a 100% decrease from year end 2020, as all debt obligations were extinguished;

  • Cash and cash equivalents and restricted cash at September 30, 2021 was $3.4 million; and,

  • Common shares outstanding at September 30, 2021, were 64,402,789.

Mr. De Gasperis stated, “We have transformed our balance sheet, enhanced our senior management, completely repositioned our system into renewable growth assets, significantly increased director and officer stock ownership, and aligned compensation with our shareholders. If we do not deliver, we do not vest, it’s that simple.”

Focus on Value Creation from Throughput and Decarbonization

“Speed of cash generation and decarbonization are the lowest common denominators in each of our businesses,” continued DeGasperis. “Our team is focused on the tactical activities necessary to enable rapid and exponential financial, natural and social gains. We’ve structured each of our acquisitions to minimize dilution while positioning each line of business with its own cash, equity, and balance sheets, for this growth. We believe this will accelerate and exceed our pledge to sustainably deliver more than $12 per share by 2023. Frankly, we believe our existing platform is already worth multiples of that target based on comparable valuations.”

Breakthrough Lithium-Ion Battery Recycling Technologies Enable Growth

Comstock previously announced the filing of a Written Determination of Hazardous Waste Recycling (“Application”) by LINICO and its state-of-the-art lithium-ion battery (“LIB”) recycling facility. Construction of the first phase of these new processes will commence at the recycling facility upon approval of the Application, with anticipated completion and start-up during the first half of 2022. The Company is expanding that application to include front-end, lithium extraction, a breakthrough technology expected to be showcased during the first half of 2022.

LINICO has recently signed a collaboration agreement with Aqua Metals Inc., a cleantech innovator focused on closed-loop battery recycling, to process high purity battery black mass into high-quality metals. This agreement, which sets the parameters for research and development cooperation, strengthens both companies’ expansion into lithium-ion battery recycling and builds on the two companies’ commitment to advancing best-in-class technologies designed to recycle lithium-ion batteries cost-effectively and sustainably.

About 500,000 tons of expired LIBs containing over $900 million in strategic metals are being landfilled globally. A recent industry report estimated annual growth to more than $26 billion over the next two decades. LiNiCo is positioning itself for capitalizing on that tremendous growth over the next decade, and beyond.

Renewable Process Solutions, An Engineering Powerhouse

LINICO’s previously announced capacity breakthroughs are the direct result of our recently acquired engineering, procurement, and construction (“EPC”) company, Renewable Process Solutions, Inc. (“RPS”).

“Almost instantaneously, Comstock’s network of engineering and advanced manufacturing experts integrated themselves into the LiNiCo team, enhancing designs, ensuring quality, reducing capital requirements and shortening lead times,” stated Mr. DeGasperis. “We believe our ability to crush charged batteries is an industry breakthrough, resulting in higher purity black mass. When our engineers began developing lithium extraction processes for us in real time, with their existing know-how, resulting in breakthroughs we plan on showcasing during the first half of 2022.”

Plain Sight Innovations

Plain Sight Innovations LLC (“PSI”), is delivering breakthroughs on several cellulosic technologies, including existing processes for the efficient extraction and valorization of cellulosic fuels from ubiquitous low-cost sources of woody biomass feedstock, with a recent breakthrough in the processing speed for cellulosic fuels.

“We recently had a breakthrough in our cellulosic extraction process, tripling throughput and positioning us to finalize the design and engineering of our first cellulosic fuel facility,” continued DeGasperis. “We are also expanding that capacity with strategic partners, with a significant number of new, world-class partnerships about to be consummated. These partnerships result in faster revenues and profits, for 2022, and well beyond.”

Triple Bottom Line

DeGasperis concluded: “We are building a self-sustaining system that develops, builds, scales, and operates systemically-managed, rapidly-scalable, throughput-generating businesses that serve very large, fast-growing markets that enable exponential revenue growth, make globally-meaningful contributions to atmospheric carbon reductions and positive social outcomes. Our plan begins with the commencement of operations in our lithium-ion battery recycling, the commencement of construction of a cellulosic fuel and related by products plant in 2022, and the rapid satisfaction of our performance objectives that exceed our $500,000,000 market value goal well before 2023.”

Conference Call

The Company will host a conference call today, November 10, 2021 at 8:00 a.m. Pacific Time/11:00 a.m. Eastern Time to report Third Quarter results and provide a business update. The Webcast will include a moderated Q&A, after the prepared remarks. Please join the event 10 to 15 minutes prior to the scheduled start time. The link to register in advance for this live Webcast is as follows:

Register in Advance for Our Zoom Webinar
When: November 10, 2021 08:00 AM Pacific Time (US and Canada)
Topic: Comstock Mining Third Quarter 2021 Results and Business Update

Please click this link to register in advance for this webcast:

After registering, you will receive a confirmation email containing information about joining the Webcast.

The recording of the Webcast will be available, within 48 hours of the call, on the Company website:
http://www.comstockmining.com/investors/investor-library

About Comstock Mining Inc.

Comstock Mining Inc. (NYSE: LODE) (the “Company”) a leading developer of advanced new clean technologies for use in meeting the rapidly increasing global demand for clean energy, carbon-neutrality, and natural products. To learn more, please visit www.comstockmining.com.

Forward-Looking Statements

This press release and any related calls or discussions may include forward-looking statements within the meaning of Section 27A of the Securities Act of 1933, as amended, and Section 21E of the Securities Exchange Act of 1934, as amended. All statements, other than statements of historical facts, are forward-looking statements. The words “believe,” “expect,” “anticipate,” “estimate,” “project,” “plan,” “should,” “intend,” “may,” “will,” “would,” “potential” and similar expressions identify forward-looking statements but are not the exclusive means of doing so.

Forward-looking statements include statements about matters such as: future industry market conditions; future explorations or acquisitions; future changes in our exploration activities; future prices and sales of, and demand for, our products; land entitlements and uses; permits; production capacity and operations; operating and overhead costs; future capital expenditures and their impact on us; operational and management changes (including changes in the Board of Directors); changes in business strategies, planning and tactics; future employment and contributions of personnel, including consultants; future land sales; investments, acquisitions, joint ventures, strategic alliances, business combinations, operational, tax, financial and restructuring initiatives, including the nature, timing and accounting for restructuring charges, derivative assets and liabilities and the impact thereof; contingencies; litigation, administrative or arbitration proceedings; environmental compliance and changes in the regulatory environment; offerings, limitations on sales or offering of equity or debt securities, including asset sales and associated costs; and future working capital, costs, revenues, business opportunities, debt levels, cash flows, margins, taxes, earnings and growth. These statements are based on assumptions and assessments made by our management in light of their experience and their perception of historical and current trends, current conditions, possible future developments and other factors they believe to be appropriate. Forward-looking statements are not guarantees, representations or warranties and are subject to risks and uncertainties, many of which are unforeseeable and beyond our control and could cause actual results, developments and business decisions to differ materially from those contemplated by such forward-looking statements. Some of those risks and uncertainties include the risk factors set forth in our filings with the SEC and the following: adverse effects of climate changes or natural disasters; adverse effects of global or regional pandemic disease spread or other crises; global economic and capital market uncertainties; the speculative nature of gold or mineral exploration, mercury remediation and lithium, nickel and cobalt recycling, including risks of diminishing quantities or grades of qualified resources; operational or technical difficulties in connection with exploration or mercury remediation, metal recycling, processing or mining activities; costs, hazards and uncertainties associated with precious metal based activities, including environmentally friendly and economically enhancing clean mining and processing technologies, precious metal exploration, resource development, economic feasibility assessment and cash generating mineral production; costs, hazards and uncertainties associated with mercury remediation, metal recycling, processing or mining activities; contests over our title to properties; potential dilution to our stockholders from our stock issuances, recapitalization and balance sheet restructuring activities; potential inability to comply with applicable government regulations or law; adoption of or changes in legislation or regulations adversely affecting our businesses; permitting constraints or delays; ability to achieve the benefits of business opportunities that may be presented to, or pursued by, us, including those involving battery technology, mercury remediation technology and efficacy, quantum computing and advanced materials development, and development of cellulosic technology in bio-fuels and related carbon-based material production; ability to successfully identify, finance, complete and integrate acquisitions, joint ventures, strategic alliances, business combinations, asset sales, and investments that we may be party to in the future; changes in the United States or other monetary or fiscal policies or regulations; interruptions in our production capabilities due to capital constraints; equipment failures; fluctuation of prices for gold or certain other commodities (such as silver, zinc, lithium, nickel, cobalt, cyanide, water, diesel, gasoline and alternative fuels and electricity); changes in generally accepted accounting principles; adverse effects of war, mass shooting, terrorism and geopolitical events; potential inability to implement our business strategies; potential inability to grow revenues; potential inability to attract and retain key personnel; interruptions in delivery of critical supplies, equipment and raw materials due to credit or other limitations imposed by vendors; assertion of claims, lawsuits and proceedings against us; potential inability to satisfy debt and lease obligations; potential inability to maintain an effective system of internal controls over financial reporting; potential inability or failure to timely file periodic reports with the Securities and Exchange Commission; potential inability to list our securities on any securities exchange or market or maintain the listing of our securities; and work stoppages or other labor difficulties. Occurrence of such events or circumstances could have a material adverse effect on our business, financial condition, results of operations or cash flows, or the market price of our securities. All subsequent written and oral forward-looking statements by or attributable to us or persons acting on our behalf are expressly qualified in their entirety by these factors. Except as may be required by securities or other law, we undertake no obligation to publicly update or revise any forward-looking statements, whether as a result of new information, future events, or otherwise.

Neither this press release nor any related calls or discussions constitutes an offer to sell, the solicitation of an offer to buy or a recommendation with respect to any securities of the Company, the fund or any other issuer.

Contact Information

Comstock Mining Inc.
P.O. Box 1118
Virginia City, NV 89440
www.comstockmining.com

Corrado De Gasperis
Executive Chairman & CEO
Tel (775) 847-4755
degasperis@comstockmining.com

Zach Spencer
Director of External Relations
Tel (775) 847-5272 Ext.151
questions@comstockmining.com

Release – Helius Medical Technologies Inc. Announces Pricing of $9.6 Million Underwritten Public Offering of Common Stock


Helius Medical Technologies, Inc. Announces Pricing of $9.6 Million Underwritten Public Offering of Common Stock


NEWTOWN, Pa., Nov. 10, 2021 (GLOBE NEWSWIRE) — Helius Medical Technologies, Inc. (Nasdaq: HSDT) (“Helius” or the “Company”), a neurotech company focused on neurological wellness, today announced the pricing of an underwritten registered public offering of 1,204,375 shares of its common stock at a price to the public of $8.00 per share.

All of the shares of common stock to be sold in the offering will be sold by the Company. In addition, the Company has granted the underwriter a 45-day option to purchase up to an additional 180,656 shares of its common stock at the public offering price less the underwriting discount.

The gross proceeds to the Company from this offering, before deducting underwriting discounts and commissions and offering expenses, but excluding any exercise of the underwriters’ option to purchase additional shares, are expected to be approximately $9.6 million. The offering is scheduled to close on or about November 12, 2021, subject to customary closing conditions.

The Company intends to use the net proceeds from this proposed offering for funding operations, working capital and other general corporate purposes.  

Ladenburg Thalmann & Co. Inc. is acting as the sole book-running manager for the offering.

The shares will be issued pursuant to a shelf registration statement on Form S-3 (File No. 333-236101) that was declared effective by the U.S. Securities and Exchange Commission (“SEC”), on February 6, 2020. The Company will file a final prospectus supplement with the SEC relating to such shares of common stock. Copies of the final prospectus supplement and the accompanying prospectus relating to and describing the terms of the offering may be obtained, when available, at the SEC’s website at www.sec.gov or by contacting Ladenburg Thalmann & Co. Inc., Prospectus Department, 640 Fifth Avenue, 4th floor, New York, NY 10019 by email at prospectus@ladenburg.com.

This press release does not and shall not constitute an offer to sell or the solicitation of an offer to buy any securities, nor shall there be any sale of these securities in any state or other jurisdiction in which such offer, solicitation or sale would be unlawful prior to registration or qualification under the securities laws of any such state or other jurisdiction. Any offer, if at all, will be made only by means of a prospectus, including a prospectus supplement, forming a part of the effective registration statement.

About Helius Medical Technologies, Inc.

Helius Medical Technologies is a neurotech company focused on neurological wellness. The Company’s purpose is to develop, license and acquire unique and non-invasive platform technologies that amplify the brain’s ability to heal itself. The Company’s first commercial product is the Portable Neuromodulation Stimulator (PoNS™). For more information, visit www.heliusmedical.com.

Forward Looking Statements

Certain statements in this news release are not based on historical facts and constitute forward-looking statements or forward-looking information within the meaning of the U.S. Private Securities Litigation Reform Act of 1995 and Canadian securities laws. All statements other than statements of historical fact included in this news release are forward-looking statements that involve risks and uncertainties. Forward-looking statements are often identified by terms such as “believe,” “continue,” “intends to,” “expect,” “will,” “goal,” “aim to” and similar expressions. Such forward-looking statements include, among others, statements regarding the Company’s anticipated closing of the public offering and anticipated use of proceeds therefrom.

There can be no assurance that such statements will prove to be accurate and actual results and future events could differ materially from those expressed or implied by such statements. Important factors that could cause actual results to differ materially from the Company’s expectations include risks and uncertainties related to market and other conditions, the satisfaction of customary closing conditions related to the proposed public offering, the impact of general economic, industry or political conditions in the United States or internationally and other risks described under the heading “Risk Factors” in our filings with the Securities and Exchange Commission and the Canadian securities regulators, which can be obtained from either at www.sec.gov or www.sedar.com.

The reader is cautioned not to place undue reliance on any forward-looking statement. The forward-looking statements contained in this news release are made as of the date of this news release and the Company assumes no obligation to update any forward-looking statement or to update the reasons why actual results could differ from such statements except to the extent required by law.

Investor Relations Contact:

Lisa M. Wilson
In-Site Communications, Inc.
T: 212-452-2793
E: lwilson@insitecony.com 

Ocugen (OCGN) – Ocugen Reports 3Q21 and Reviews Recent Progress

Wednesday, November 10, 2021

Ocugen (OCGN)
Ocugen Reports 3Q21 and Reviews Recent Progress

Ocugen Inc is a clinical stage biopharmaceutical company. It is focused on discovering, developing and commercializing a pipeline of innovative therapies that address rare and underserved eye diseases. Ocugen offers a diversified ophthalmology portfolio that includes novel gene therapies, biologics, and small molecules and targets a broad range of high-need retinal and ocular surface diseases.

Robert LeBoyer, Senior Research Analyst, Noble Capital Markets, Inc.

Refer to the full report for the price target, fundamental analysis, and rating.

    Financial Results For 3Q21 Within Expectations Ocugen reported 3Q21 financial results of a loss of $10.8 million or $(0.05) per share, compared with our estimated loss of $8.8 million or $(0.04) per share.  The difference was largely due to higher R&D spending related to regulatory expenses and the start of the Covaxin immune-bridging study. The company ended the quarter with $107.3 million in cash.

    Covaxin Continues Making Progress Toward Approval The company held a conference call in which it reviewed progress during the quarter, including an FDA application for Emergency Use Authorization in children ages 2 to 18.  The approval process in Canada is proceeding as expected. We continue to expect product approval during 2022 in Canada and 2023 in the US …


This Company Sponsored Research is provided by Noble Capital Markets, Inc., a FINRA and S.E.C. registered broker-dealer (B/D).

*Analyst certification and important disclosures included in the full report. NOTE: investment decisions should not be based upon the content of this research summary.  Proper due diligence is required before making any investment decision. 

Sierra Metals (SMTS)(SMT:CA) – Third Quarter Results May Be An Inflection Point

Wednesday, November 10, 2021

Sierra Metals (SMTS)(SMT:CA)
Third Quarter Results May Be An Inflection Point

As of April 24, 2020, Noble Capital Markets research on Sierra Metals is published under ticker symbols (SMTS and SMT:CA). The price target is in USD and based on ticker symbol SMTS. Research reports dated prior to April 24, 2020 may not follow these guidelines and could account for a variance in the price target.

Sierra Metals Inc is a precious and base metals producer in Latin America. The company acquires, explores, extracts, and produces mineral concentrates consisting of silver, copper, lead, zinc and gold in Mexico and Peru. Its activity includes the operation of the Yauricocha Mine in Peru, and the Bolivar and Cusi mines in Mexico. Yauricocha is an underground polymetallic mine using the sublevel block caving and cut-and-fill mining methods. Bolivar is a copper-silver-zinc-gold underground mine using room-and-pillar mining method. The majority of the revenue is earned by selling of the mineral concentrates to its customers in Peru.

Mark Reichman, Senior Research Analyst of Natural Resources, Noble Capital Markets, Inc.

Refer to the full report for the price target, fundamental analysis, and rating.

    SMTS reports third quarter financial results. Sierra Metals generated an adjusted loss of $(0.02) per share and EBITDA of $17.4 million, compared to our EPS and EBITDA estimates of $0.06 and $29.5 million, respectively. On an unadjusted basis, Sierra Metals reported a loss of $(0.03) per share. Performance at the Bolivar mine has been negatively impacted by delays in mine development, infill drilling, and high personnel turnover. We did not anticipate a loss from mining operations at Bolivar where all in sustaining costs per copper equivalent pound were impacted by higher operating costs per tonne, sustaining capital, general and administrative costs, and treatment and refining costs. Development of higher-grade ore bodies is underway and we expect continued improvement with a return to normalized operations and earnings power within a quarter or two.

    Updating estimates.  Management revised its full year EBITDA guidance to $105 million to $110 million from $130 million to $140 million due to a lower contribution from Bolivar which is now expected to generate EBITDA in the range of $22 million to $26 million. We have revised our 2021 EPS and EBITDA estimates to $0.13 and $105.7 million, respectively, from $0.25 and $127.6 million. We have also …


This Company Sponsored Research is provided by Noble Capital Markets, Inc., a FINRA and S.E.C. registered broker-dealer (B/D).

*Analyst certification and important disclosures included in the full report. NOTE: investment decisions should not be based upon the content of this research summary.  Proper due diligence is required before making any investment decision. 

Flotek Industries (FTK) – Results in Line Absent Nonrecurring Items All Signs Point To Improvements in 2022

Wednesday, November 10, 2021

Flotek Industries (FTK)
Results in Line Absent Nonrecurring Items, All Signs Point To Improvements in 2022

Flotek Industries, Inc. creates solutions to reduce the environmental impact of energy on air, water, land and people. Flotek Industries, Inc. is a technology-driven, specialty chemistry and data company that helps customers across industrial, commercial and consumer markets improve their Environmental, Social and Governance performance. Flotek’s Chemistry Technologies segment develops, manufactures, packages, distributes, delivers, and markets high-quality cleaning, disinfecting and sanitizing products for commercial, governmental and personal consumer use. Additionally, Flotek empowers the energy industry to maximize the value of their hydrocarbon streams and improve return on invested capital through its real-time data platforms and green chemistry technologies. Flotek serves downstream, midstream and upstream customers, both domestic and international. Flotek is a publicly traded company headquartered in Houston, Texas, and its common shares are traded on the New York Stock Exchange under the ticker symbol “FTK.” For additional information, please visit Flotek’s web site at www.flotekind.com.

Michael Heim, Senior Research Analyst, Noble Capital Markets, Inc.

Refer to the full report for the price target, fundamental analysis, and rating.

    Flotek Industries reported 2021-3Q results (excluding nonrecurring items) that were generally in line with expectations. Flotek reported revenues of $10.2 million, in line with our estimate of $10.1 million. Income from operations was $0.6 million, which was well above our expectations for a loss of $5.6 million. The primary difference was due to a $7.6 million reduction in operating costs stemming from a positive settlement. EPS was $0.01 but would have been ($0.10) absent the settlement, slightly below our ($0.08) projection.

    Flotek is setting itself up for improved results in 2022.  Management has focused on growing and stabilizing topline results. It has expanded its salesforce and put them on incentive-based compensation, signed new distribution agreements, emphasized subscription-based sales, introduced new products geared towards international sales, and held C-suite meetings to highlight the environmental benefits …


This Company Sponsored Research is provided by Noble Capital Markets, Inc., a FINRA and S.E.C. registered broker-dealer (B/D).

*Analyst certification and important disclosures included in the full report. NOTE: investment decisions should not be based upon the content of this research summary.  Proper due diligence is required before making any investment decision. 

Endeavour Silver (EXK)(EDR:CA) – Expecting A Strong Finish to the Year

Wednesday, November 10, 2021

Endeavour Silver (EXK)(EDR:CA)
Expecting A Strong Finish to the Year

As of April 24, 2020, Noble Capital Markets research on Endeavour Silver is published under ticker symbols (EXK and EDR:CA). The price target is in USD and based on ticker symbol EXK. Research reports dated prior to April 24, 2020 may not follow these guidelines and could account for a variance in the price target.

Endeavour Silver Corp is a precious metal mining company. The company is primarily engaged in silver mining and owns three high-grade, underground, silver-gold mines in Mexico. Its other business activities include acquisition, exploration, development, extraction, processing, refining and reclamation. The company is organized into four operating mining segments, Guanacevi, Bolanitos, El Cubo, and El Compas, which are located in Mexico as well as Exploration and Corporate segments. Its Exploration segment consists of projects in the exploration and evaluation phases in Mexico and Chile.

Mark Reichman, Senior Research Analyst of Natural Resources, Noble Capital Markets, Inc.

Refer to the full report for the price target, fundamental analysis, and rating.

    Third quarter 2021 results. Endeavour reported a third quarter net loss of $4.5 million, or $(0.03) per share, compared to net income of $451 thousand, or $0.00 per share, during the prior year period. We had projected net income of $790 thousand or $0.00 per share. Mine operating earnings were $1.4 million lower than our estimate primarily due to lower revenue and higher depreciation, depletion, and amortization expense. The financial results were not indicative of operations since the company withheld a significant amount of production for inventory due to lower commodity prices which it expects to sell during the fourth quarter. At quarter end, Endeavour held 1,030,304 ounces of silver and 1,211 ounces of gold bullion inventory and 37,100 ounces of silver and 2,028 ounces of gold in concentrate inventory.

    Updating estimates.  We have increased our 2021 EPS and EBITDA estimates to $0.02 and $44.4 million, respectively, from $0.01 and $42.9 million. The revision reflects stronger fourth quarter earnings due to sales from inventory. Our 2022 EPS and EBITDA estimates remain $0.15 and $67.2 million …


This research is provided by Noble Capital Markets, Inc., a FINRA and S.E.C. registered broker-dealer (B/D).

*Analyst certification and important disclosures included in the full report. NOTE: investment decisions should not be based upon the content of this research summary.  Proper due diligence is required before making any investment decision.